

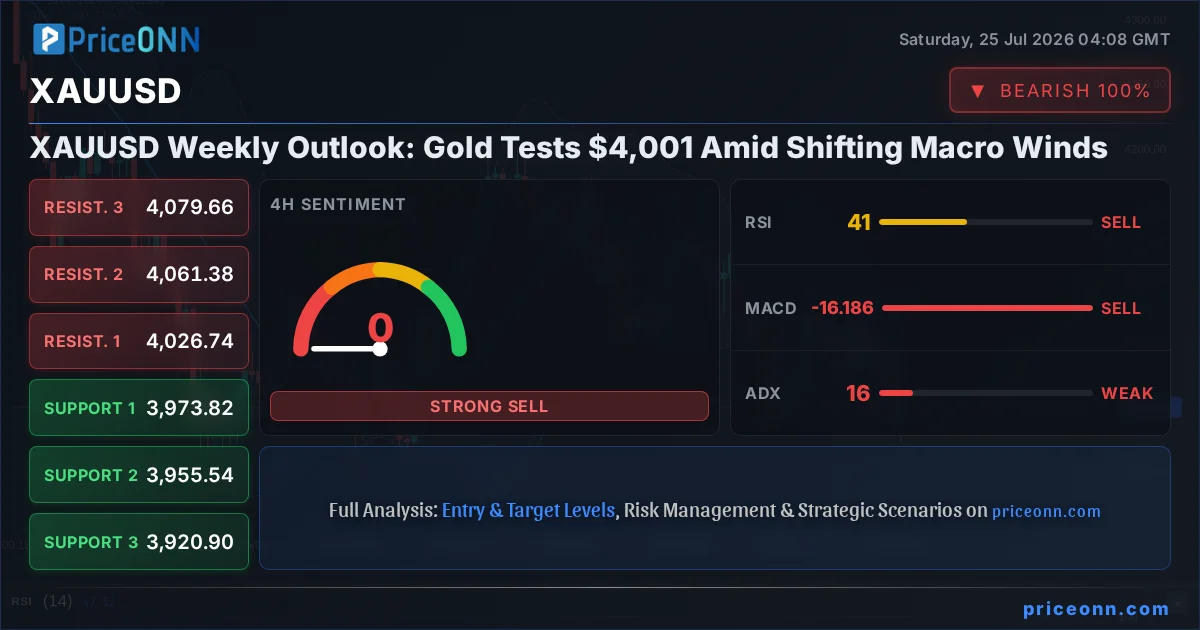
The narrative surrounding gold has shifted dramatically over the past week, with the precious metal currently trading at $4,001.21. What began as a period of cautious optimism, fueled by geopolitical tensions and a potential pause in aggressive central bank tightening, has morphed into a story of renewed dollar strength and concerns over sticky inflation. This pivot has put significant pressure on XAUUSD, pushing it lower despite underlying safe-haven demand. Understanding the interplay between these macro forces and the technical picture is crucial for navigating the current choppy market conditions. The past week saw a definitive rejection of higher prices, with a notable pushback from resistance levels that ultimately led to a cascading sell-off. This is exactly where you need to pay attention - the market is presenting a clear picture, but the interpretation requires a deep dive into the data.
- With RSI at 37.81 on the 1H chart, bulls are losing steam, indicating potential for further downside pressure.
- Critical support for XAUUSD sits at $3,991.8, a level tested multiple times this week, with a break below potentially signaling a deeper correction.
- The ADX at 15.79 on the 4H chart suggests a weak trend, indicating choppiness and a risky environment for aggressive directional trades.
- Fed rate hike expectations, alongside a strengthening DXY currently at 100.7, are driving XAUUSD's correlation with the dollar.
Navigating the Currents: Macro Forces at Play
The global economic landscape has been a turbulent sea of late, and gold has found itself caught in the crosscurrents. Last week’s price action for XAUUSD, currently hovering around $4,001.21, was heavily influenced by a confluence of macroeconomic developments. Initially, markets were pricing in a potential shift in central bank rhetoric, with some anticipating a more dovish stance from the Federal Reserve. This sentiment, coupled with ongoing Middle East tensions that typically boost safe-haven assets like gold, created a supportive environment. However, this narrative quickly unraveled. Fresh data suggesting inflation remains stubbornly high, particularly with the rally in oil prices nearing $100 per barrel for Brent crude, has forced a repricing of interest rate expectations. The dollar index (DXY), currently at 100.7, has benefited significantly from this shift, strengthening against its major peers and exerting downward pressure on dollar-denominated assets like gold. This dynamic highlights the delicate balance traders must maintain, constantly reassessing the dominant theme - whether it's geopolitical risk, inflation concerns, or central bank policy - that is driving market sentiment.
The impact of rising oil prices cannot be overstated in this context. Brent crude, trading near $83.79, acts as a potent inflation catalyst. When oil prices surge, they increase transportation costs and energy expenditures across the board, feeding directly into consumer price indices. This inflationary pressure compels central banks, particularly the Federal Reserve, to consider maintaining a hawkish stance or even accelerating rate hikes to combat it. The forex markets have already reacted, with the dollar showing renewed strength. This inverse correlation between the dollar and gold is a well-established phenomenon. As the DXY climbs, gold typically becomes more expensive for holders of other currencies, dampening demand. The current price action of XAUUSD, falling despite geopolitical risks, underscores the dominant influence of the Fed’s potential policy path and the resulting dollar strength. This is a critical juncture where the market is weighing immediate geopolitical fears against the more persistent threat of inflation and the policy response it necessitates.
Furthermore, the European Central Bank (ECB) also made its presence felt last week. While the ECB held rates steady as expected, its commentary and outlook on inflation spillovers from energy prices were closely watched. Any hint of a more hawkish bias from the ECB, even in the face of economic headwinds, could contribute to broader currency market volatility and further influence the DXY’s trajectory. The EURUSD pair, currently at 1.14436, has shown resilience but remains sensitive to these policy divergences. The interplay between the Fed and the ECB, especially concerning their respective battles against inflation, creates a complex backdrop for gold. If the Fed continues to signal higher-for-longer rates while the ECB adopts a similar stance, the demand for gold as an inflation hedge might be overshadowed by the higher yields offered by dollar- and euro-denominated assets.
The market’s reaction to these macro shifts has been swift. The initial optimism for gold, driven by safe-haven flows amid Middle East tensions, has been largely overshadowed by the renewed focus on inflation and interest rates. This is evident in the price action of XAUUSD, which has failed to hold gains above key resistance levels. The technical indicators, which we will delve into shortly, are beginning to reflect this underlying bearish sentiment, suggesting that the path of least resistance may currently be to the downside. The coming days will be critical as traders digest further economic data and central bank commentary, seeking clarity on the future direction of monetary policy and its implications for inflation and, consequently, for gold prices. This ongoing recalibration of market expectations is what makes the current environment so dynamic and, for disciplined traders, potentially rewarding.
Technical Breakdown: Chart Patterns and Indicator Signals
While the macroeconomic narrative provides the 'why' behind gold's recent slide, the technical analysis offers the 'how' and 'where'. XAUUSD, currently trading at $4,001.21, is exhibiting clear bearish signals across multiple timeframes, painting a picture of caution for bulls. On the 1-hour chart, the trend is neutral, but the ADX at 20.26 indicates a moderately strong downtrend is present, coupled with an RSI of 37.81 suggesting further downside potential. The MACD is below its signal line, reinforcing negative momentum. The Stochastic oscillator, however, is showing a slight bullish divergence (%K > %D), a lone signal of potential buyer interest in the very short term, but it’s not enough to override the broader bearish picture. Bollinger Bands are also showing the price action below the middle band, indicating a bearish bias.
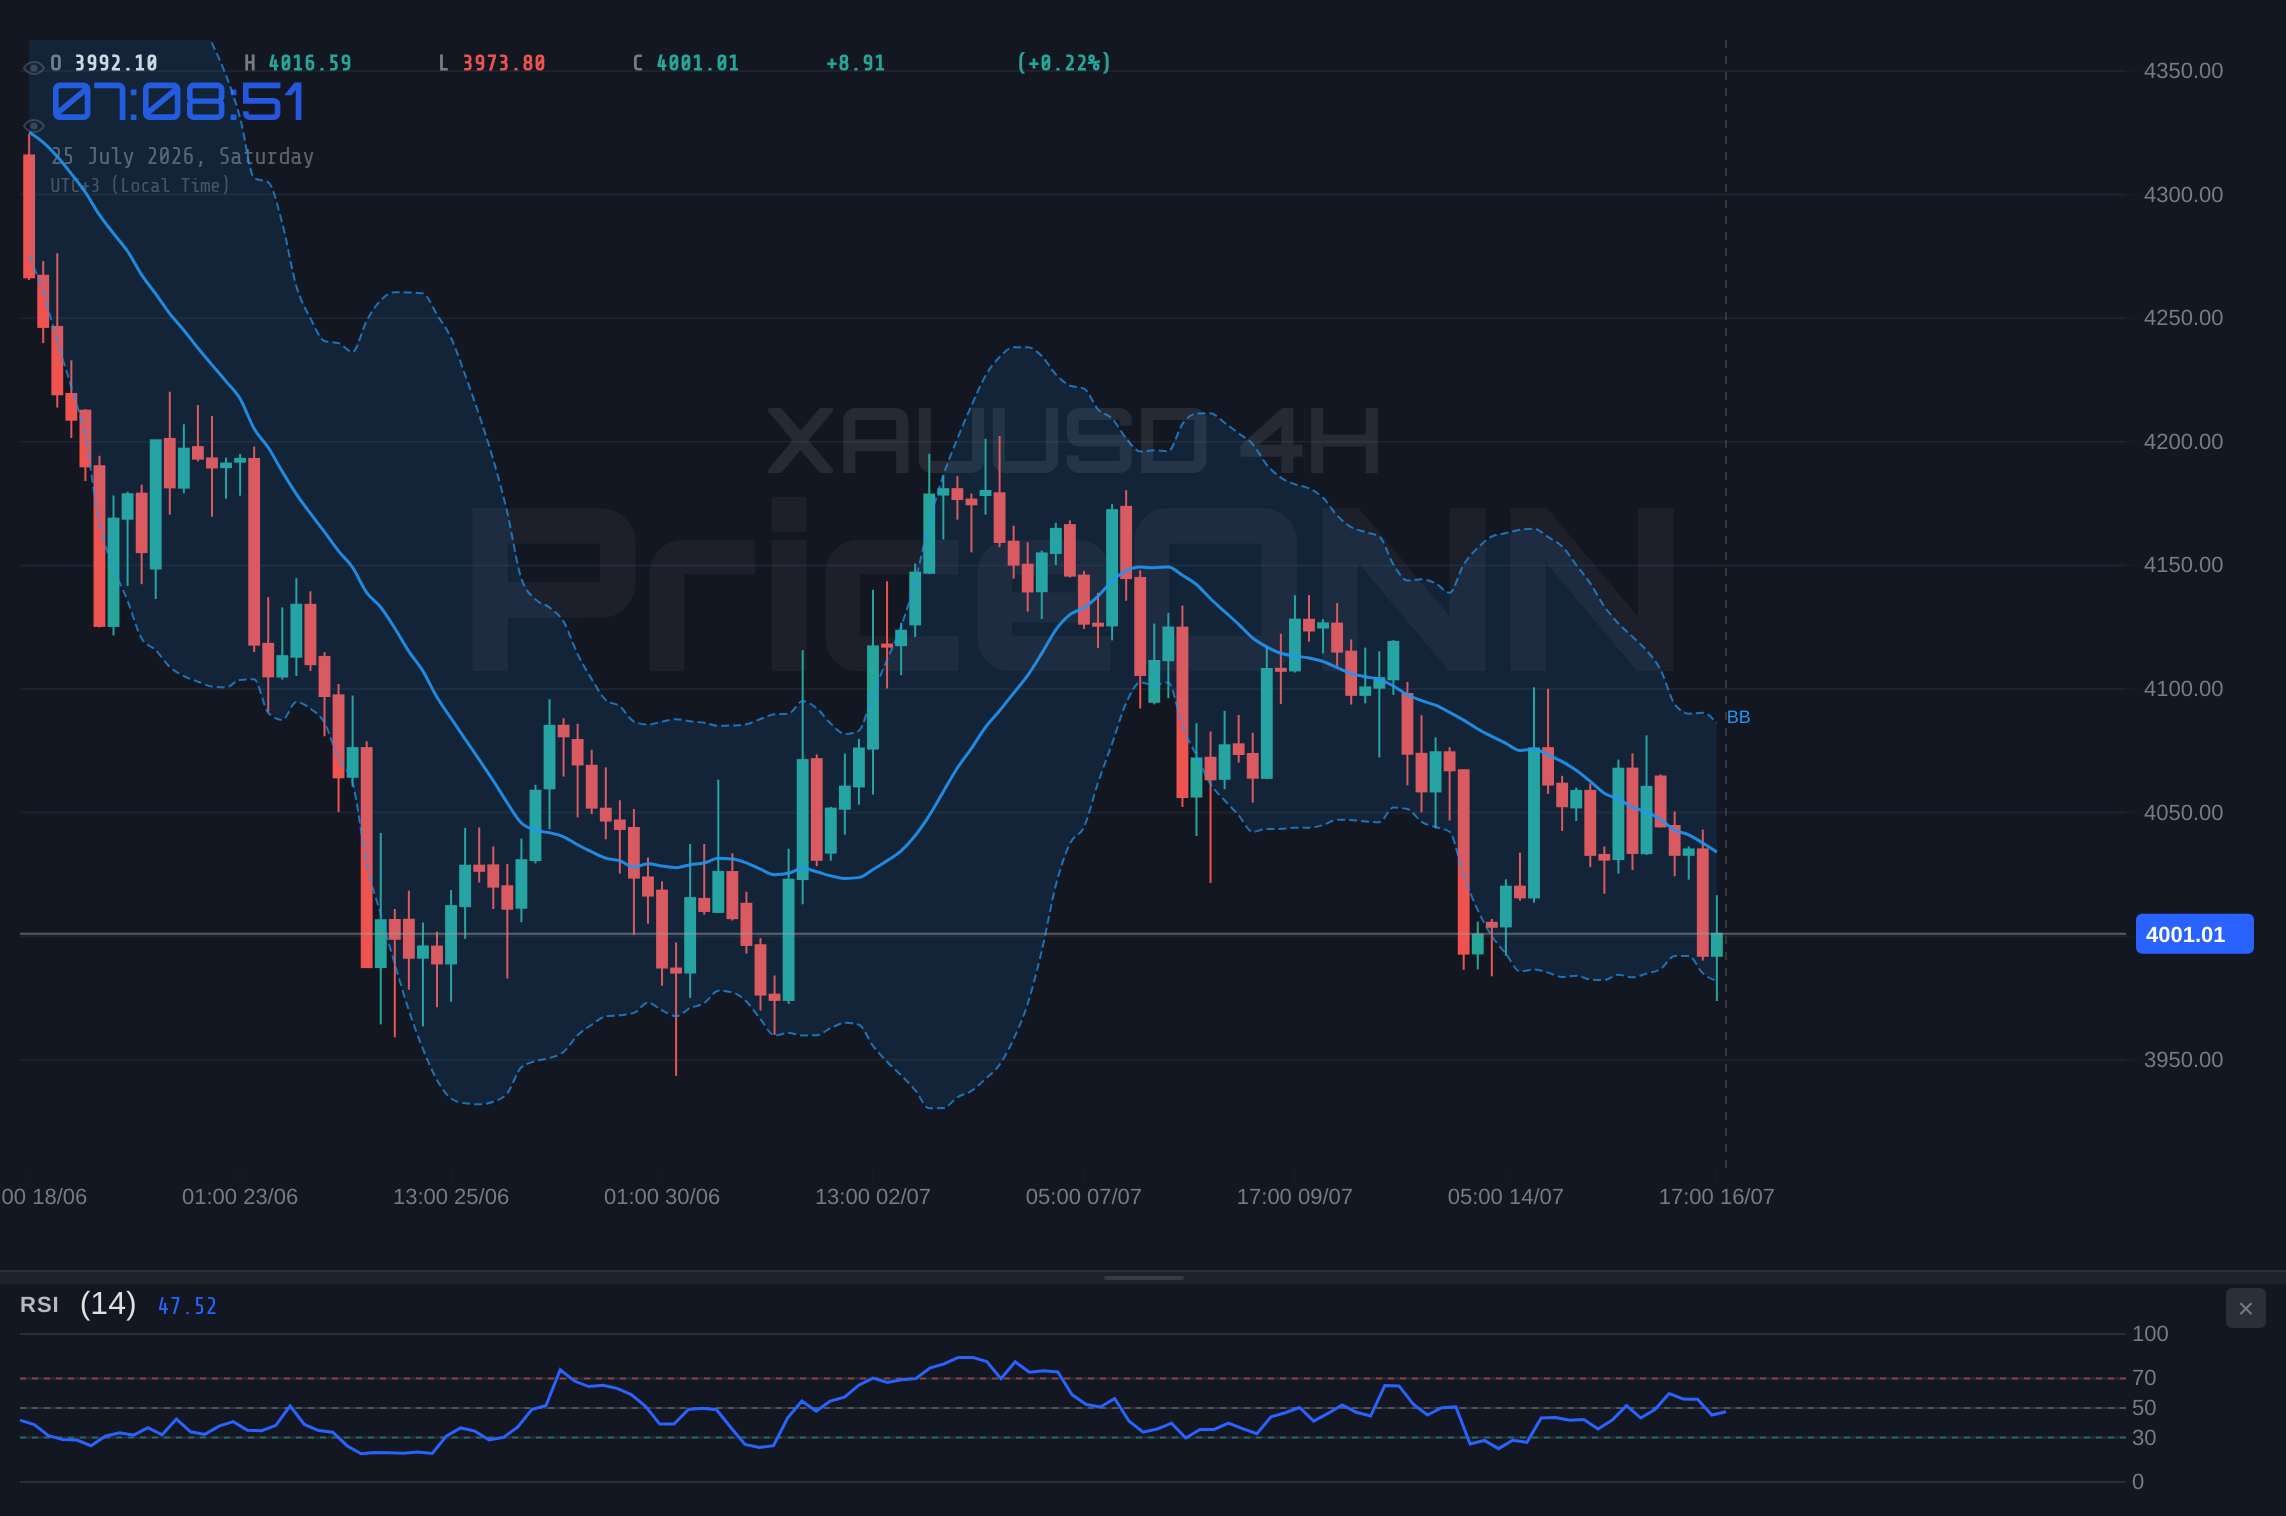
The 4-hour timeframe provides a more definitive bearish outlook. The trend is firmly in the bearish camp with a strength of 83%, supported by an RSI(14) reading of 40.59 and MACD momentum firmly in negative territory. The Stochastic, with K at 18.51 and D at 31.25, clearly signals a bearish trend, with %K below %D and pointing downwards. The ADX at 15.79, while indicating a weaker trend strength overall on this timeframe, still aligns with the prevailing downward pressure. The price is trading below the middle Bollinger Band, a classic bearish signal. The critical support level to watch here is $3,973.82. A decisive close below this level on the 4-hour chart would likely accelerate the downward move, targeting further lows. This is where the market’s resolve will be tested, and a failure to hold this zone could signal a significant shift.
On the daily chart, the bearish sentiment is solidified, albeit with some nuances. The trend is strongly bearish (95% strength), yet the MACD shows positive momentum with its histogram above the signal line, a slight contradiction. However, the RSI at 38.86 and Stochastic (K=26.18, D=44.73) both point towards further downside, with the Stochastic clearly in a bearish configuration. The ADX at 39.16 indicates a strong downtrend is in play, confirming the directional bias. The price is hugging the lower Bollinger Band, suggesting significant selling pressure. The key support on this daily timeframe is around $3,960.65. A break below this significant level could open the door to much lower prices, potentially retesting levels not seen in months. Conversely, any bounce would need to contend with immediate resistance at $4,019.21, a level that has acted as a pivot point in recent trading sessions. The overall 'SAT' signal across most indicators on this timeframe cannot be ignored, suggesting that sellers are in control.
What does this confluence of technical signals tell us? It suggests that while there might be short-term fluctuations or brief oversold bounces, the dominant trend is bearish. The ADX readings across the different timeframes, while varying in strength, generally point towards trending conditions, not choppy consolidation, on the higher timeframes (4H and 1D). The RSI consistently stays in the neutral-to-bearish territory, failing to reach overbought conditions that would signal a potential reversal. The Stochastic offers a mixed bag on the 1H, but aligns bearishly on the 4H and 1D. This divergence, particularly the slight bullish signal from the 1H Stochastic, could lead to a minor retracement before the downtrend potentially resumes. However, the overwhelming 'SAT' signals across the board, especially on the daily chart, indicate that the bears have the upper hand for now. The key is to watch how price behaves around the identified support levels; a break of these could trigger a more significant move.
Key Levels and Trade Scenarios: Charting the Path Forward
With gold trading at $4,001.21, the critical question for traders is where the market is headed next and what levels will define the trading range. Based on the provided data, the immediate technical picture suggests a bearish bias, but the market is currently in a WATCH_ZONE due to conflicting signals and moderate trend strength on shorter timeframes. The ADX readings, particularly the 15.79 on the 4H, indicate that while a downtrend is present, it lacks conviction, making aggressive trades risky. The RSI and MACD histogram, however, are aligned with a bearish sentiment, suggesting that sellers are still in control. The key level to watch for a confirmation of a more significant move - either a continuation of the downtrend or a potential bounce - is the support at $3,991.8 on the 1H timeframe.
A daily close below $3,991.8 would be a strong signal for further downside. This level has acted as a pivot, and a failure to hold it could open the door for a move towards the next significant support at $3,976.78. If sellers manage to push through this level, the psychological barrier of $3,950 would likely be tested, followed by the daily support at $3,960.65. The overall market sentiment, influenced by the DXY at 100.7 and concerns over persistent inflation, supports this bearish outlook. However, traders must remain vigilant for any potential oversold bounces, especially if the RSI dips significantly lower or if geopolitical events suddenly escalate, creating a flight to safety that momentarily overrides the inflation narrative.
Conversely, a bullish scenario would require XAUUSD to decisively break above immediate resistance. The first significant hurdle is the $4,019.21 level on the 1H chart. A sustained move above this point, ideally confirmed by increasing volume and a shift in momentum indicators, could signal a short-term reversal. This would need to be followed by a clear break of the $4,031.6 resistance. If gold can reclaim this level and hold it, the market might re-evaluate its bearish stance, potentially targeting higher levels. However, given the current bearish signals across multiple timeframes and the macroeconomic headwinds, such a scenario appears less probable in the immediate short term. The strength of the dollar and the inflation concerns are powerful counterforces that would need to be overcome for gold to mount a significant rally.
The neutral scenario, or consolidation, is also a distinct possibility given the mixed signals and the moderate trend strength indicated by the ADX on shorter timeframes. Price could oscillate between the $3,991.8 support and the $4,019.21 resistance for a period. This would likely occur if economic data releases are mixed or if geopolitical events remain tense but inconclusive. In such a scenario, traders would need to exercise patience, waiting for a clear breakout from this range. The higher ADX readings on the daily charts suggest that any consolidation might be temporary, and a directional move is likely to eventually emerge. The key is to not force trades during such periods but to wait for the market to provide a clearer signal and a more favorable risk-reward setup. The current WATCH_ZONE status reflects this uncertainty.
Bearish Scenario: Downside Momentum Continues
65% ProbabilityNeutral Scenario: Consolidation Around $4,000
25% ProbabilityBullish Scenario: Rebound from Support
10% ProbabilityCorrelation Analysis: DXY, Equities, and the Inflation Narrative
Understanding how XAUUSD interacts with other major market instruments is key to a comprehensive trading strategy. Currently, the correlation with the Dollar Index (DXY), which is trading around 100.7, is a dominant factor. As the DXY shows strength, gold tends to weaken, and vice versa. The recent uptick in the DXY, driven by renewed expectations of higher US interest rates due to persistent inflation concerns, has directly contributed to the pressure on gold prices. This inverse relationship is a cornerstone of gold market analysis, and its current manifestation reinforces the bearish technical signals observed.
The broader equity markets, represented by the SP500 (currently at 6572.87) and Nasdaq (at 29164.86), also play a crucial role. The SP500’s recent 0.74% gain and Nasdaq’s 1.16% drop highlight a divergence in risk appetite. While the Dow Jones Industrial Average (at 52748.53) showed a modest rise, the tech-heavy Nasdaq’s decline suggests a degree of risk aversion is creeping back into the market. Typically, a decline in equities, particularly tech stocks, can lead to increased demand for safe-haven assets like gold. However, this week, the inflation and Fed rate hike narrative has largely trumped traditional risk-off sentiment for gold. The fact that gold is selling off even as the Nasdaq shows weakness is a testament to the power of the current macro drivers. If this risk-off sentiment were to intensify significantly, and if the Fed were perceived to be easing its hawkish stance due to economic slowdown fears, gold could find a strong bid irrespective of dollar strength.
Oil prices, as mentioned, are a critical component of the inflation narrative. Brent crude near $83.79 and WTI around $79.59, both showing weekly declines but maintaining elevated levels, continue to fuel inflation concerns. This persistent upward pressure on energy costs has direct implications for central bank policy. If oil prices remain elevated or continue to climb, it will be increasingly difficult for central banks to bring inflation back to target without further tightening. This creates a challenging environment for gold, as higher rates generally increase the opportunity cost of holding non-yielding assets like gold. Therefore, while geopolitical tensions might offer some support, the persistent inflation threat linked to energy prices, and the resultant policy response, remains a significant headwind for XAUUSD. Any significant shift in oil prices, whether a sharp rise due to escalating conflicts or a fall due to demand destruction, will be closely monitored.
The correlation analysis underscores the complexity of the current gold market. It's not simply a case of geopolitical risk driving prices higher. The dominant theme appears to be the battle against inflation and the policy responses it necessitates. The strengthening dollar, fueled by hawkish Fed expectations, is currently the most potent force acting against gold. This means that upcoming economic data, particularly inflation figures and employment reports, will be scrutinized for any signs that might alter the Fed's projected path. Should inflation data surprise to the downside, or if economic growth shows significant cracks, the dollar could weaken, and gold might find renewed strength. Until then, the technical picture and the macro fundamentals appear aligned, suggesting a cautious approach is warranted.
Expert Insights and Trader Strategy
From a professional trader's perspective, the current XAUUSD environment around $4,001.21 presents a classic case of conflicting signals demanding a disciplined approach. The daily chart’s strong bearish trend (ADX 39.16) is undeniable, yet the 1H Stochastic is flashing a brief bullish signal. This suggests that while the larger trend favors sellers, short-term traders might find opportunities in minor bounces or pullbacks. However, the overall 'SAT' signal on the daily timeframe, coupled with the prevailing macro narrative of sticky inflation and potential further rate hikes, makes it difficult to advocate for aggressive long positions. The risk-reward for buying at these levels appears unfavorable without a clear confirmation of a trend reversal.
The primary strategy recommended for this market condition is to adopt a 'wait-and-watch' approach, focusing on the key support level at $3,991.8. A decisive break and hold below this level on a 1-hour or 4-hour chart would confirm the bearish bias and open up shorting opportunities, targeting $3,976.78 and potentially $3,960.65. The invalidation for such a short trade would be a sustained close back above $4,019.21. On the flip side, for those looking for bullish setups, confirmation would require a clear break and hold above the $4,019.21 resistance, followed by a push past $4,031.6. This would signal a potential shift in momentum, with targets towards $4,046.62 and higher. However, given the current macroeconomic pressures, such a bullish breakout would need significant catalysts, such as dovish signals from the Fed or a sudden escalation of geopolitical risks that overwhelms inflation concerns.
For longer-term investors, the current price action around $4,001.21 might represent a period of accumulation if they believe the inflation narrative will eventually subside and central banks will pivot towards easing. However, the technicals do not yet support such a strategy. The strong bearish trend on the daily chart suggests that further downside is probable before any sustainable bottom is formed. Patience will be key. Waiting for a clear technical bottoming pattern, such as higher lows and higher highs on the daily chart, or a confirmed break of significant resistance levels, would provide a more robust entry point for long-term positions. Until then, short-term trading strategies focused on the prevailing bearish trend, while managing risk diligently, appear more prudent.
Risk management remains paramount. The ADX readings, especially the lower ones on the 1H and 4H, indicate that the trend might not be fully established, leading to potential whipsaws. Therefore, stop-losses should be placed tightly, and position sizes should be adjusted according to the perceived risk. The market is currently in a WATCH_ZONE, and forcing trades here can lead to unnecessary losses. It’s better to wait for the market to provide a clearer setup that aligns with your trading strategy and risk tolerance. The interplay of macroeconomic factors and technical levels will continue to dictate price action, making vigilance and adaptability the most valuable assets for traders in the current environment.
Economic Calendar Watchlist: Key Data Ahead
The economic calendar for the upcoming week holds several crucial releases that could significantly impact gold prices. Following last week's focus on inflation data and central bank commentary, the market will be keenly watching for further clues on the path of monetary policy. The Federal Reserve's stance remains the dominant driver, and any new economic indicators that might sway their decisions will be closely scrutinized.
Key releases to monitor include upcoming employment data, which could provide insights into the strength of the US labor market and its potential impact on inflation. Stronger-than-expected employment figures might reinforce the hawkish Fed narrative, potentially leading to further dollar strength and pressure on gold. Conversely, weaker data could signal an economic slowdown, potentially prompting a reassessments of rate hike expectations and offering some relief to gold. Additionally, any further updates on oil prices and geopolitical developments in the Middle East will be critical. These factors have the potential to reignite safe-haven demand for gold, even in the face of a strong dollar.
Traders should pay close attention to any speeches or statements from Fed officials. Their commentary on inflation, economic growth, and the future path of interest rates can move markets significantly. The European Central Bank's recent decision to hold rates steady, while watching inflation spillovers, suggests a cautious approach. However, any signals of a potential shift in their policy outlook, perhaps driven by energy price shocks, could influence the EURUSD pair and, by extension, the DXY. The interplay between these major central banks and the prevailing inflation data will be the central theme for gold traders in the coming days. Expect volatility as the market digests this information and recalibrates its expectations.
Frequently Asked Questions: XAUUSD Analysis
What happens if XAUUSD breaks below the $3,991.8 support level?
A break and sustained close below $3,991.8 would likely trigger further selling pressure, confirming the bearish bias. This could lead to a test of the next support at $3,976.78, with a potential acceleration towards the $3,960.65 level if momentum continues.
Should I consider buying gold at current levels around $4,001.21 given the bearish trend?
Buying at current levels is not recommended given the prevailing bearish trend and macro headwinds. A more prudent approach would be to wait for a confirmed break of resistance at $4,019.21 or a clear technical bottoming pattern, indicating a higher probability setup with better risk-reward.
Is the RSI at 37.81 on the 1H chart a sell signal for XAUUSD?
An RSI of 37.81 on the 1H chart indicates that gold is in neutral territory but leaning towards oversold conditions, not a direct sell signal in itself. However, when combined with other bearish indicators like the MACD and the overall daily trend, it contributes to the bearish outlook, suggesting potential for further downside before any significant bounce.
How will the Fed's stance on inflation affect XAUUSD this week?
If the Fed maintains a hawkish stance due to persistent inflation, it will likely strengthen the dollar and increase the opportunity cost of holding gold, putting downward pressure on XAUUSD. Conversely, any signs of a Fed pivot or easing inflation could weaken the dollar and support gold prices.
Track markets in real-time
AI-powered analysis, technical indicators and real-time price data.
Join Our Telegram Channel
Breaking market news, AI analysis and trading signals instantly.
Join Channel