

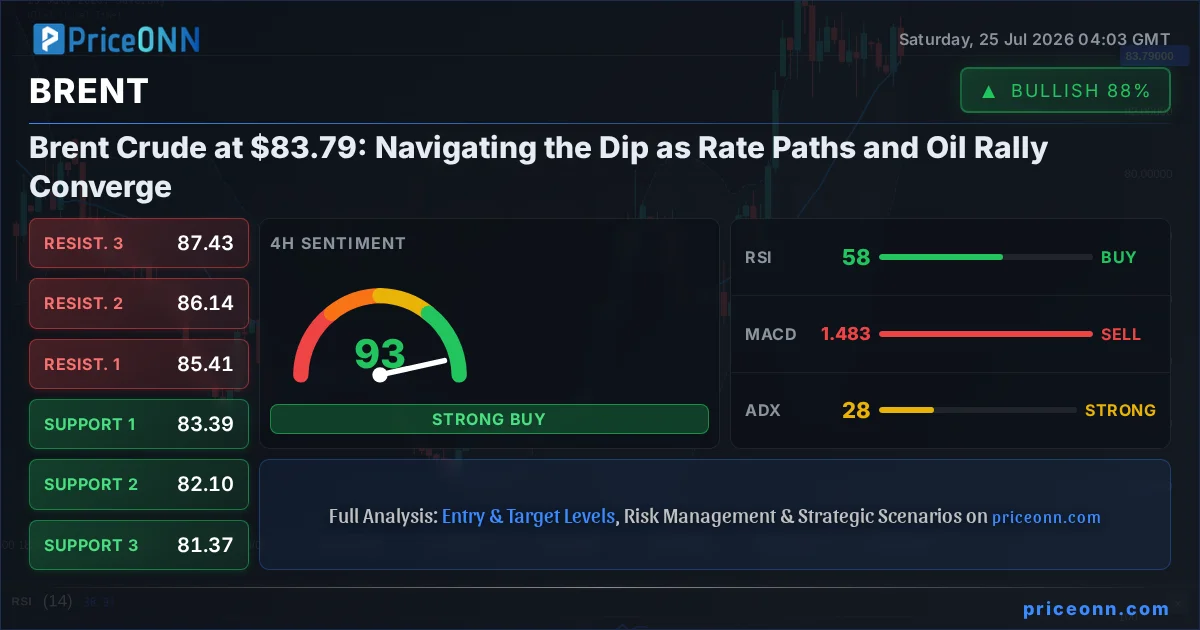
The energy markets are at a fascinating crossroads as Brent crude hovers around the $83.79 mark. This pivotal price point comes at a time when global economic indicators are sending mixed signals, with central bank policy paths and persistent geopolitical tensions vying for market attention. The recent dip in Brent's price, a notable retreat from its recent highs, warrants a deep dive into the underlying technicals and the broader macroeconomic forces at play. Understanding the interplay between inflation expectations, the strength of the US Dollar, and the evolving trajectory of interest rates is crucial for deciphering the short-to-medium term outlook for crude oil. As traders and investors digest the latest data, the question on everyone's mind is whether this pullback represents a healthy consolidation or the precursor to a more significant downturn. This analysis will dissect the current technical landscape, explore the fundamental drivers, and outline potential scenarios for Brent, providing a comprehensive view for various trading styles.
- Brent crude is trading at $83.79, showing a daily decline of -0.83% and a negative intraday direction.
- The RSI(14) is at 49.74 on the 1H chart, indicating a neutral-to-downward pressure in the short term, while the 1D RSI at 54.4 suggests a mild upward bias over the longer term.
- Key support for Brent is identified at $83.44, $83.18, and $82.85 on the 1H, with resistance seen at $84.03 and $84.36.
- The divergence in signals across different timeframes (1H, 4H, 1D) suggests a market in transition, with no clear trend yet firmly established.
- The DXY is at 100.7, showing strength which typically puts downward pressure on oil prices.
Navigating the $83.79 Level: A Critical Juncture for Brent Crude
The current price of Brent crude, standing precisely at $83.79, represents a significant level that has captured the market's attention. This price point is not just a number; it is a battleground where opposing forces of supply, demand, geopolitical risk, and macroeconomic policy converge. Over the past week, Brent has experienced a notable dip, shedding -0.83% ($0.70) from its recent trading range. This move down from the $85.03 high to the $82.83 low underscores the inherent volatility in the oil market and the sensitivity of crude prices to shifting global sentiment. Analyzing the intraday movements, the 1-hour chart shows a neutral trend with a power score of 50%, indicating indecision. However, the technical indicators paint a more nuanced picture: the RSI(14) at 49.74 suggests a slight downward lean, while the MACD shows positive momentum, albeit with the histogram below the signal line. This divergence is a classic sign of a market testing its resolve. The Stochastic oscillator's K and D lines (43.33 and 59.32 respectively) indicate a bearish signal, reinforcing the short-term downward pressure. The ADX, a measure of trend strength, sits at a low 11.13, suggesting a lack of strong directional conviction and potentially favoring range-bound trading in the immediate term. This complex interplay of indicators means that traders must look beyond simple buy or sell signals and consider the broader context.
The 4-hour timeframe offers a slightly different perspective, with a neutral trend (50% power) but a more bullish lean in some indicators. The RSI(14) is at 58.18, comfortably in the neutral zone and suggesting room for upward movement. The MACD, however, shows negative momentum with the histogram below the signal line, creating a conflict with the RSI. The Stochastic oscillator (K=53.04, D=47.99) provides a bullish signal, indicating that the %K line has crossed above the %D line, potentially signaling a shift. The ADX at 27.68 points to a strong uptrend, which seems to contradict the short-term bearish signals and the neutral trend classification. This discrepancy highlights the challenge in forming a definitive short-term outlook. The overarching signal on this timeframe is AL (Buy), with 7 Buy signals versus 1 Sell signal, suggesting that longer-term players might be more optimistic. This conflicting data across different intraday timeframes underscores the need for caution and a multi-faceted approach to trading Brent at these levels. The market is clearly not in a clear-cut trend, making risk management paramount.
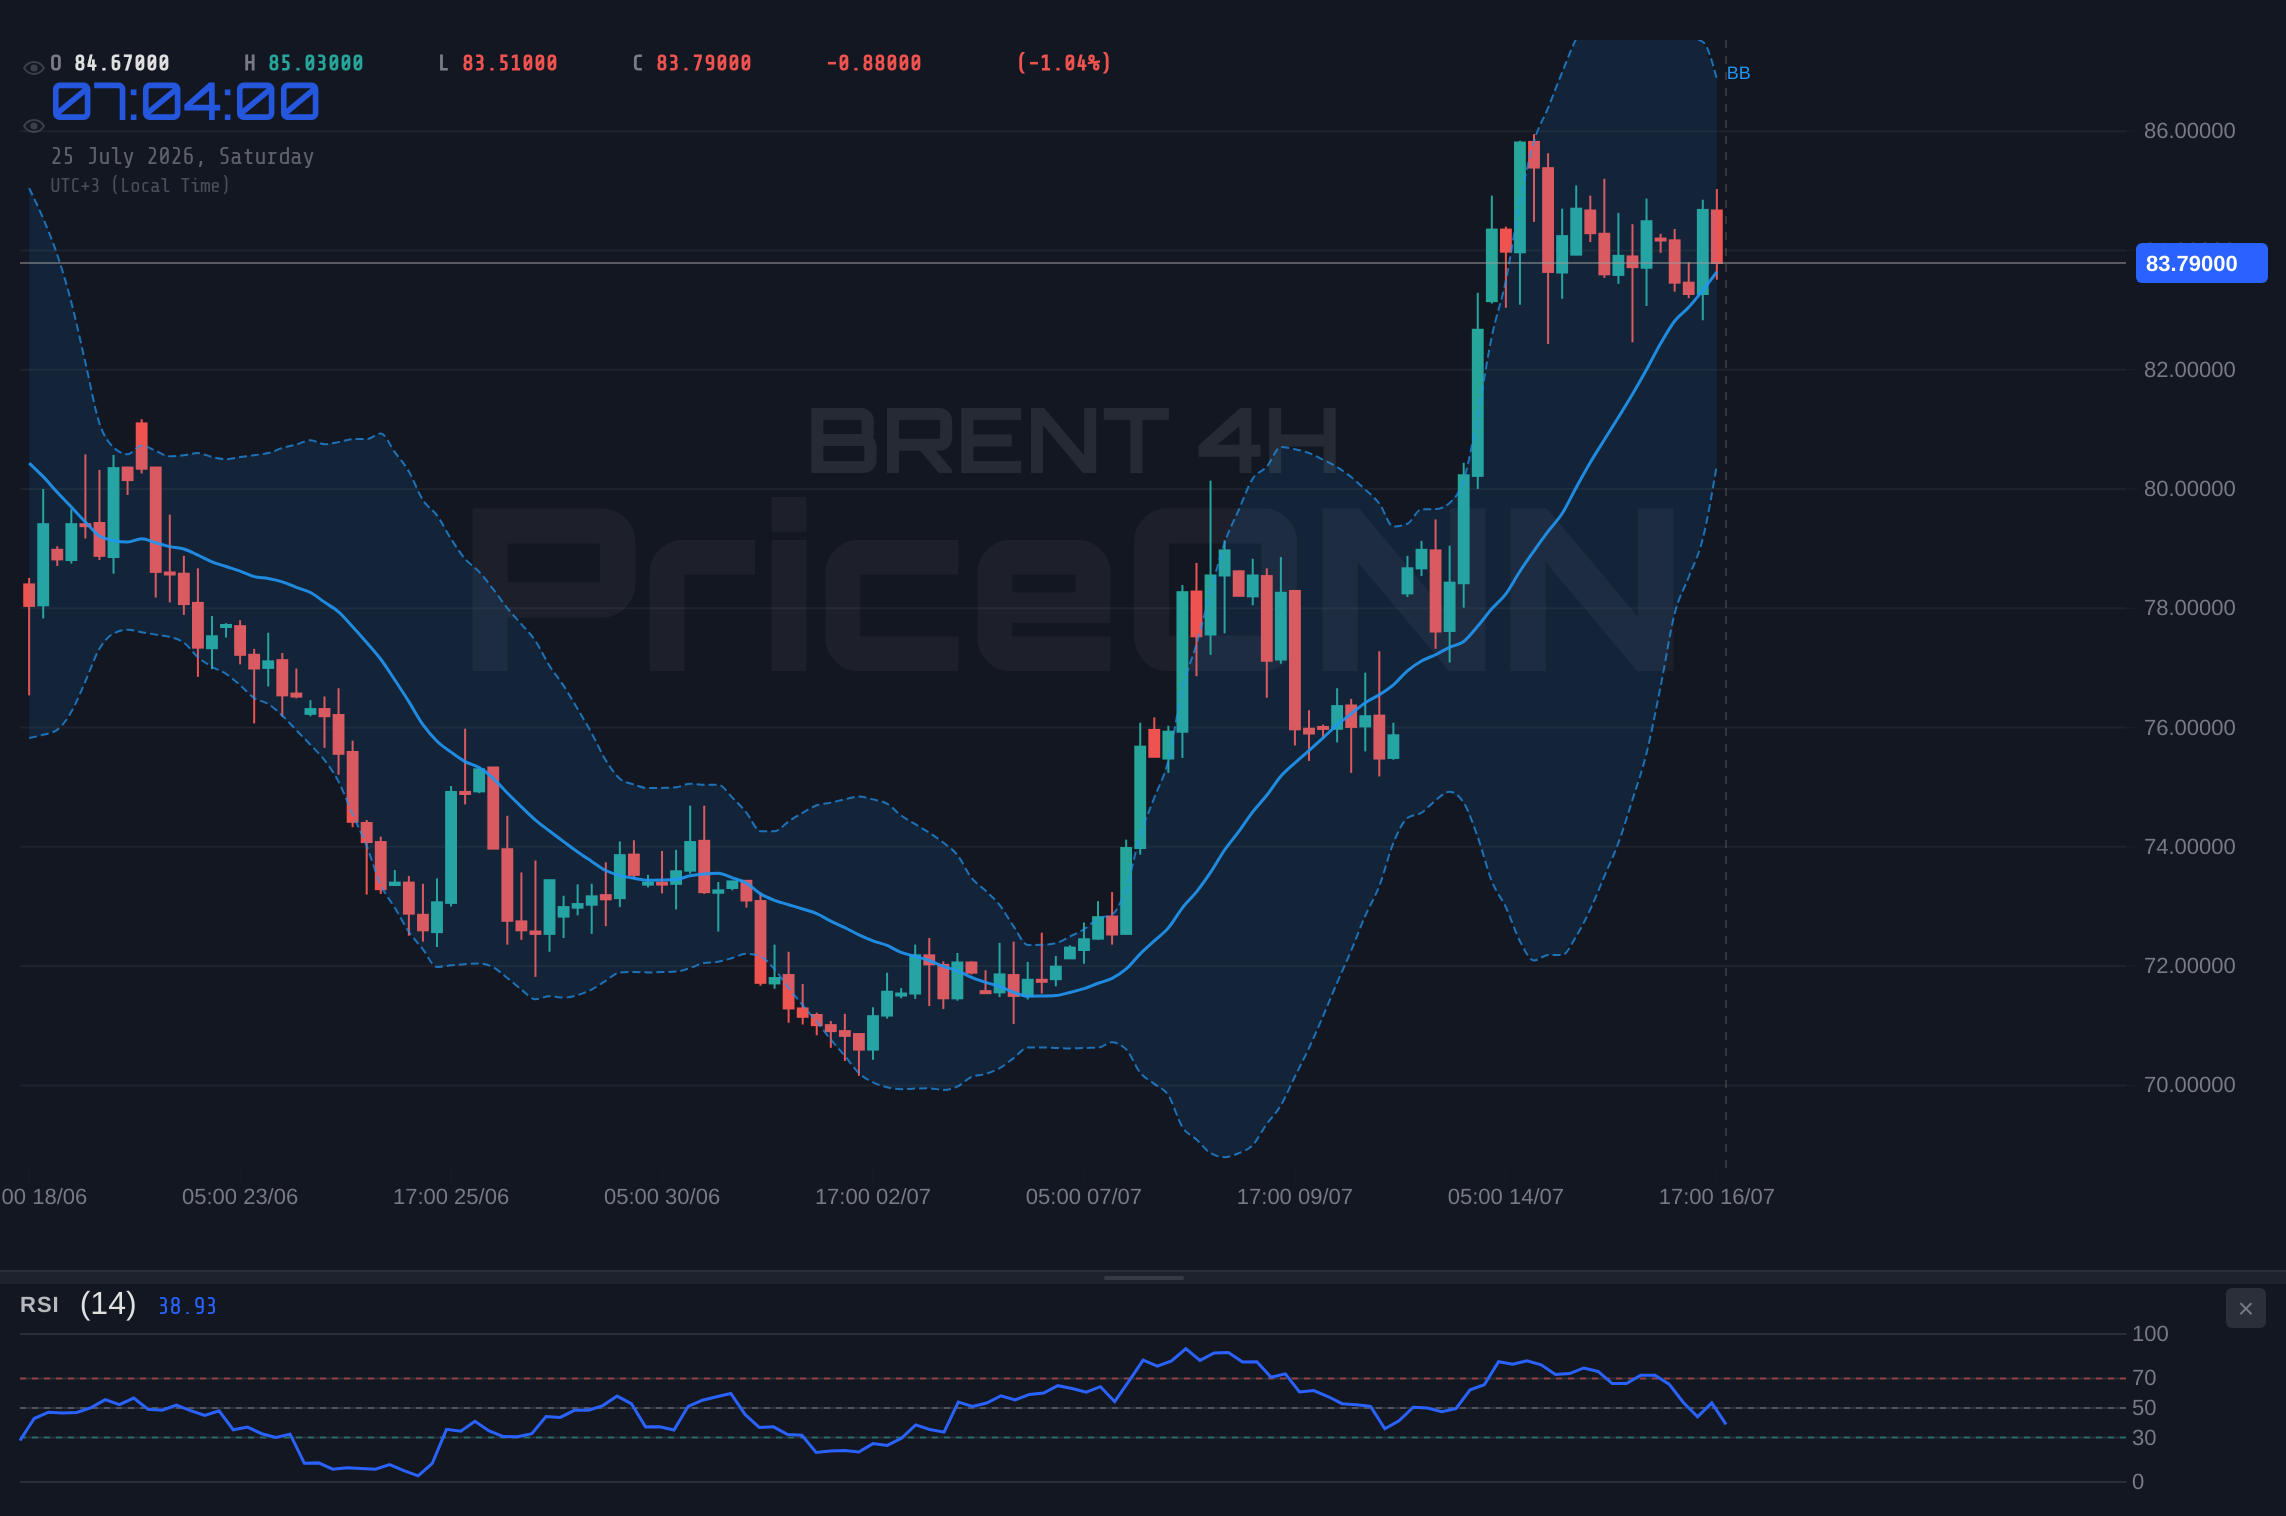
On the daily chart, the picture becomes even more intriguing. The trend is classified as neutral (50% power), but the overall sentiment leans towards a potential uptrend. The RSI(14) at 54.4 is in the upper neutral zone, indicating a mild bullish bias without being overbought. The MACD has positive momentum, with the histogram above the signal line, which is a bullish confirmation. The Stochastic oscillator, with K=88.3 and D=79.63, is firmly in overbought territory and flashing a strong bullish signal, suggesting that upward momentum could continue, though it also raises concerns about a potential reversal if it fails to sustain these levels. The ADX at 31.85 indicates a strong uptrend, reinforcing the bullish bias seen in the daily RSI and MACD. The aggregate signal on the daily timeframe is AL (Buy), with a dominant 7 Buy signals against only 1 Sell signal. This longer-term bullish leaning, contrasted with the mixed signals on shorter timeframes, suggests that while immediate price action might be choppy, the underlying sentiment for Brent crude remains cautiously optimistic. This conflict between short-term hesitation and long-term bullishness is a critical observation for any trader looking to position themselves in the oil market.
The Dollar's Shadow: DXY's Influence on Oil Prices
The trajectory of the US Dollar, as measured by the Dollar Index (DXY), plays an indispensable role in shaping the price of commodities like Brent crude. Currently, the DXY is trading at 100.7, showing a daily increase of 0.21%. This strengthening dollar acts as a headwind for oil prices, as dollar-denominated commodities become more expensive for holders of other currencies. When the dollar strengthens, the purchasing power of non-dollar holders decreases, potentially leading to reduced demand and, consequently, lower oil prices. The DXY's current level and upward movement on the 1-hour chart (RSI at 56.6, positive MACD momentum, and Stochastic in overbought territory) suggest continued dollar strength in the short term. This reinforces the bearish bias seen in some of Brent's shorter-term technical indicators. The ADX on the 1H DXY chart at 27.71 indicates a strong uptrend for the dollar, further amplifying the pressure on oil. However, the DXY's 4-hour chart presents a different narrative, with a neutral trend and a bearish RSI at 46.15, coupled with negative MACD momentum. This suggests that the dollar's strength might be consolidating or facing headwinds in the medium term. The daily DXY chart shows a neutral trend with a mixed bag of indicators, including a falling Stochastic and an ADX suggesting a strong uptrend, creating further complexity. This mixed picture for the dollar means that its impact on Brent could be variable, adding another layer of uncertainty to the oil market's outlook.
The correlation between the dollar and oil is not always a perfect inverse relationship. Factors like global risk sentiment, supply disruptions, and central bank policies can sometimes cause them to move in the same direction. For instance, during periods of extreme global uncertainty, both the dollar (as a safe-haven asset) and oil (due to supply disruption fears) can rise simultaneously. However, in the current environment, with the Fed signaling a potentially hawkish stance and the ongoing Middle East tensions fueling oil supply concerns, the inverse correlation is more likely to dominate. The recent news highlighting that 'Dollar and Yield Surge as Brent Near $100 Sparks Broader Market Repricing' and 'The Brent crude rally is a bigger ‘bearish’ factor for EURUSD than the ECB' underscores this dynamic. As the dollar strengthens towards 100.7, the immediate pressure on Brent is palpable, especially on shorter timeframes. This highlights the importance for traders to monitor DXY movements closely. A sustained rise in the dollar above 100.75 could signal further downside for Brent, while a reversal below 100.50 might offer some respite to oil bulls. The interplay is dynamic and requires constant observation.
The Inflationary Pulse: Oil's Role in the Macroeconomic Landscape
The persistent strength in oil prices, even with the recent dip, remains a significant factor in the global inflation narrative. Brent crude, trading at $83.79, is a key component influencing inflation expectations and, consequently, central bank policy. Reports like 'Brent Tops $100 as Houthi Attacks Push Oil Rally Into Triple Digits' and 'Red Sea Attacks Push Brent Oil Toward $100. Will Markets Finally React?' from PriceONN's market news indicate the underlying sensitivity of oil prices to geopolitical events. These supply-side shocks can directly translate into higher energy costs for consumers and businesses, feeding into broader inflation metrics. The European Central Bank (ECB), for instance, is closely watching these energy shocks. As noted in 'EUR/CHF Rally Points to Hawkish ECB Hold as Oil Reignites Inflation Risks' and 'ECB Holds Rates, Closely Watches Energy Shock and Inflation Spillovers', the ECB has kept rates unchanged while acknowledging the inflationary pressures stemming from energy prices. This situation creates a delicate balancing act for policymakers: fighting inflation may require higher interest rates, but higher rates can also dampen economic growth and, paradoxically, reduce oil demand.
The Federal Reserve is in a similar predicament. While the latest data might suggest a cooling of inflation in some sectors, the elevated price of oil introduces a significant upside risk. The 'Week Ahead – Fed, BoE and BoJ Face Inflation Test as Markets Reprice Interest Rate Paths' report highlights that the Fed's decision-making is heavily influenced by these inflation dynamics. If oil prices remain elevated or resume their upward trajectory, it could force the Fed to maintain a hawkish stance for longer, potentially leading to more interest rate hikes or delaying anticipated cuts. This, in turn, strengthens the dollar, creating the inverse pressure on oil prices we've discussed. The market is pricing in these possibilities, as indicated by the volatility in Treasury yields. A sustained high oil price environment could therefore lead to a prolonged period of higher interest rates globally, impacting everything from corporate borrowing costs to consumer spending and, ultimately, the demand for energy itself. This complex feedback loop is a critical consideration for anyone analyzing Brent crude's future price movements.
Technical Breakdown: Chart Patterns and Indicator Signals for Brent
Delving into the technicals, Brent crude's chart presents a mosaic of signals across different timeframes. On the 1-hour chart, the trend is neutral, with an RSI of 49.74 and a MACD showing negative momentum below its signal line. The Stochastic oscillator, however, offers a bullish crossover (K=43.33 > D=37.27), creating a conflict. The ADX at 11.13 signals a weak trend, suggesting that any short-term moves might lack conviction. The overall signal leans towards 'SAT' (Sell), with 7 sell signals against 1 buy. This suggests immediate caution for intraday traders. The support levels at $83.44, $83.18, and $82.85 are critical for holding any short-term bullish sentiment, while resistance at $84.03 and $84.36 needs to be breached for a bullish continuation.
The 4-hour timeframe offers a slightly more optimistic view, despite a neutral trend classification. The RSI at 58.18 is in a healthy neutral zone, and the Stochastic provides a bullish signal (K=53.04 > D=47.99). While the MACD shows negative momentum, the ADX at 27.68 indicates a strong uptrend. This timeframe's aggregate signal is AL (Buy), with a strong 7:1 ratio. Support here is seen at $83.39 and $82.10, with resistance at $85.41 and $86.14. The confluence of a rising RSI and Stochastic, alongside a strong ADX, suggests that if the price can consolidate above the $83.79 level and push through immediate resistance, further upside could materialize. This timeframe is often crucial for swing traders looking for positions held over a few days.
The daily chart paints the most bullish picture. The trend is neutral but with a clear upward bias. The RSI at 54.4 is constructive, the MACD shows positive momentum, and the Stochastic oscillator is strongly bullish at K=88.3, D=79.63, albeit in overbought territory. The ADX at 31.85 confirms a strong uptrend. The daily signal is AL (Buy), with a dominant 7:1 ratio. The key support levels on the daily chart are $82.90, $81.31, and $80.16. Resistance is marked at $85.64, $86.79, and $88.38. This longer-term bullish outlook suggests that dips might be opportunities for accumulation, provided key support levels hold. The overbought Stochastic on the daily chart is a point of caution, indicating that a period of consolidation or a minor pullback before further gains is possible. The discrepancy between the short-term bearish signals and the long-term bullish conviction is the central technical theme right now.
The Bears' Grip: Downside Risks Under $83.79
60% ProbabilityThe Bulls' Charge: Upside Potential Above $84.00
30% ProbabilityThe Waiting Game: Consolidation Around $83.79
10% ProbabilityFundamental Drivers: What's Moving the Price?
The recent price action in Brent crude is intrinsically linked to a complex web of fundamental factors, most notably the ongoing geopolitical tensions and the shifting expectations surrounding central bank monetary policy. The PriceONN market news clearly indicates the impact of events like 'Brent Tops $100 as Houthi Attacks Push Oil Rally Into Triple Digits' and 'Red Sea Attacks Push Brent Oil Toward $100'. These supply-side disruptions, particularly in crucial shipping lanes, create a risk premium in oil prices. Even if actual supply is not immediately curtailed, the *fear* of disruption is enough to support prices. This was evident when Brent briefly broke $90 following 'Fresh Iran War Escalation'. These events directly influence the sentiment on the charts, often leading to sharp price movements that technical indicators then try to interpret. The market's reaction to these headlines, as seen in the volatility around $83.79, highlights the sensitive balance between supply fears and demand outlook.
On the demand side, the global economic outlook remains a key determinant. While growth in some regions might be showing resilience, concerns about inflation and the potential for higher interest rates worldwide continue to cast a shadow. The 'Week Ahead – Fed, BoE and BoJ Face Inflation Test as Markets Reprice Interest Rate Paths' report is critical here. If major central banks, particularly the Federal Reserve, signal a more hawkish stance due to persistent inflation (partly fueled by oil prices), it could dampen global economic activity. This would translate into lower expected oil demand, acting as a counterforce to the supply-driven price support. The current DXY strength at 100.7, driven by these rate expectations, further complicates the picture by making oil more expensive for a significant portion of the global market. Traders are thus caught between the fear of supply shortages and the concern of demand destruction due to tightening monetary conditions. This duality is why we see mixed signals on the charts and why price levels like $83.79 become critical battlegrounds.
Correlation Analysis: Brent in the Wider Market Context
To gain a holistic view of Brent crude's potential direction, it's essential to examine its correlation with other major financial assets. The Dollar Index (DXY) is currently at 100.7, exhibiting strength that typically exerts downward pressure on oil prices. A stronger dollar makes oil more expensive for international buyers, potentially dampening demand. This inverse relationship is a cornerstone of commodity trading analysis. As the DXY moves higher, we often see Brent prices struggle to gain traction, and vice-versa. The current upward move in DXY, supported by hawkish Fed expectations, is a significant headwind for oil.
Equities, represented by the SP500 and Nasdaq, offer insights into global risk appetite. The SP500 is trading at 6572.87, showing a daily gain of 0.74%, while the Nasdaq is at 29164.86, down 1.16%. This divergence is notable. The Nasdaq's decline suggests increased caution in the tech-heavy sector, potentially indicating a broader risk-off sentiment. Conversely, the SP500's rise shows some resilience in broader market indices. Generally, a declining SP500 or Nasdaq can correlate with lower oil prices as it signals economic slowdown fears. However, the current mixed equity performance adds complexity. If the Nasdaq's weakness spreads, it could weigh on Brent. The fact that Brent prices have been rising recently while equities faced pressure, as hinted in the news 'Dollar and Yield Surge as Brent Near $100 Sparks Broader Market Repricing', suggests that oil is currently being driven more by supply-side concerns than by overall economic optimism.
Treasury yields are also a critical component. While specific yield data isn't provided, rising yields generally correlate with tighter financial conditions and can signal inflation expectations, which in turn can support oil prices. However, sharply rising yields can also signal economic contraction fears or aggressive Fed tightening, which would dampen oil demand. The interplay is nuanced. The current environment, where yields might be rising due to inflation fears and Fed hawkishness, creates a tug-of-war: higher yields might support oil due to inflation, but they also strengthen the dollar and can signal slower growth, which is bearish for oil. This complex correlation matrix means that Brent's price is influenced by a combination of factors, and isolating one driver is rarely sufficient for accurate forecasting.
Trading Strategies: What Different Market Participants Should Watch
The current market environment for Brent crude, characterized by its $83.79 price point, mixed technical signals, and competing fundamental drivers, requires tailored approaches for different trading styles. For scalpers, the focus is on exploiting short-term volatility and minor price swings, often within the 1-hour timeframe. Key levels to watch would be the immediate intraday support at $83.44 and resistance at $84.03. A successful breach of $84.03, confirmed by increased volume, could offer a quick scalp towards $84.36. Conversely, a break below $83.44 might present a shorting opportunity towards $83.18. Scalpers need to be extremely nimble, managing risk tightly with very small stop-losses, as the lack of a clear trend on the 1H chart can lead to whipsaws.
Swing traders, who typically hold positions for a few days to a couple of weeks, would pay close attention to the 4-hour and daily charts. The 4-hour chart's neutral trend with a bullish lean (AL signal, ADX at 27.68) and support at $83.39 suggests that dips towards this level could be buying opportunities for a move towards the $85.41 resistance. The daily chart's bullish bias, with support at $82.90 and $81.31, provides a longer-term perspective. Swing traders might look for confirmation signals, such as a higher low formation on the 4H chart or a daily close above $84.03, to enter a long position targeting $85.03 or even higher. Conversely, a decisive break below $82.85 on the daily chart would invalidate the bullish thesis and signal a potential move lower.
Long-term investors, focusing on monthly or quarterly trends, would be more concerned with the fundamental drivers and the daily chart's overall picture. The daily chart's neutral-but-leaning-bullish trend, coupled with the persistent geopolitical risks that could support supply-side disruptions, might suggest a long-term accumulation strategy on dips towards key support levels like $81.31 or $80.16. They would be watching for sustained breaks above the $85.64 resistance level as a sign of a more significant bullish trend confirmation. For long-term investors, the narrative around energy transition, OPEC+ production policies, and sustained global demand growth will be more critical than short-term technical fluctuations around $83.79. The current market structure, with its conflicting signals, suggests that patience is a virtue, and waiting for clearer confirmation or more compelling fundamental catalysts might be the most prudent strategy.
Historical Context: Lessons from Past Brent Price Swings
Examining historical price action provides valuable context for understanding Brent crude's current predicament around $83.79. We've seen periods where similar levels of uncertainty, driven by geopolitical events and shifting economic outlooks, have led to significant price volatility. For instance, during periods of heightened Middle East tensions, such as the events referenced in PriceONN's news ('Brent Tops $100 as Houthi Attacks Push Oil Rally Into Triple Digits' and 'Red Sea Attacks Push Brent Oil Toward $100'), Brent has historically reacted sharply to supply disruption fears. During the 2022 energy crisis, crude prices surged dramatically, driven by supply fears stemming from the conflict in Ukraine. At that time, technical indicators often showed strong bullish momentum, with RSI soaring into overbought territory and MACD crossovers signaling sustained upward trends. However, such rallies were often followed by periods of sharp correction as demand concerns and potential supply destructions from high prices came into play.
Conversely, periods of economic slowdown or fears of recession have historically led to significant oil price downturns. The COVID-19 pandemic in early 2020 saw oil prices plummet as global demand evaporated overnight. During such times, technical indicators often reflected extreme bearishness, with RSI falling deep into oversold territory and MACD histograms showing intense negative momentum. Support levels were frequently broken, leading to cascading sell-offs. The current situation, with Brent at $83.79, shows a blend of these forces: supply-side risks are present, providing a floor, but demand-side concerns, amplified by potential interest rate hikes and a slowing global economy, are capping upside potential. The mixed technical signals we observe today mirror historical periods where the market was grappling with these opposing fundamental narratives. The ADX readings, fluctuating between weak and strong trends across different timeframes, are indicative of such transitional phases where the market is seeking a clear direction.
The current neutral trend on the daily chart, despite a strong ADX, suggests that we are in a phase where previous trends are losing momentum, and the market is consolidating before the next major move. This pattern has often preceded significant shifts in oil prices. For example, periods of sideways consolidation in Brent have historically given way to sharp breakouts, either to the upside driven by unexpected supply shocks or to the downside triggered by economic downturns or resolution of geopolitical tensions. The fact that the RSI is hovering in the mid-50s on the daily chart and the Stochastic is in overbought territory but showing a bullish signal, indicates that while there's upward pressure, the market is not yet in a full-blown bull run, nor is it signalling an imminent crash. This nuanced technical picture, combined with the current fundamental crosscurrents, suggests that the $83.79 level is a critical pivot point, and the resolution of these conflicting forces will dictate the next major trend.
The Road Ahead: Key Events and Levels to Watch
Looking towards the coming week, several key events and technical levels will be crucial for determining the direction of Brent crude. From a fundamental perspective, the upcoming central bank meetings and inflation data releases are paramount. The 'Week Ahead – Fed, BoE and BoJ Face Inflation Test' report highlights the focus on interest rate paths. Any hawkish surprises from the Fed, Bank of England, or Bank of Japan could strengthen the dollar further, putting additional downward pressure on oil. Conversely, signals of a potential pivot towards easing could weaken the dollar and provide support for Brent. Investors will be closely monitoring any commentary regarding the impact of oil prices on inflation targets and economic growth forecasts. Furthermore, any escalation or de-escalation of geopolitical tensions in the Middle East or related to major oil-producing nations could trigger significant price swings, overriding other fundamental factors in the short term.
Technically, the $83.79 price level remains the immediate focal point. For a bullish continuation, breaking and holding above the 1-hour resistance at $84.03 is essential. If this level is cleared, the next targets would be $84.36 and potentially the recent high of $85.03. Confirmation would ideally come from a rising RSI above 55 and sustained positive MACD momentum on the 1H chart. On the downside, failure to hold the current price could see a move towards the 1-hour support at $83.44. A decisive break below this level, especially if accompanied by dollar strength and negative news flow, could open the door for a test of the $83.18 and $82.85 support zones. The neutral scenario suggests a period of consolidation between $83.44 and $84.03, which might offer range-bound trading opportunities but requires careful risk management due to the potential for sharp breakouts.
The longer-term outlook hinges on the daily chart's key levels. A sustained move above the daily resistance of $85.64 would signal a more robust bullish trend, potentially targeting $86.79 and $88.38. Conversely, a breakdown below the daily support at $82.90 would invalidate the constructive daily outlook and suggest a move towards $81.31 and $80.16. Traders should also keep an eye on the correlation with the DXY and equity markets. A continued rise in the DXY above 100.75 might cap any rallies in Brent, while a significant drop in the SP500 or Nasdaq could signal broader risk aversion, impacting oil demand. The strength of the trend, as indicated by the ADX, will be crucial; a sustained ADX above 30 across multiple timeframes would suggest a directional move is likely to gain momentum, while low ADX values reinforce the possibility of choppy, range-bound trading.
Frequently Asked Questions: Brent Crude Analysis
What happens if Brent crude breaks below the $83.44 support level?
If Brent crude closes below the $83.44 intraday support level, especially with dollar strength above 100.75, it could trigger a bearish scenario. The immediate target would be the $83.18 support, followed by $82.85, testing recent lows and potentially liquidity.
Should I buy Brent at $83.79 if the RSI is at 54.4 and MACD shows positive momentum?
Buying at $83.79 with a daily RSI of 54.4 and positive MACD momentum on the daily chart could be considered a cautiously optimistic move, especially for longer-term trades. However, confirmation is needed; look for a break above $84.03 resistance with increasing volume, and be prepared to invalidate the trade if price falls below $83.44 support.
Is the current ADX reading of 27.68 on the 4H chart a strong uptrend signal for Brent?
An ADX reading of 27.68 on the 4-hour chart indicates a strong uptrend. This suggests that if bullish conditions prevail, the price movement could be sustained. However, it's important to consider this alongside other indicators; while the ADX confirms trend strength, it doesn't indicate direction, so other signals like RSI and MACD should also be evaluated.
How will the Fed's upcoming interest rate decision affect Brent crude price around $83.79?
A hawkish Fed decision, signaling potential further rate hikes or a delayed easing, would likely strengthen the US Dollar (DXY above 100.75), putting downward pressure on Brent crude around $83.79. Conversely, a dovish surprise could weaken the dollar, potentially supporting oil prices and allowing Brent to target resistance levels like $84.03 and $85.03.
Technical Outlook Summary
| Indicator | Value | Signal | Interpretation |
|---|---|---|---|
| RSI (14) | 54.40 | Neutral | Mild bullish bias, room to move higher. |
| MACD | Positive Momentum | Bullish | Histogram above signal line on Daily, but mixed on 1H/4H. |
| Stochastic | K:88.30, D:79.63 | Bullish | Overbought on Daily, signals potential upside continuation or reversal. |
| ADX | 31.85 | Strong Trend | Confirms a strong uptrend on the Daily chart. |
| Bollinger Bands | Middle Band Breakout | Bullish | Price above middle band on Daily, suggesting upward momentum. |
Key Levels
Support Levels
Resistance Levels
Track markets in real-time
AI-powered analysis, technical indicators and real-time price data.
Join Our Telegram Channel
Breaking market news, AI analysis and trading signals instantly.
Join Channel