

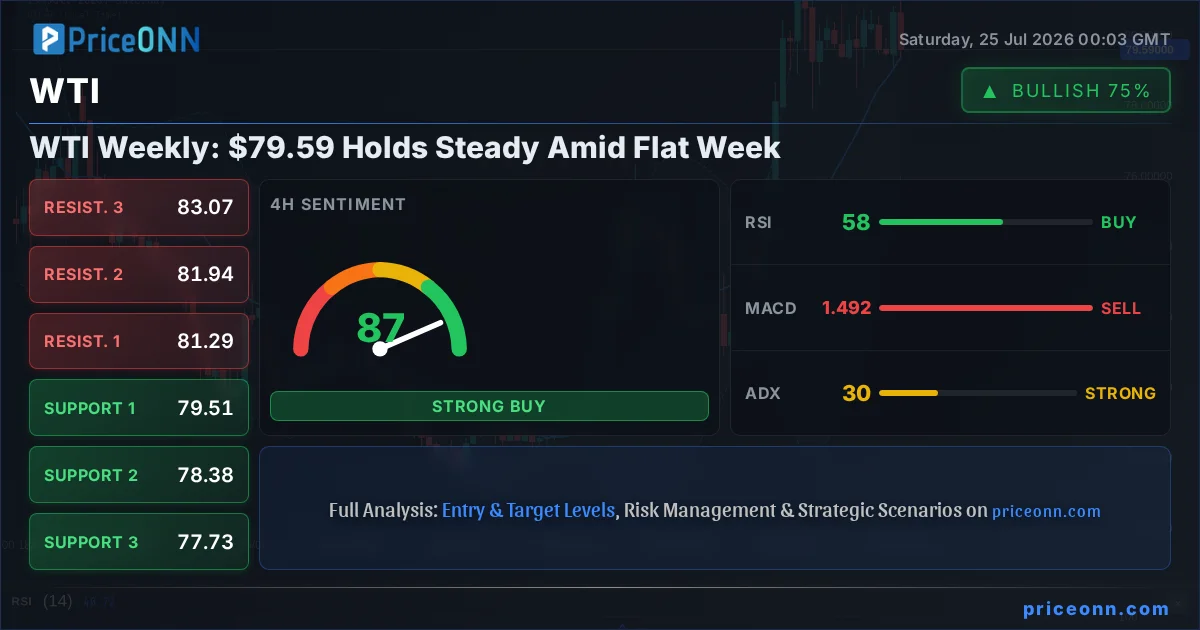
The past trading week for WTI crude oil concluded with a period of notable consolidation, leaving prices anchored around the $79.59 mark. This flatness, however, belies a market holding its breath, caught between persistent geopolitical tensions that underpin crude's value and a broader macroeconomic landscape still navigating inflation concerns and central bank policy shifts. While the headline price action might suggest a lack of direction, a deeper dive into the technical indicators and the correlation with global indices reveals a market poised at a critical juncture. Understanding the interplay between the immediate technical picture and the overarching fundamental drivers is key to deciphering WTI's potential path forward in the coming trading sessions.
- WTI crude oil closed the week hovering around $79.59, indicating a period of consolidation.
- The ADX at 10.18 on the 1H chart signals a weak trend, suggesting a lack of strong directional conviction.
- Support at $79.23 and resistance at $79.83 are the critical levels to watch for a potential breakout.
- Geopolitical risks in the Middle East continue to provide a floor for oil prices, while inflation data remains a key focus for central banks.
The initial trading days of the week saw WTI crude oil experience some minor fluctuations, but ultimately, the market settled into a tight range. The most significant price action occurred early in the week, with a brief push towards the $81.00 level, only to be met with selling pressure that pushed prices back down towards the $79.00 handle. This lack of decisive movement across the trading week means that key technical levels remain intact, setting the stage for a potentially volatile breakout in the sessions ahead. Traders are closely monitoring the $79.23 support and $79.83 resistance levels, as a clear breach of either is expected to dictate the short-term trajectory of the commodity.
From a technical standpoint, the 1-hour chart paints a picture of indecision. The ADX reading of 10.18 is particularly telling, indicating a very weak trend, which aligns with the flat price action observed. This suggests that neither buyers nor sellers have established firm control, leading to the consolidation observed. The RSI(14) at 46.91 is in neutral territory, offering no strong signal of overbought or oversold conditions, further reinforcing the neutral stance. However, the MACD is showing negative momentum, with the MACD line below the signal line, hinting at potential downward pressure, even if the overall trend strength is minimal. The Stochastic oscillator, with K at 28.74 and D at 52.74, is signaling a potential move lower, indicating that the market might be leaning towards a bearish outcome if current conditions persist.
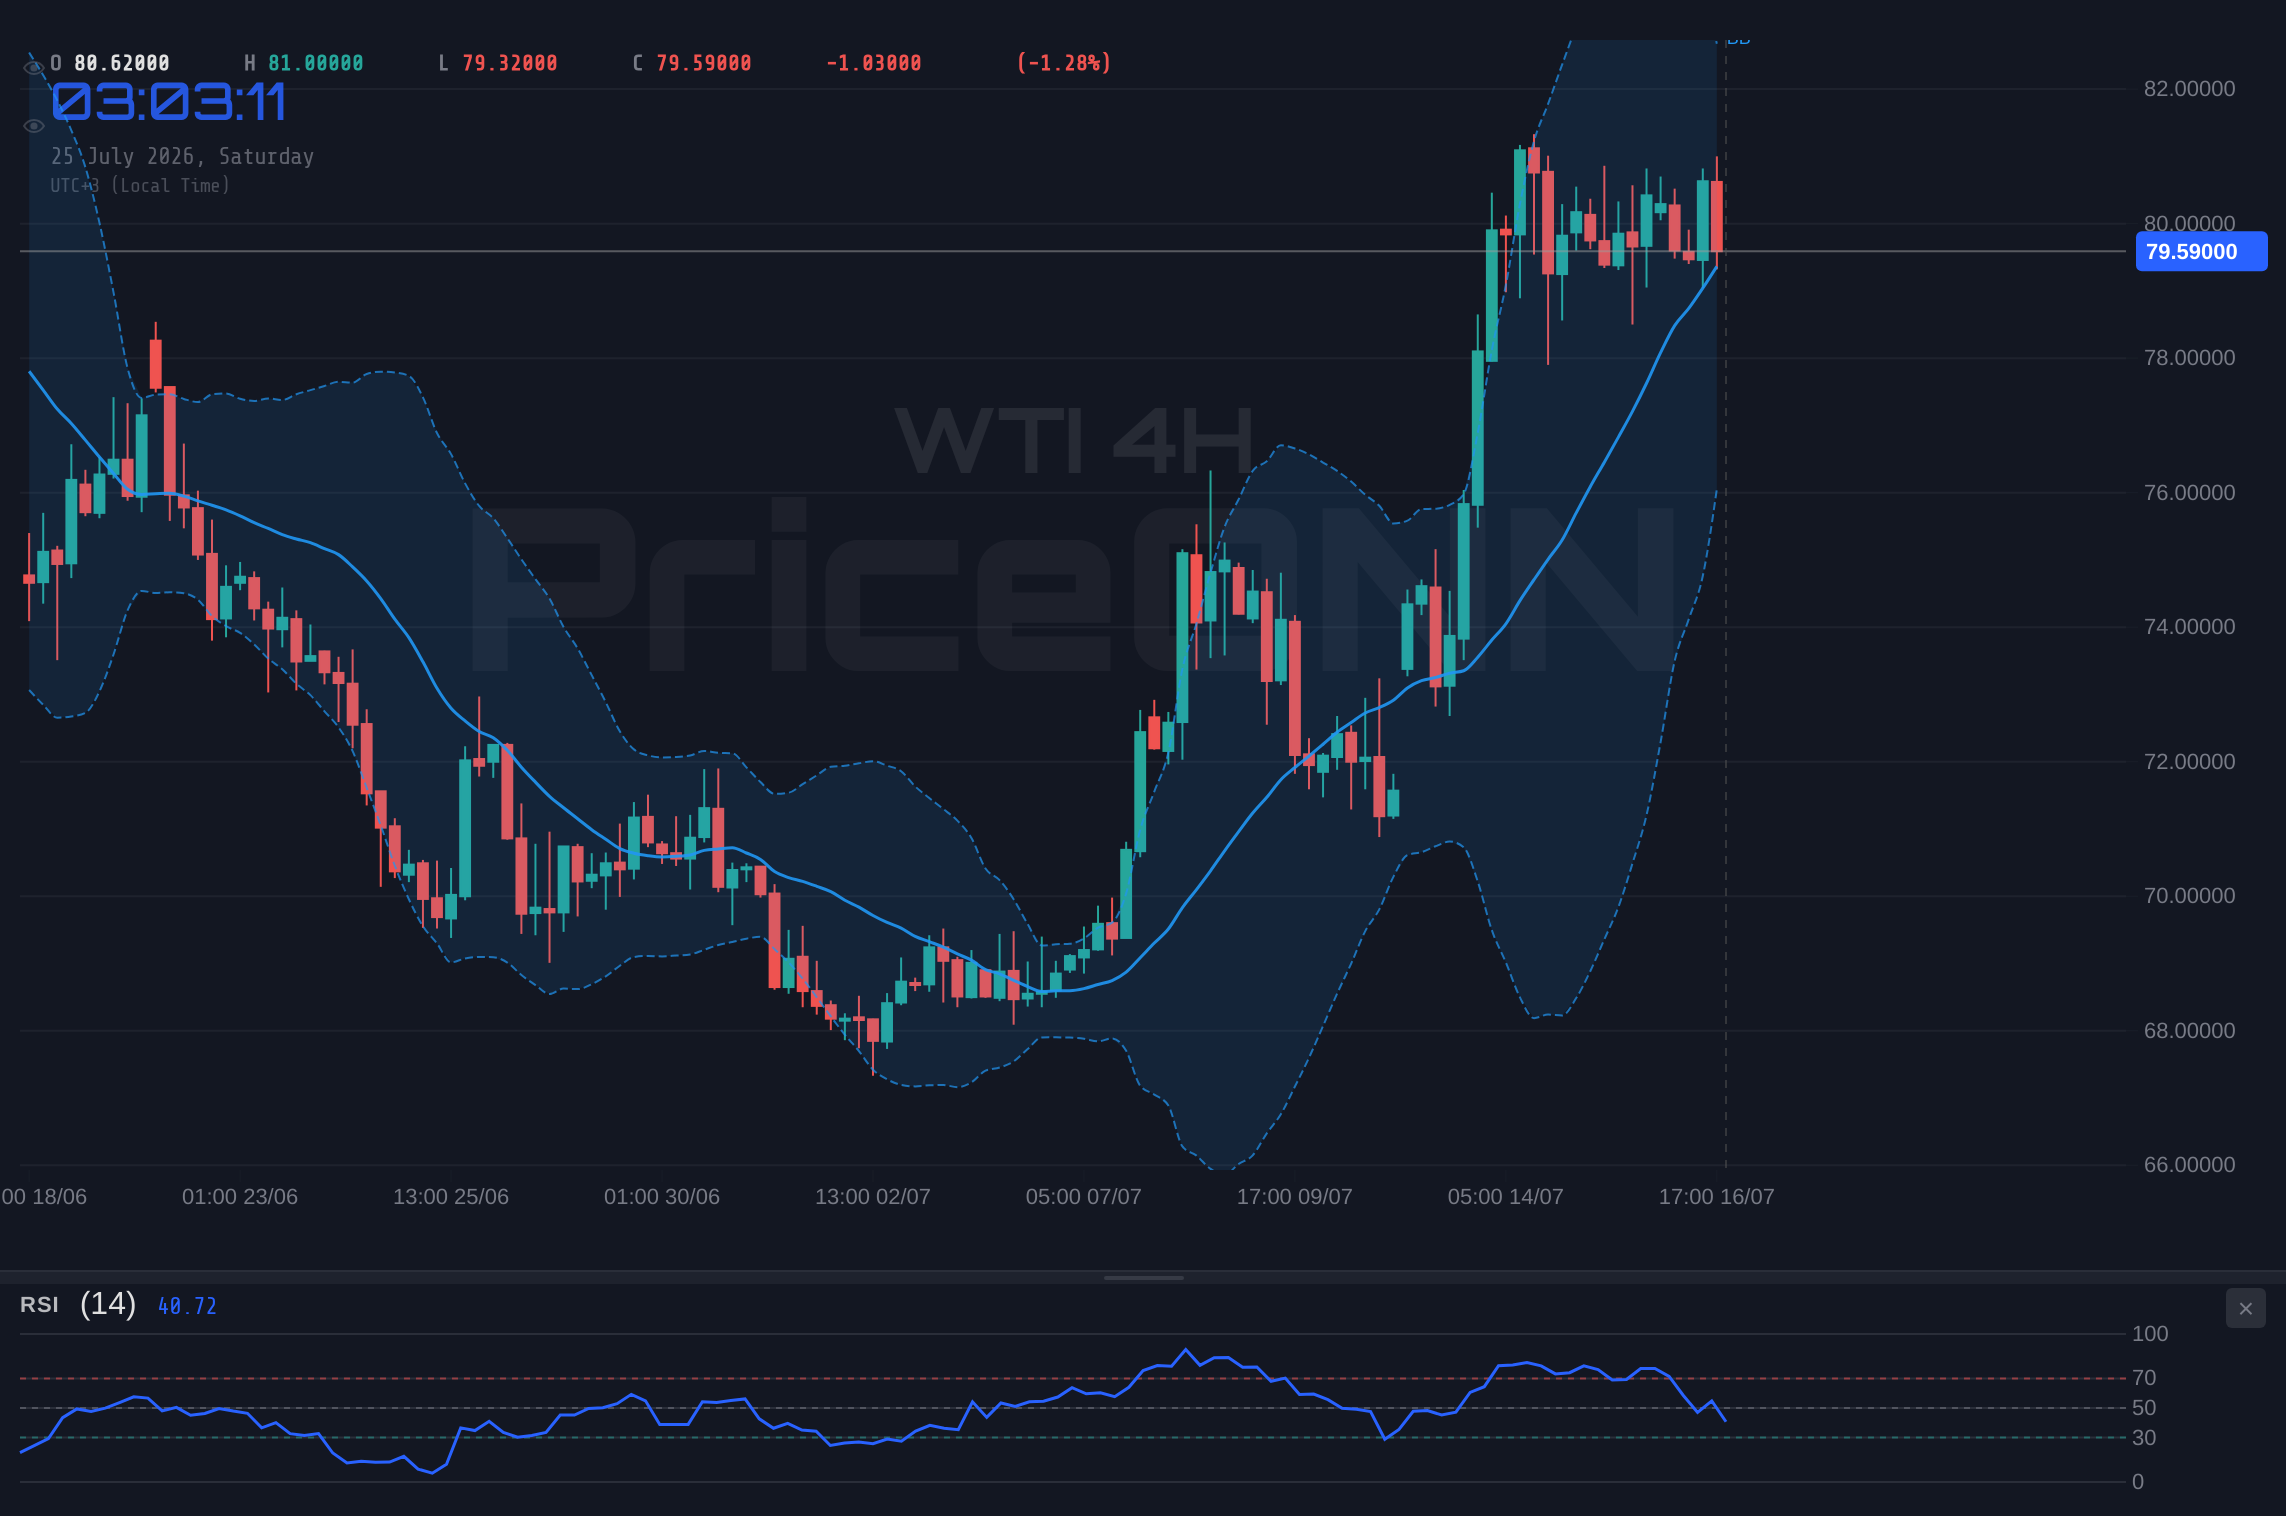
Moving to the 4-hour timeframe, the technical indicators present a slightly more constructive, albeit still cautious, outlook. The ADX here is stronger at 30.49, suggesting a more defined trend is attempting to form, though it's still in the mid-range, not indicating an explosive move. The RSI(14) at 58.47 sits in neutral territory but leans towards bullishness, suggesting room for upward movement. Crucially, the MACD is showing negative momentum, which contradicts the RSI's lean. This divergence highlights the current tug-of-war in the market. The Stochastic is showing K=58.32 and D=60.98, which is a bearish signal as %K is below %D. However, the Bollinger Bands are positioned with the price above the middle band, indicating a potential upward bias. This mixed signal environment on the 4-hour chart underscores the consolidation narrative, where underlying support might be present, but overhead resistance is proving formidable.
The daily chart provides a longer-term perspective, and here, the signals are more aligned with a potential bullish bias, despite the recent price action. The ADX at 29.46 indicates a strong trend, and the RSI(14) at 53.65 is comfortably in the neutral zone, leaning slightly higher, suggesting that the market is not overextended in either direction. The MACD is positive, with the MACD line above the signal line, pointing towards bullish momentum building. Furthermore, the Stochastic oscillator shows K=89.73 and D=76.8, firmly in overbought territory and signaling a strong bullish trend, though it also hints at a potential pullback or consolidation phase due to the extreme readings. The Bollinger Bands are also above the middle band, supporting a bullish inclination. This daily outlook suggests that while the short-term charts show consolidation, the longer-term trend might still favor the upside, provided key resistance levels can be breached.
The correlation with broader market indices and the US Dollar Index (DXY) remains a critical factor influencing WTI's price. Last week, the DXY showed some strength, reaching levels around 100.7. Typically, a stronger dollar exerts downward pressure on oil prices, as dollar-denominated commodities become more expensive for holders of other currencies. This inverse relationship likely played a role in capping WTI's upside attempts. Simultaneously, equity markets showed mixed signals. The S&P 500's daily chart indicated a downward trend, which can sometimes correlate with falling oil prices as it reflects broader economic concerns and reduced industrial demand. However, the 1-hour S&P 500 chart showed a bullish trend, creating conflicting signals. This complex correlation environment means that WTI's price action is not solely dictated by oil-specific fundamentals but is also susceptible to shifts in global risk sentiment and currency valuations.
Geopolitical tensions in the Middle East continue to be a significant, albeit often latent, support factor for oil prices. Reports earlier in the week highlighted escalating US-Iran conflict fears, which historically have led to supply disruption concerns and driven crude prices higher. While these tensions did not translate into a sustained rally last week, they provide a fundamental floor beneath WTI. Any significant escalation or perceived threat to oil supply routes, particularly in the Strait of Hormuz, could quickly ignite upward price momentum, potentially pushing WTI towards its next resistance levels. This underlying risk premium is a constant factor that traders must account for, as it can override technical indicators in the event of a major geopolitical development.
The macroeconomic backdrop, particularly inflation data and central bank policy expectations, remains a key driver for oil markets. With the DXY showing some strength and central banks globally grappling with inflation, the outlook for interest rates is paramount. Higher interest rates can dampen economic growth, thereby reducing oil demand, and also increase the cost of holding oil inventories. Conversely, any indication that inflation is cooling faster than expected could prompt central banks to reconsider their hawkish stance, potentially boosting economic activity and oil demand. The market is keenly awaiting upcoming economic reports, including inflation figures and central bank statements, which are expected to provide more clarity on the future path of monetary policy and its subsequent impact on energy markets.
Looking at the price action in more detail, WTI crude oil experienced a volatile start to the week, briefly touching highs near $81.00 before succumbing to selling pressure. This initial surge was likely fueled by earlier geopolitical news and supply disruption fears, as evidenced by some of the PriceONN market news from the preceding week, such as 'WTI Crude Oil Powers Ahead, Putting $90 Back on the Radar' and 'WTI surges above $83.00 amid escalating US-Iran conflict.' However, the inability to sustain these gains highlights the resistance encountered around the $80.00-$81.00 zone. The subsequent pullback towards the $79.00 area suggests that the market is now consolidating, with traders reassessing the risk-reward at current levels. This price action confirms the importance of the $79.23 support and $79.83 resistance levels identified on the 1-hour chart.
The breakdown of the week's price action into specific technical levels provides a clearer picture of the trading range. On the 1-hour chart, immediate support is seen at $79.23, followed by $78.97 and $78.63. Resistance lies at $79.83, with further levels at $80.17 and $80.43. These levels are crucial for short-term traders looking to capitalize on intraday movements. The fact that WTI failed to decisively break above the $79.83 resistance, and conversely, did not fall significantly below the $79.23 support, encapsulates the market's indecisiveness. This tight range trading suggests that a significant catalyst is needed to drive prices out of this equilibrium, with upcoming economic data releases and geopolitical updates being the most likely candidates.
On the 4-hour chart, the support levels are more significant, extending down to $79.51, $78.38, and $77.73. These levels represent areas where stronger buying interest might emerge if a bearish sentiment takes hold. Resistance on this timeframe is more pronounced, with key hurdles at $81.29, $81.94, and $83.07. The fact that prices retreated from the upper end of this range indicates that the path of least resistance may currently be downwards, or at least sideways, until a clear trend emerges. The ADX at 30.49 on this timeframe suggests that while a trend is trying to form, it lacks the conviction for a sustained move, aligning with the broader consolidation theme.
The daily timeframe offers a broader perspective on potential support and resistance. Key support is identified at $78.99, followed by $77.57 and $76.63. These are significant levels that, if breached, could signal a more substantial downturn. On the resistance side, the daily chart presents $81.35 as the immediate hurdle, with $82.29 and $83.71 being more substantial targets. The fact that WTI is currently trading below the $81.35 daily resistance reinforces the idea that a bullish breakout is not yet confirmed. The RSI at 53.65 and a positive MACD on the daily chart suggest underlying strength, but the price needs to overcome these daily resistance barriers to validate a continuation of any potential upward trend.
Considering the PriceONN market news from the previous week, several themes emerge that are still relevant. The recurring mention of 'US-Iran tensions' and 'escalating global supply risks' highlights the persistent geopolitical undercurrent supporting oil prices. News like 'WTI Crude Oil advances on US-Iran supply disruption fears' and 'WTI rises above $84.50 as escalating global supply risks threaten key export hubs' points to the volatility inherent in the Middle East situation. While prices did not sustain levels above $84.50 last week, these underlying risks remain. The 'WTI Price Forecast: Struggles below $82.00 and one-month high; bullish potential intact' also captures the essence of the current market sentiment – a struggle below key resistance, but with an underlying bullish potential that could be unlocked by the right catalyst.
The correlation with Brent crude, trading around $83.79, is also worth noting. While WTI and Brent often move in tandem, minor divergences can occur due to specific supply or demand factors in their respective regions. The current price spread, with Brent trading higher than WTI, is not unusual and generally reflects regional market dynamics. However, significant shifts in this spread could indicate underlying imbalances. For now, the general trend in both benchmarks is consolidation, suggesting that the broader energy market is awaiting fresh impetus.
The technical summary across different timeframes reveals a market in transition. The 1-hour chart leans bearish due to weak trend strength and negative MACD momentum, despite a neutral RSI. The 4-hour chart shows a stronger trend but mixed signals from RSI (bullish lean) and Stochastic (bearish). The daily chart, however, presents the most constructive picture, with a strong trend indicated by ADX, a bullish MACD, and overbought Stochastic readings that suggest upward momentum, albeit with room for consolidation. This divergence across timeframes emphasizes the need for caution and a clear strategy based on defined levels.
Scenario Analysis and Trade Plan
Given the current technical setup and market conditions, a multi-scenario approach is prudent. The ADX readings, particularly the 10.18 on the 1H and 30.49 on the 4H, suggest that while a trend might be attempting to form, it currently lacks strong conviction. The conflicting signals from indicators across different timeframes further complicate the picture, reinforcing the need for defined triggers and invalidation levels.
Bearish Scenario: Consolidation Break Lower
65% ProbabilityNeutral Scenario: Range-Bound Trading Continues
25% ProbabilityBullish Scenario: Breakout Above Resistance
10% ProbabilityThe prevailing sentiment, supported by the 1-hour chart's MACD and Stochastic signals, leans towards a bearish continuation if key support fails. The ADX readings across timeframes suggest that any move might lack immediate explosive power, favoring a measured breakdown rather than a sharp sell-off. However, the daily chart's underlying strength cannot be ignored, indicating that a bullish breakout, though less probable in the immediate short term, remains a possibility if driven by significant fundamental catalysts.
The key levels identified - $79.23 as immediate support and $79.83 as immediate resistance on the 1-hour chart - will be paramount in determining the next directional move. A break below $79.23 could initiate a move towards the $78.97 and $78.63 support zones, aligning with the bearish scenario. Conversely, a decisive push above $79.83, potentially fueled by positive geopolitical news or a weaker dollar, could target the $80.17 and $80.43 resistance levels. The neutral scenario assumes continued range-bound trading, a less likely but plausible outcome given the mixed signals.
Upcoming Catalysts and Market Outlook
The coming week is packed with crucial economic data releases and central bank events that are likely to inject volatility into the WTI market. The Federal Reserve's upcoming policy meeting and statements will be closely watched. While markets are pricing in a potential pause in rate hikes, any hawkish undertones or signals of persistent inflation could strengthen the dollar and weigh on oil prices. Conversely, dovish commentary or signs of inflation cooling could weaken the dollar and support commodities like oil. This dynamic is particularly relevant given the DXY's current levels around 100.7 and its inverse correlation with WTI.
Furthermore, upcoming inflation data, such as CPI or PCE reports, will be critical in shaping the narrative around interest rates. Higher-than-expected inflation would likely reinforce the hawkish stance of central banks, potentially dampening economic growth expectations and, by extension, oil demand. Lower inflation readings, however, could provide a much-needed boost to risk assets and energy commodities. Traders will be scrutinizing these figures for any deviation from forecasts, as such surprises often lead to significant market repricing.
Geopolitical developments in the Middle East will continue to be a wildcard. Any flare-up in tensions or perceived threats to oil supply infrastructure could quickly override technical signals and drive prices sharply higher. The PriceONN news feed has consistently highlighted these risks, and any new developments in this area will be a primary focus for traders monitoring WTI. The market's reaction to such news will also depend on the prevailing economic sentiment; in a risk-off environment, geopolitical supply fears tend to have a more pronounced impact on prices.
From a structural perspective, the market needs to break out of its current consolidation phase. The weak trend indicated by the 1-hour ADX suggests that the current price range is not sustainable in the long run. A decisive move above $79.83 resistance could target the $81.35 daily resistance, potentially signaling the start of a new uptrend. Conversely, a breakdown below $79.23 support could lead to a test of the lower daily support levels around $77.57. The battle between supply-side risks and demand-side concerns, amplified by central bank policies, will likely dictate which scenario plays out.
The technical indicators, while showing conflicting signals across timeframes, ultimately point towards a market awaiting confirmation. The daily chart's underlying bullish potential, indicated by positive MACD momentum and strong ADX, suggests that dips might be opportunities for longer-term buyers. However, the immediate resistance at $79.83 and the bearish leanings on the 1-hour chart necessitate caution for short-term traders. The coming week's economic data and geopolitical events will be the crucial catalysts needed to break this stalemate and define WTI's next significant price move.
Frequently Asked Questions: WTI Analysis
What happens if WTI breaks below the $79.23 support level?
If WTI closes decisively below the $79.23 support on the 1-hour chart, it would likely trigger a move towards the $78.97 level. Further downside could target the $78.63 support, aligning with our bearish scenario which carries a 65% probability.
Should I buy WTI at current levels around $79.59 given the mixed signals?
Buying at current levels requires caution due to the conflicting indicators. A more prudent approach would be to wait for a clear break above the $79.83 resistance, targeting $80.17, or a confirmed break below $79.23 support. Patience is key in this range-bound market.
Is the ADX at 10.18 a sell signal for WTI on the 1-hour chart?
An ADX reading of 10.18 indicates a very weak trend, not necessarily a sell signal itself. It suggests a lack of strong directional conviction, supporting the current consolidation phase. However, coupled with negative MACD momentum, it hints that downside pressure might be building if key support levels fail.
How will upcoming Fed policy decisions affect WTI this week?
Upcoming Fed decisions are critical. Hawkish signals or persistent inflation data could strengthen the DXY, pressuring WTI downwards. Conversely, dovish commentary or cooling inflation could weaken the dollar, potentially supporting a move towards WTI resistance levels around $80.17 and higher.
Track markets in real-time
AI-powered analysis, technical indicators and real-time price data.
Join Our Telegram Channel
Breaking market news, AI analysis and trading signals instantly.
Join Channel