

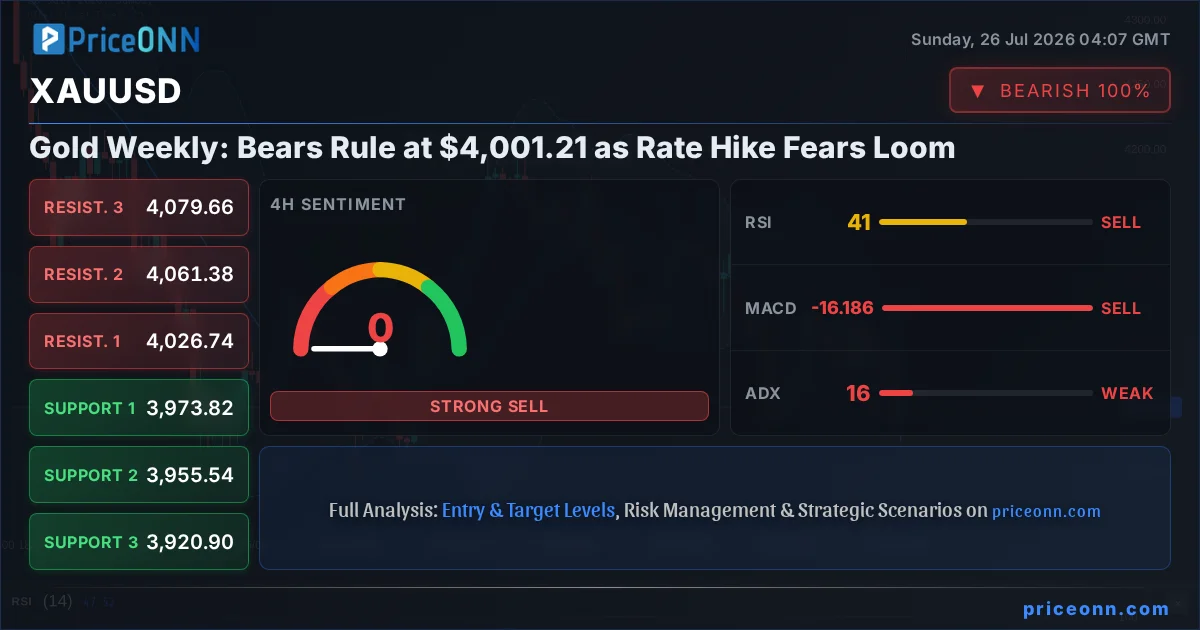
The relentless tug-of-war between bulls and bears in the gold market has reached a critical juncture, with bears firmly in control as XAUUSD trades at $4,001.21. Last week saw significant downside pressure on the precious metal, driven by a confluence of factors including a strengthening US Dollar Index (DXY), heightened expectations of further Federal Reserve rate hikes, and a complex geopolitical landscape. As traders brace for the upcoming week, the technical indicators are flashing cautionary signals, suggesting that the current bearish momentum could persist, testing key support levels. This analysis delves into the intricate dance of these forces, dissecting the technical and fundamental drivers shaping gold's trajectory and exploring the potential scenarios that lie ahead for this pivotal asset.
- RSI at 37.81 on the 1H chart signals bearish momentum is building, though not yet in oversold territory.
- Critical support sits at $3,991.82, tested multiple times this week; a break below could trigger further declines.
- The MACD histogram shows negative momentum across multiple timeframes, indicating potential for further price weakness.
- Hawkish Fed rate hike expectations are strengthening the DXY, currently at 100.70, which typically pressures gold prices.
The past week has been a stark reminder of gold's sensitivity to macroeconomic shifts and central bank policy. While geopolitical tensions often provide a floor for the precious metal, acting as a safe-haven bid, the overwhelming influence of monetary policy expectations has taken center stage. The Federal Reserve's stance on inflation and interest rates continues to be the dominant narrative, overshadowing other risk factors. This has led to a significant strengthening of the US Dollar, which, as we've seen time and again, exerts considerable downward pressure on dollar-denominated commodities like gold. The DXY's ascent to 100.70 reinforces this correlation, painting a challenging picture for gold bugs.
Looking at the broader market context, the S&P 500 and Nasdaq experienced a notable pullback last week, suggesting a dip in overall risk appetite. Typically, a decline in equities would spur demand for safe-haven assets like gold. However, the prevailing fear of inflation and the potential for more aggressive Fed tightening have created a scenario where even safe havens are not immune to selling pressure. This unusual dynamic underscores the market's current focus on interest rates over traditional risk-off sentiment. The narrative is shifting: instead of seeking shelter from market turmoil, investors are increasingly concerned about the erosion of purchasing power due to inflation, making a strong dollar and higher yields more attractive.
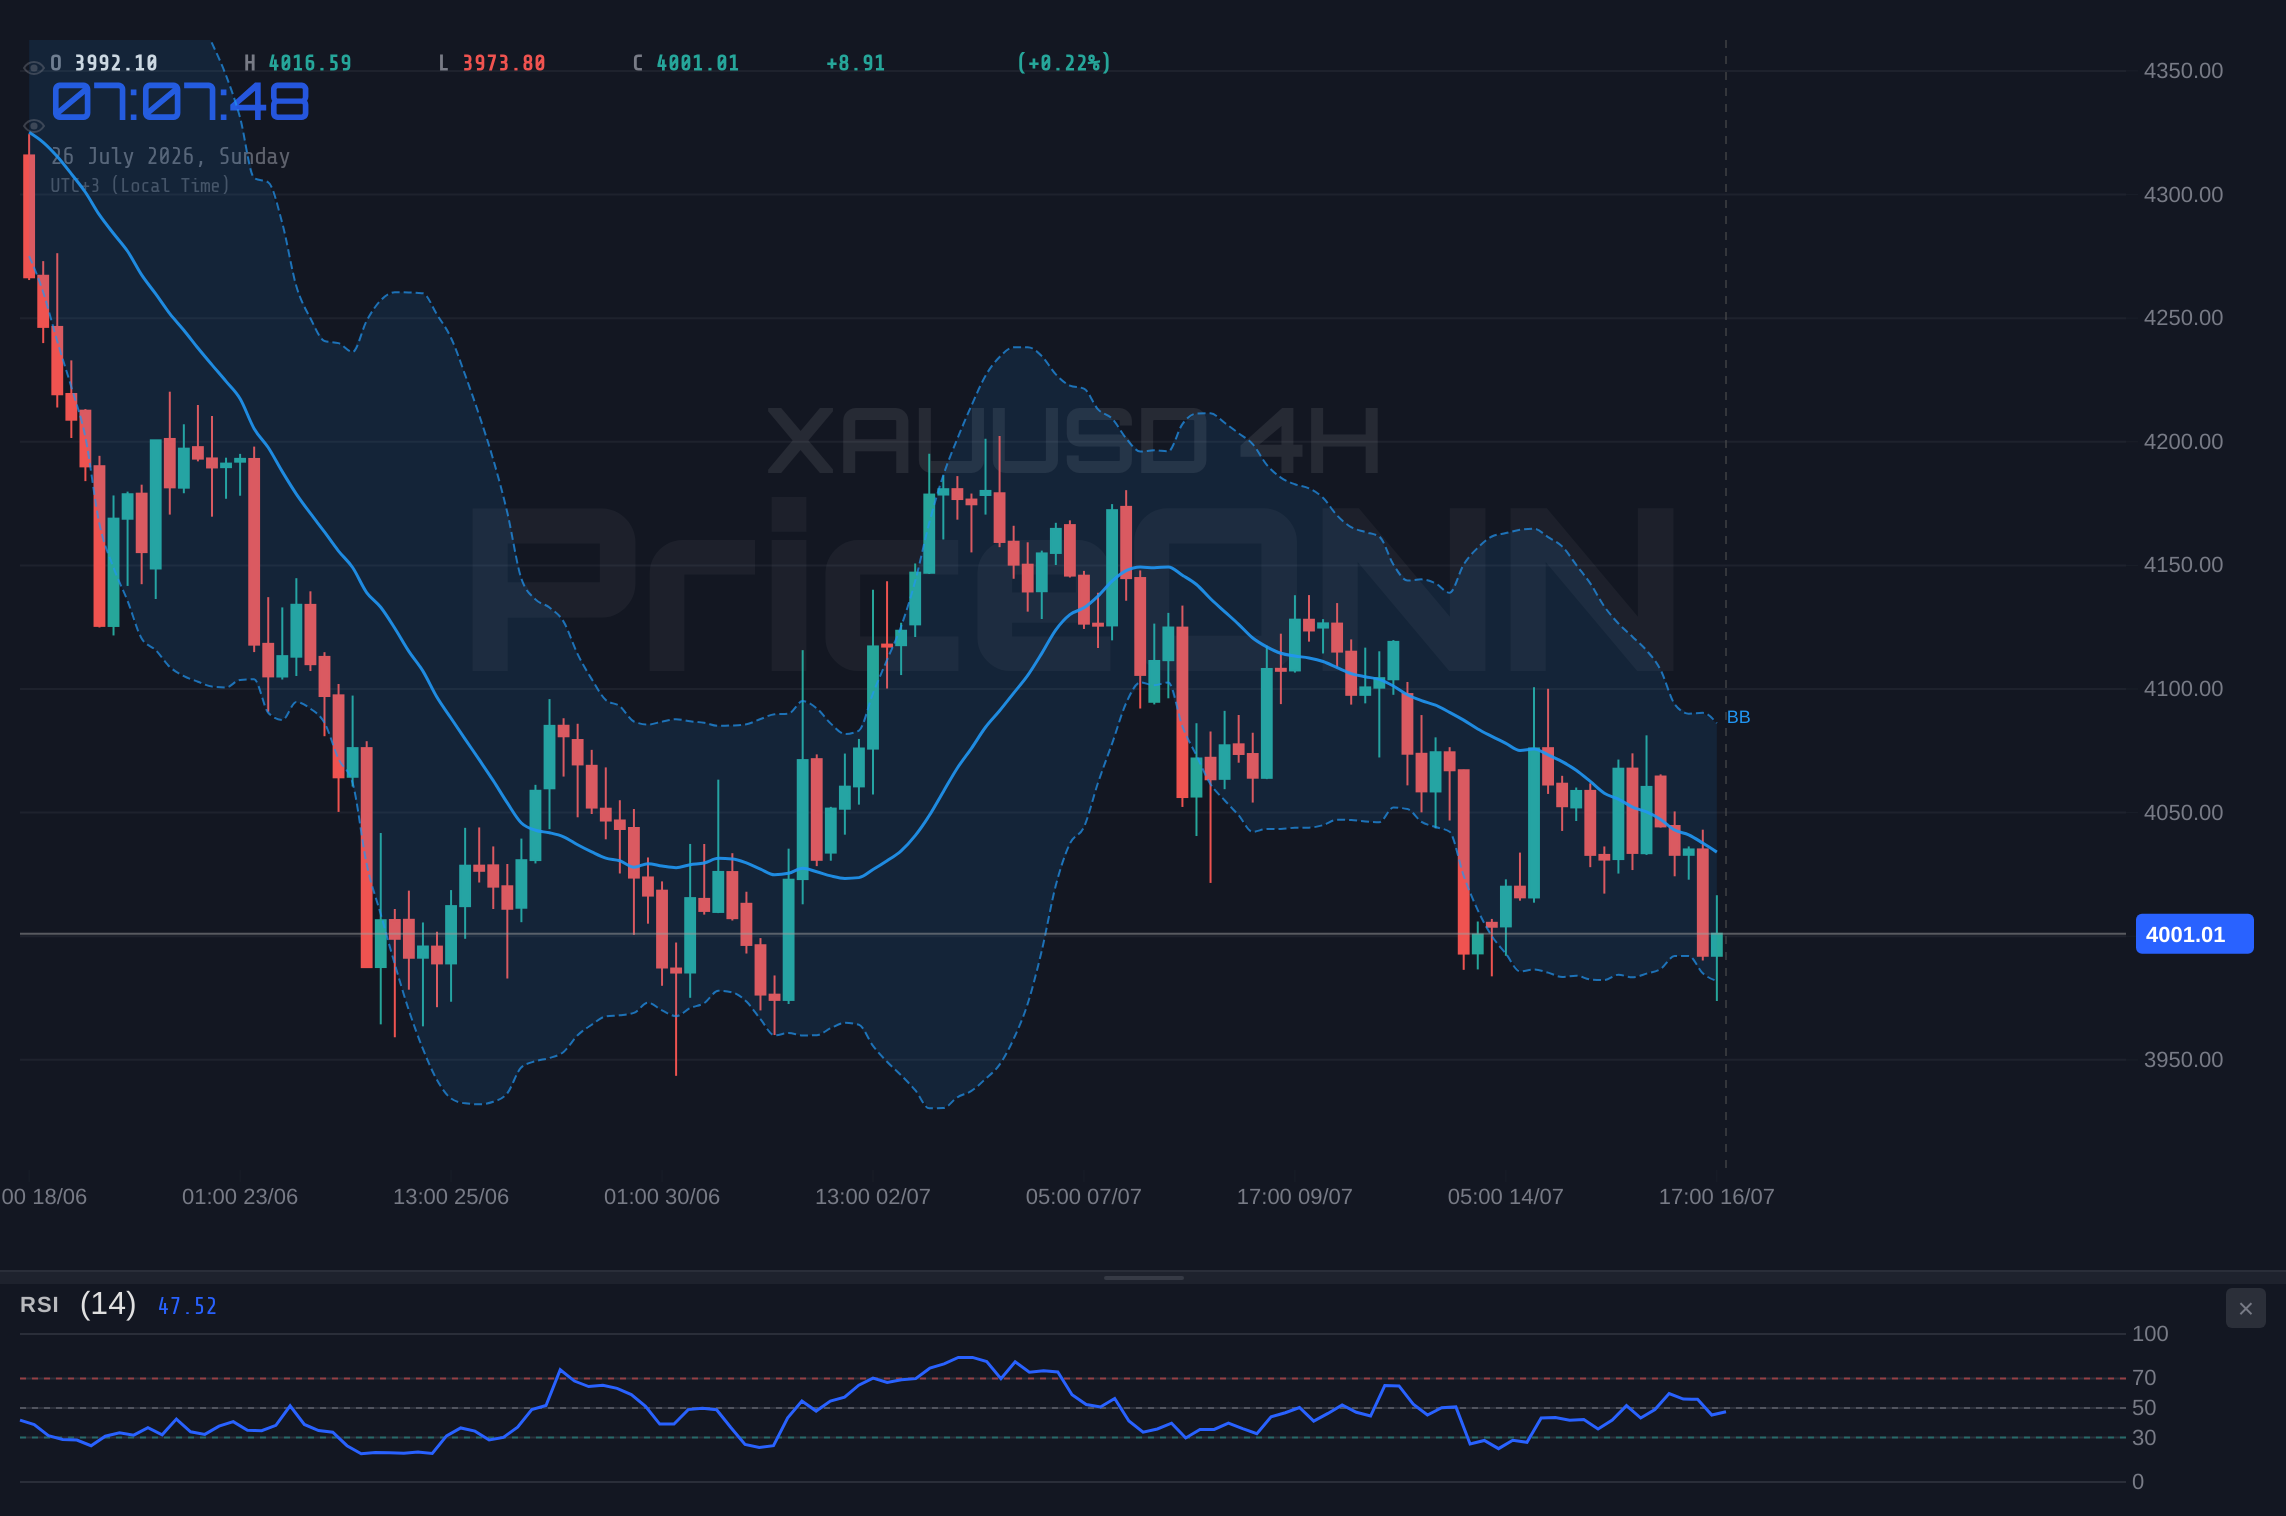
On the technical front, XAUUSD's price action on the 1-hour chart paints a picture of bearish dominance. The current price of $4,001.21 sits below key resistance levels, and the RSI reading of 37.81 indicates a lack of buying conviction. While not yet in oversold territory, the downward trajectory of the RSI suggests that sellers are gaining the upper hand. The MACD histogram is firmly in negative territory, reinforcing the bearish momentum. The ADX at 20.26, while indicating a moderately strong downtrend, also suggests that the market is not yet in a full-blown panic, leaving room for further consolidation or a potential reversal if key levels hold. However, the overall signal across multiple indicators points towards a 'SELL' recommendation.
The 4-hour timeframe offers a slightly different, yet still bearish, perspective. The trend is clearly defined as 'Düşüş' (Downtrend) with a strength of 83%. The price is trading below the middle Bollinger Band, a classic sign of bearish pressure. The RSI at 40.59 continues to hover in the neutral zone but leans towards further decline. The Stochastic indicator is showing a bearish signal (%K
The Bear Case: Why Gold Faces Headwinds
The primary argument for a continued bearish outlook on gold hinges on the Federal Reserve's hawkish stance. Recent economic data, while mixed, has provided enough fuel for the Fed to signal its resolve in combating inflation. Markets are now pricing in a higher probability of additional rate hikes in the coming months, a move that typically strengthens the US dollar and increases the opportunity cost of holding non-yielding assets like gold. The DXY's current level of 100.70 is a testament to this sentiment, acting as a significant headwind for precious metals. When the dollar strengthens, gold becomes more expensive for holders of other currencies, dampening demand. Furthermore, higher interest rates make interest-bearing assets, such as US Treasuries, more attractive relative to gold.
The narrative around inflation is also playing a crucial role. While gold is often seen as an inflation hedge, its performance can be complex. If inflation remains stubbornly high, central banks are forced to tighten policy more aggressively, which can lead to slower economic growth or even recession. In such an environment, the strength of the dollar and rising yields can outweigh the inflation-hedging appeal of gold, at least in the short to medium term. The recent news highlighting the Fed's focus on inflation, even amidst concerns about economic recovery, suggests that monetary tightening will remain the priority. This fundamental backdrop creates a challenging environment for gold, as seen in its recent 1.46% daily decline.
Technically, the daily chart for XAUUSD reinforces the bearish thesis. The trend is unequivocally 'Düşüş' (Downtrend) with a strength of 95%. The RSI at 38.86, while seemingly neutral, is trending downwards, indicating weakening buying interest. The MACD, however, presents a conflicting signal here, showing positive momentum with the MACD line above the signal line. This divergence is something to monitor closely; it could suggest that the bearish momentum is losing steam, or it could be a temporary anomaly within a larger downtrend. Bollinger Bands are situated below the middle band, confirming the bearish bias. The ADX at 39.16 signifies a strong existing trend, making it difficult for bulls to gain traction without significant fundamental shifts. The general signal remains 'SAT' (SELL), with resistance at $4,088.69.
The sheer strength of the bearish signals across multiple timeframes cannot be ignored. On the 1-hour chart, 7 out of 8 indicators point to a sell. On the 4-hour chart, all 8 indicators are aligned for a sell. Even the daily chart, often considered more reliable for longer-term trends, shows 7 out of 8 indicators favoring a sell. This overwhelming consensus suggests that the path of least resistance for gold prices in the near term is downwards. Key support levels to watch are $4,024.67 (daily support 1) and $3,991.82 (1H support 1). A decisive break below these levels could accelerate the sell-off.
The Bull Case: What Could Turn the Tide?
Despite the prevailing bearish sentiment, a robust bull case for gold can be constructed, primarily rooted in its safe-haven appeal and potential inflation-hedging properties. Geopolitical tensions, while not the primary driver currently, remain a significant underlying risk factor. Any escalation in conflicts, particularly in the Middle East or between major global powers, could rapidly shift market sentiment, driving a flight to safety that would benefit gold. The news from July 24th mentioning Trump's looming decision on Iran adds a layer of binary risk that could quickly alter the gold landscape. While Brent crude prices have seen some fluctuations, the underlying geopolitical instability remains, providing a latent bid for gold.
Furthermore, the persistent inflation concerns, if they continue to defy central bank efforts, could ultimately bolster gold's role as an inflation hedge. If the market begins to doubt the Fed's ability to control inflation without causing a severe recession, investors might pivot back to gold as a store of value. The fact that gold prices have shown resilience around the $4,000 mark, despite strong dollar headwinds, suggests that there is underlying demand at these levels. The July 22nd PriceONN market news highlighted that 'Gold Holds Near Two-week High' and 'Gold Rises Amid Heightened External Risks,' indicating that these safe-haven flows are still present, even if suppressed by monetary policy concerns.
From a technical perspective, certain indicators offer glimmers of hope for the bulls, albeit cautiously. On the 1-hour chart, the Stochastic indicator shows a potential bullish signal (%K > %D), suggesting oversold conditions might be easing, leading to a potential bounce. While the RSI is at 37.81, it is not deeply oversold, leaving room for upward movement. The MACD on the daily chart, as mentioned, shows positive momentum, which could be the precursor to a larger reversal if confirmed by other indicators and price action. The ADX on the 1-hour chart is at 20.26, indicating a moderately strong trend, but its lower levels compared to the daily ADX (39.16) suggest that the bearish conviction might be weakening on shorter timeframes.
Moreover, the fact that gold has been trading within a defined range, with support holding around the $4,000 psychological level, indicates a battleground where neither bulls nor bears have achieved complete dominance. The daily support level at $4,024.67 and the 1-hour support at $3,991.82 are critical. If these levels can be defended and price can begin to consolidate above $4,000, it could set the stage for a recovery. The July 21st news reported that 'Gold climbs as buyers defend $4,000,' which is a crucial observation. This defense of a key psychological level is often the first sign of a potential trend reversal, especially if accompanied by a shift in fundamental drivers.
Navigating the Crosscurrents: Technical Levels and Scenarios
The current technical landscape for XAUUSD presents a complex picture, with conflicting signals across different timeframes and indicators. The overwhelming 'SELL' signals on the 1H and 4H charts suggest immediate downside risk, while the positive MACD momentum on the daily chart offers a potential counter-narrative for a longer-term recovery. Understanding the key levels becomes paramount for traders looking to navigate this choppy market. On the downside, the immediate support is at $3,991.82 on the 1-hour chart, followed by $3,976.78 and $3,964.39. A break below these levels would invalidate any immediate bullish hopes and likely accelerate selling pressure.
Conversely, for the bulls to regain control, gold needs to decisively break through the resistance levels. The first significant hurdle is at $4,019.21 on the 1-hour chart, followed by $4,031.60 and $4,046.62. A sustained move above $4,046.62, coupled with positive shifts in RSI and MACD on shorter timeframes, could signal a short-term bullish reversal. On the daily chart, the resistance level at $4,088.69 is the next major target for any sustained rally. However, achieving this level would require a significant shift in the fundamental narrative, likely driven by a dovish turn from the Fed or a major geopolitical shock.
The ADX indicator across all timeframes (1H: 20.26, 4H: 15.79, 1D: 39.16) highlights the current market condition. The lower values on shorter timeframes suggest a lack of strong trending conviction, indicating potential for range-bound trading or volatility. However, the strong ADX on the daily chart points to an established downtrend. This divergence in trend strength across timeframes often leads to whipsaws and requires careful risk management. Traders should be wary of false breakouts or breakdowns in such an environment. Patience and a clear trading plan are essential to avoid getting caught on the wrong side of a volatile move.
The interplay between gold and the DXY is critical. With the DXY at 100.70 and showing signs of strength, particularly on the 1-hour chart where it's trading above the upper Bollinger Band with an RSI of 56.6, the pressure on gold is likely to continue. Any dovish signals from the Fed, or signs of weakening US economic data, could see the DXY pull back, providing relief for gold. Conversely, stronger-than-expected US economic data or hawkish rhetoric from Fed officials would likely propel the DXY higher and keep gold under pressure. The upcoming economic calendar, particularly any data related to inflation or employment, will be closely watched for clues.
Trade Scenarios: Navigating the Uncertainty
Given the conflicting signals and the critical juncture at which XAUUSD currently sits, a nuanced approach to trading is necessary. The predominant bearish sentiment across shorter timeframes, contrasted with some longer-term bullish undertones and the ever-present geopolitical risk, creates a complex trading environment. The following scenarios outline potential paths forward, with probabilities assigned based on the current technical and fundamental landscape. It is crucial to remember that these are potential outcomes, and active risk management is paramount.
Bearish Consolidation Continues
65% ProbabilityRange-Bound Trading Around $4,000
25% ProbabilityShort-Covering Rally Initiated
10% ProbabilityThe current ADX of 39.16 on the daily chart strongly suggests a trending market, which typically favors directional trades. However, the lower ADX values on shorter timeframes indicate choppiness, making range-bound strategies or waiting for clearer signals more prudent. The $4,000 level remains a significant psychological and technical pivot. A break below this could trigger stop-losses and accelerate the bearish trend, aligning with the dominant signals. Conversely, a sustained hold above $4,000, potentially fueled by unexpected geopolitical news or a dovish shift in Fed rhetoric, could initiate a short-covering rally.
The strength of the US Dollar, currently at 100.70 on the DXY, is a major factor. If the dollar continues to appreciate, it will likely cap any significant upside for gold. Traders will be closely monitoring upcoming economic data, particularly inflation reports and Fed speeches, for any indication of a change in monetary policy direction. The July 24th news highlighting the Fed's potential for a surprise as early as July, due to oil rally and tariffs, adds an element of unpredictability. If the Fed were to pivot or signal a less aggressive hiking path, it could provide a significant tailwind for gold, but current data does not strongly support this.
The conflict between the positive MACD on the daily chart and the overwhelmingly negative signals on shorter timeframes is a key point of contention. This divergence suggests that while the larger trend might still have underlying strength, the immediate pressure is bearish. For a bullish scenario to materialize, we would need to see confirmation across multiple timeframes – a break above daily resistance ($4,088.69) coupled with a bullish crossover on the daily MACD and a sustained move above key 1H resistance levels like $4,046.62. Without such confluence, the risk remains skewed to the downside.
The Verdict: Bears Hold the Reins, but Watch Key Levels
After analyzing the price action, technical indicators, and the macroeconomic backdrop, the evidence overwhelmingly points towards continued bearish pressure on gold in the short to medium term. The Federal Reserve's commitment to fighting inflation, reflected in the strengthening DXY and the market's repricing of rate hike expectations, creates a challenging environment for non-yielding assets like gold. The technical indicators across the 1-hour and 4-hour charts are largely aligned, flashing 'SELL' signals and indicating bearish momentum.
The ADX values on the 1-hour and 4-hour charts (20.26 and 15.79 respectively) suggest that while a trend exists, it's not yet a runaway market, leaving room for consolidation or potential reversals. However, the strong ADX on the daily chart (39.16) confirms an established downtrend. The key levels to watch are the support at $3,991.82 and resistance at $4,046.62. A break below $3,991.82 would likely confirm the bearish scenario, potentially leading to tests of lower support levels like $3,976.78. Conversely, a sustained move above $4,046.62 would be required to invalidate the bearish outlook and open the door for a potential short-covering rally, though this seems less probable given the current fundamental drivers.
The news from July 24th about Gold and Silver tumbling as the oil link returns, and Trump's looming decision on Iran adding binary risk, highlights the volatility and uncertainty. While geopolitical risks provide a floor, the dominant narrative remains monetary policy. Until there is a clear signal of a Fed pivot, or a significant escalation in geopolitical tensions that forces a flight to safety, gold is likely to remain under pressure. Traders should exercise caution, manage risk diligently, and wait for clear confirmation before committing to large positions. The current market conditions favor a 'wait and watch' approach, focusing on the key support and resistance levels as potential entry or exit points depending on the prevailing trend.
Frequently Asked Questions: XAUUSD Analysis
What happens if XAUUSD breaks below the $3,991.82 support level?
A break below $3,991.82 on the 1-hour chart would invalidate the current consolidation and likely trigger further selling pressure. This could lead to tests of subsequent support levels at $3,976.78 and $3,964.39 as bearish momentum accelerates.
Should I consider buying XAUUSD at current levels around $4,001.21, given the mixed signals?
Buying at current levels is not advised due to the prevailing bearish signals across multiple timeframes and the strong DXY. A more prudent approach would be to wait for a confirmed break above key resistance like $4,046.62, or a clear defense of major support with bullish confirmation, indicating a higher probability setup.
Is the RSI at 37.81 a sell signal for XAUUSD right now?
An RSI of 37.81 on the 1-hour chart indicates bearish momentum but is not yet in oversold territory. While it supports the bearish outlook, it's not a standalone sell signal. Confirmation from price action breaking key support levels and other indicators like MACD would be necessary for a high-conviction sell trade.
How will upcoming Fed rate hike expectations affect XAUUSD this week?
Continued expectations of Fed rate hikes will likely strengthen the US Dollar, putting further downward pressure on XAUUSD. Any signals from Fed officials or economic data suggesting a more hawkish stance could push gold towards lower support levels, while signs of a pause or pivot could initiate a relief rally.
Track markets in real-time
AI-powered analysis, technical indicators and real-time price data.
Join Our Telegram Channel
Breaking market news, AI analysis and trading signals instantly.
Join Channel