

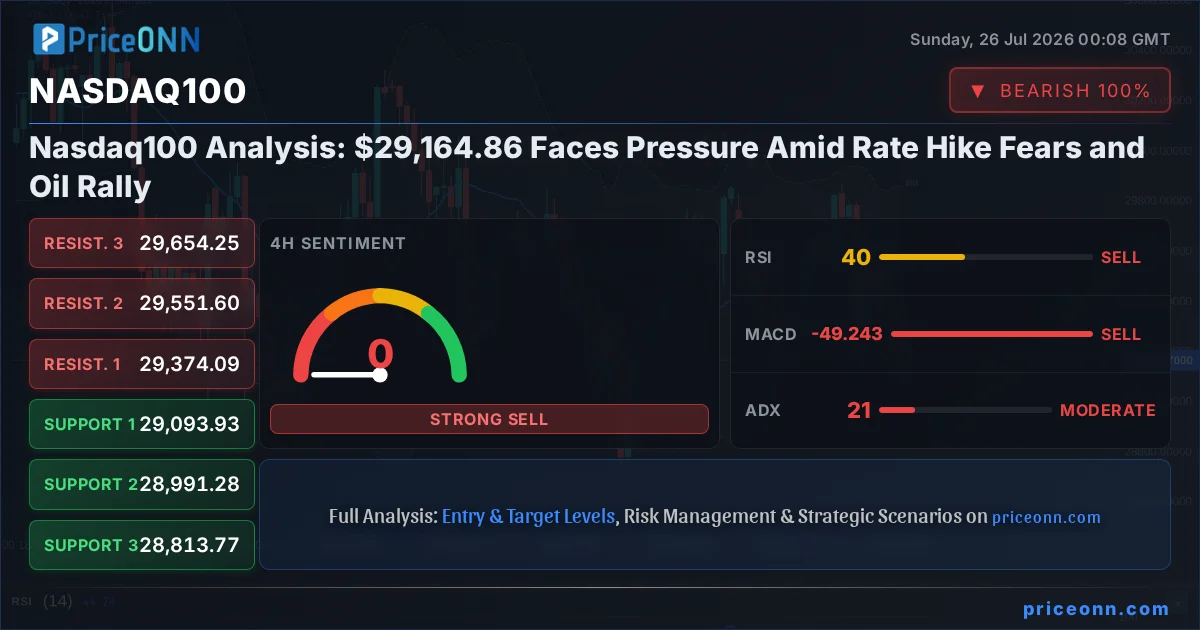
The landscape for the Nasdaq 100 index, currently trading at $29,164.86, is becoming increasingly complex as a confluence of macroeconomic forces threatens to derail its recent momentum. Last week's price action painted a decidedly bearish picture, with the index experiencing significant declines across multiple timeframes. This downturn wasn't a random event; it was a direct consequence of shifting market sentiment driven by renewed concerns over central bank policy, specifically looming interest rate hikes, and the persistent upward pressure on oil prices, which are reigniting inflation worries. As traders brace for a volatile week ahead, understanding the interplay between these fundamental drivers and the technical signals is paramount for navigating the potential choppy waters.
- The Nasdaq 100 is trading at $29,164.86, showing bearish signals on multiple timeframes.
- RSI readings across timeframes (1H: 32.77, 4H: 39.92, 1D: 46.36) indicate waning bullish momentum and potential for further downside.
- Critical support for the Nasdaq 100 lies at $29,135.55 (1H), $29,093.93 (4H), and $28,852.38 (1D).
- The correlation with rising oil prices and renewed inflation concerns, coupled with hawkish Fed expectations, is creating a challenging environment for growth stocks.
- Key resistance levels to watch are $29,260.86 (1H), $29,374.09 (4H), and $29,848.39 (1D).
Navigating the Macroeconomic Storm: Rate Hikes and Inflation Fears
The specter of higher interest rates looms large over equity markets, and the Nasdaq 100, with its heavy weighting towards growth and technology stocks, is particularly sensitive to such shifts. Last week saw market participants repricing their expectations for future Federal Reserve policy. While the Fed has held rates steady recently, the persistent nature of inflation, exacerbated by geopolitical tensions and a surging oil price, is forcing policymakers to reconsider their dovish stance. The narrative is shifting back towards a potential for further tightening, a move that typically dampens investor appetite for riskier assets like growth stocks. This recalibration of rate expectations is a fundamental headwind that cannot be ignored, directly impacting the valuation models for companies within the Nasdaq 100. The market's reaction is a clear signal: the era of cheap money might not be over, but it's certainly facing renewed scrutiny.
Furthermore, the relentless rise in oil prices, with Brent crude hovering near significant levels, adds another layer of complexity. Oil is a key driver of inflation, impacting everything from transportation costs to manufacturing inputs. As oil prices climb, the risk of inflation becoming more entrenched increases. This creates a difficult dilemma for central banks like the Federal Reserve. On one hand, they need to control inflation; on the other, they must avoid triggering a recession by tightening too aggressively. The market is essentially betting that the Fed will be forced to remain hawkish, even at the risk of economic slowdown. This dynamic is creating a 'risk-off' sentiment, where investors rotate away from high-growth assets and towards safer havens or value-oriented sectors. The correlation between oil prices and inflation expectations is a critical factor to monitor, as it directly influences the Fed's policy path and, consequently, the Nasdaq 100's trajectory.
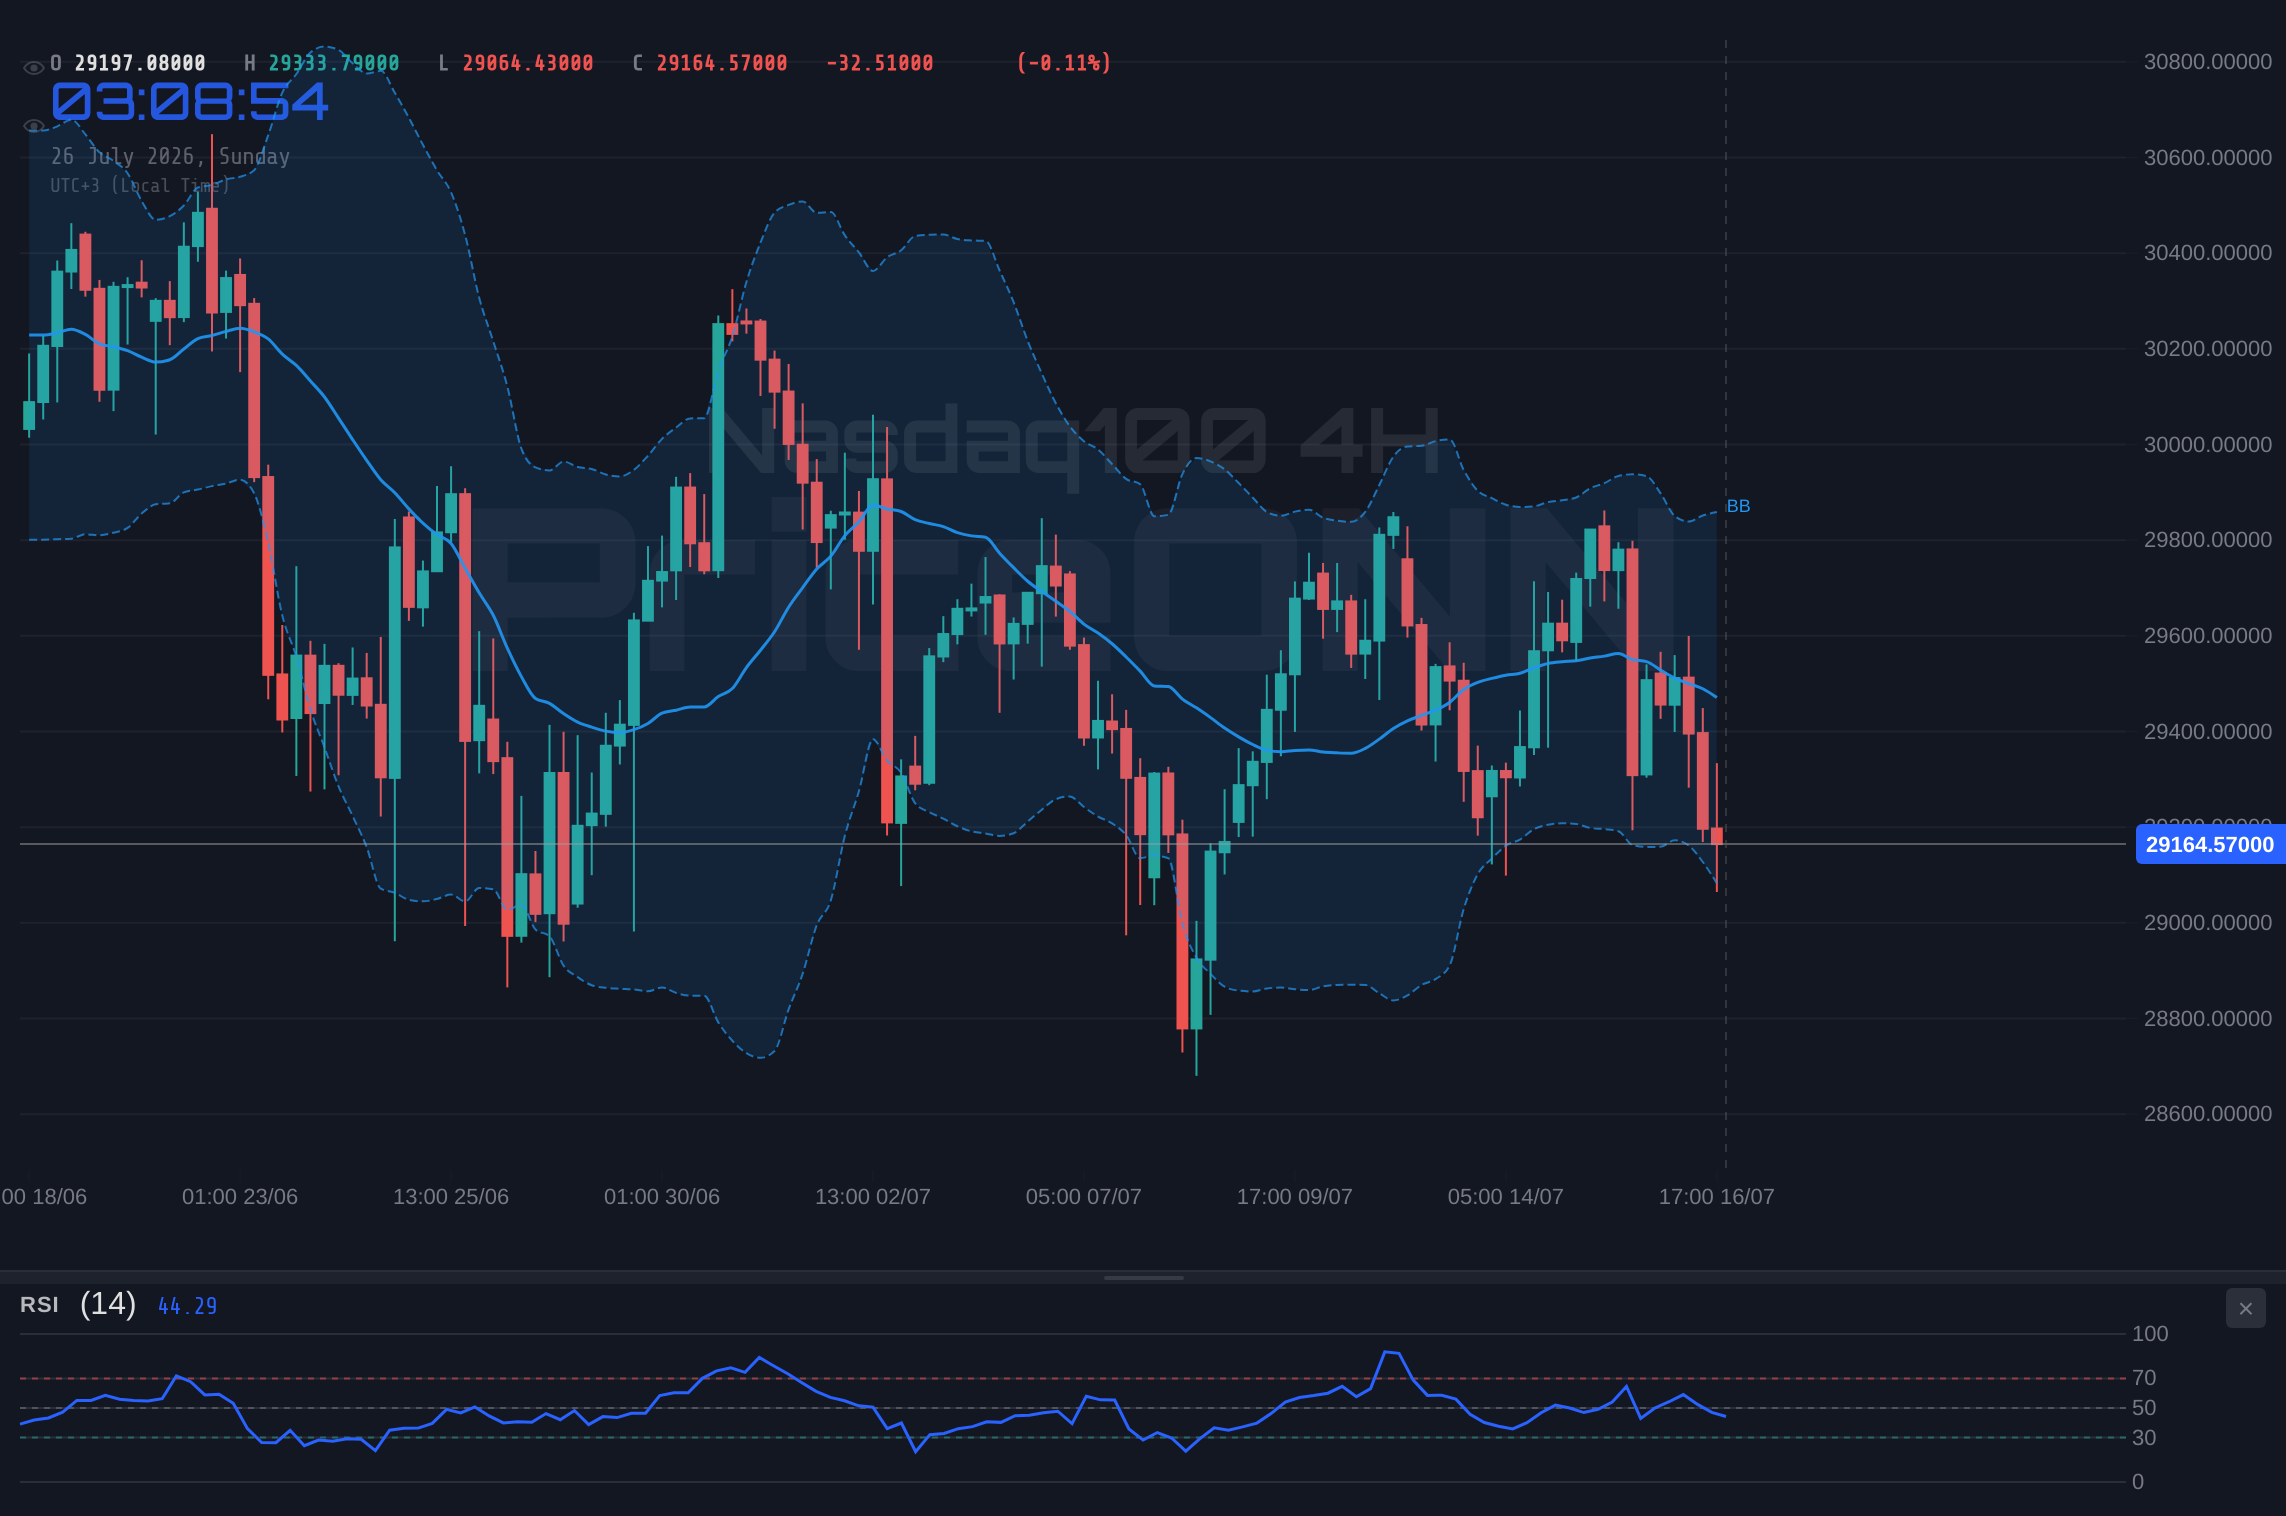
The correlation between rising oil prices and inflation expectations is intensifying. With Brent crude trading near key resistance, the market is increasingly pricing in a hawkish stance from the Federal Reserve, which poses a significant challenge for growth-oriented indices like the Nasdaq 100. This dual pressure of higher rates and persistent inflation is creating a difficult operating environment for tech valuations.
Technical Signals Pointing South: A Bearish Week for the Nasdaq 100
The technical indicators for the Nasdaq 100, across multiple timeframes, have been flashing warning signs, reinforcing the bearish sentiment driven by macro factors. On the 1-hour chart, the price is currently $29,164.86, but the trend is firmly bearish with a strength of 92%. The ADX at 33.23 indicates a strong downward trend, and the RSI(14) at 32.77 is firmly in oversold territory, suggesting further downside potential. The MACD is also showing negative momentum, with the MACD line below the signal line, reinforcing the bearish outlook. Support levels on this timeframe are identified at $29,135.55, $29,076.62, and $29,010.24. Resistance is noted at $29,260.86, $29,327.24, and $29,386.17. This short-term picture suggests immediate pressure on the index.
Zooming out to the 4-hour timeframe, the trend remains bearish with a strength of 50%, but the signals are still leaning negative. The RSI(14) at 39.92, while not deeply oversold, is below the 50 mark and shows a downward eğilim. The MACD continues to exhibit negative momentum, and the Stochastic K and D lines are showing a bearish crossover ($K=15.62, D=35.37$), indicating a potential for further decline. The ADX at 21.06 signifies a moderately strong downtrend. Key support levels on this chart are found at $29,093.93, $28,991.28, and $28,813.77, while resistance is capped around $29,374.09, $29,551.6, and $29,654.25. The consistent bearish signals across these shorter timeframes suggest that any rallies are likely to be met with selling pressure.
The daily timeframe provides a broader perspective, and here too, the picture is predominantly bearish. The trend is classified as bearish with a strength of 83%. The RSI(14) at 46.36 is hovering in neutral territory but trending downwards, indicating a lack of buying conviction. The MACD is negative, with the histogram below the zero line, confirming bearish momentum. Bollinger Bands are positioned below the middle band, suggesting a bearish bias. Stochastic lines show a bullish crossover ($K=58.96, D=53.46$), which, in the context of the prevailing downtrend, might represent a temporary pause or a bear market rally rather than a sustained reversal. However, the ADX at 15.12 indicates a weak trend on this timeframe, suggesting that while the direction is down, the conviction might be waning, potentially leading to a period of consolidation before the next major move. Support levels on the daily chart are critical: $28,852.38, $28,511.31, and further down at $27,950.67. Resistance is formidable, starting at $29,848.39, followed by $30,189.46, and $30,516.93.
Correlations and External Influences: DXY, Oil, and the Fed's Tightrope Walk
The Nasdaq 100 does not operate in a vacuum. Its movements are intricately linked to broader market forces, and understanding these correlations is crucial for a comprehensive analysis. The Dollar Index (DXY), currently trading around 100.7, serves as a significant barometer for global risk appetite and influences currency markets, which in turn can impact equity valuations. A strengthening dollar, as indicated by the DXY's upward trend on the 1-hour and 1-day charts, typically puts pressure on dollar-denominated assets, including US equities, by making them relatively more expensive for foreign investors. The DXY's current position above the middle Bollinger Band on the 1-hour chart and its positive momentum, though facing resistance, suggests continued strength could weigh on the Nasdaq 100.
The ongoing rally in oil prices presents a complex dichotomy. While higher oil prices can boost energy stocks and contribute to inflation, they also act as a drag on consumer spending and corporate earnings for non-energy sectors. This dynamic creates a challenging environment for the Federal Reserve, caught between managing inflation and supporting economic growth. The market's interpretation, as reflected in the shift towards hawkish rate expectations, is that the Fed will prioritize inflation control. This means that any signs of persistent inflation, including those driven by oil, will likely be met with a commitment to higher rates, further pressuring growth stocks within the Nasdaq 100. The intricate dance between oil prices, inflation data, and central bank policy is a key narrative to follow.
Looking at the broader equity market, the S&P 500 is showing a mixed picture, trading at $6,572.87 with a strong upward trend on the 1-hour chart but a bearish daily trend. The Nasdaq 100's performance, particularly its recent decline while the S&P 500 showed intraday strength, suggests a potential divergence or a sector-specific rotation. The Nasdaq 100's 1-hour RSI at 32.77 and the daily RSI at 46.36 both point towards bearish momentum, contrasting with the S&P 500's 1-hour RSI of 70.95. This divergence warrants close observation; a sustained weakness in the Nasdaq 100 while the broader market attempts to rally could signal deeper issues within the tech sector.
The correlation with bond yields also remains a critical factor. As inflation expectations rise and the Fed signals a hawkish bias, Treasury yields tend to move higher. Higher yields increase the cost of capital for companies, particularly growth-oriented ones that rely heavily on future earnings. This makes them less attractive compared to fixed-income investments. The upward pressure on yields, driven by inflation concerns and Fed policy expectations, creates an indirect headwind for the Nasdaq 100. Understanding this relationship is key: a sustained rise in yields, especially on the longer end of the curve, could further exacerbate the selling pressure on growth stocks.
Examining Key Levels and Potential Scenarios for the Week Ahead
As we look towards the upcoming week, the Nasdaq 100 is perched at a critical juncture. The bearish sentiment from last week, coupled with the technical indicators, suggests that downside pressure is likely to persist, at least in the short term. The primary support level to watch on the 1-hour chart is $29,135.55. A decisive break below this level, supported by strong volume, could accelerate the decline towards the 4-hour support at $29,093.93 and potentially the daily support at $28,852.38. The confluence of these support levels represents a significant area where buyers might step in, but given the prevailing macro headwinds, a sustained bounce is not guaranteed.
On the resistance side, the immediate hurdle for any potential recovery is the 1-hour resistance at $29,260.86. A successful push above this level, sustained by increasing volume and positive news flow, could see the index re-test higher levels. However, the overall bearish tone suggests that significant rallies might be capped. The 4-hour resistance at $29,374.09 and the more substantial daily resistance at $29,848.39 represent key battlegrounds. Breaking through these levels would require a significant shift in market sentiment, perhaps a dovish surprise from the Fed or a de-escalation of geopolitical tensions. Until then, sellers are likely to remain active on any upward moves.
Bearish Descent: Testing Lower Supports
70% ProbabilityConsolidation Zone: Waiting for Clarity
20% ProbabilityUnexpected Rebound: Riding the Fed Pivot Hopes
10% ProbabilityThe Road Ahead: What to Watch in the Coming Week
Looking ahead, the economic calendar is packed with events that could significantly influence the Nasdaq 100. The Federal Reserve's upcoming meeting, while not expected to result in a rate hike, will be closely scrutinized for any hints about future policy direction. Market participants will be dissecting the accompanying statement and any press conference for signals regarding inflation concerns and the potential for future tightening. Any deviation from the expected 'higher for longer' narrative could trigger a sharp risk-on move, while a more hawkish tone would reinforce the current bearish bias.
Furthermore, key inflation data, such as CPI and PCE reports, will be crucial. If these figures come in hotter than expected, it would solidify the market's fears of persistent inflation and bolster the case for continued Fed hawkishness, likely leading to further pressure on the Nasdaq 100. Conversely, signs of moderating inflation could provide some relief and potentially open the door for a short-term rally. The ongoing geopolitical developments, particularly concerning Middle East tensions and their impact on oil prices, will also remain a critical backdrop. Any escalation could further fuel inflation fears and risk aversion, while de-escalation might offer a reprieve.
The correlation between the Nasdaq 100 and the US Dollar Index (DXY) will be important to monitor. If the DXY continues its upward trend, driven by Fed hawkishness or safe-haven demand, it will likely continue to act as a headwind for the index. Conversely, any signs of dollar weakness could coincide with a potential recovery in tech stocks. Investors should also keep an eye on the performance of the broader equity indices, such as the S&P 500 and Dow Jones 30. While the Nasdaq 100 has shown specific weakness, a general market sell-off would amplify the downward pressure. The strength of the trend indicators, such as the ADX, will be vital in determining the conviction behind any directional moves.
Ultimately, the path forward for the Nasdaq 100 appears to be one of caution. The confluence of macroeconomic pressures – rising rates, persistent inflation fears fueled by oil prices, and a strengthening dollar – creates a challenging environment. While technical indicators suggest further downside is possible, particularly if key support levels are breached, the market remains sensitive to central bank signals. Traders will be looking for clear confirmation before committing to significant positions, making volatility a likely companion in the coming weeks. Patience and disciplined risk management will be key to navigating this complex market landscape.
Frequently Asked Questions: Nasdaq100 Analysis
What happens if the Nasdaq 100 breaks below the 1H support at $29,135.55?
A break below $29,135.55 on the 1-hour chart would invalidate the current neutral stance and likely trigger further selling pressure. This could accelerate the decline towards the 4-hour support level at $29,093.93, as indicated by the bearish technical signals across multiple timeframes.
Should I consider buying the Nasdaq 100 at current levels around $29,164.86 given the bearish trend?
Buying at current levels of $29,164.86 is not advisable given the prevailing bearish trend and negative technical signals. The probability of a further decline is higher. A more prudent approach would be to wait for a clear break of resistance levels like $29,260.86, or for a confirmed bounce from a major support level like $28,852.38, coupled with a shift in macro sentiment.
Is the RSI at 32.77 on the 1-hour chart a strong sell signal for the Nasdaq 100?
An RSI reading of 32.77 on the 1-hour chart indicates oversold conditions, which can sometimes precede a bounce. However, in the context of a strong bearish trend (ADX at 33.23) and broader macro concerns, it doesn't automatically signal a buy. It suggests selling momentum might be exhausting in the short term, but further confirmation from price action and other indicators is needed before considering any reversal.
How will the upcoming Fed meeting impact the Nasdaq 100 at $29,164.86?
The upcoming Fed meeting is critical. If the Fed signals continued hawkishness due to inflation concerns, it would likely reinforce the bearish outlook for the Nasdaq 100, pushing it towards lower support levels. Conversely, any hint of a dovish pivot or a more optimistic view on inflation could trigger a relief rally, potentially pushing the index towards resistance levels like $29,848.39.
Track markets in real-time
AI-powered analysis, technical indicators and real-time price data.
Join Our Telegram Channel
Breaking market news, AI analysis and trading signals instantly.
Join Channel