

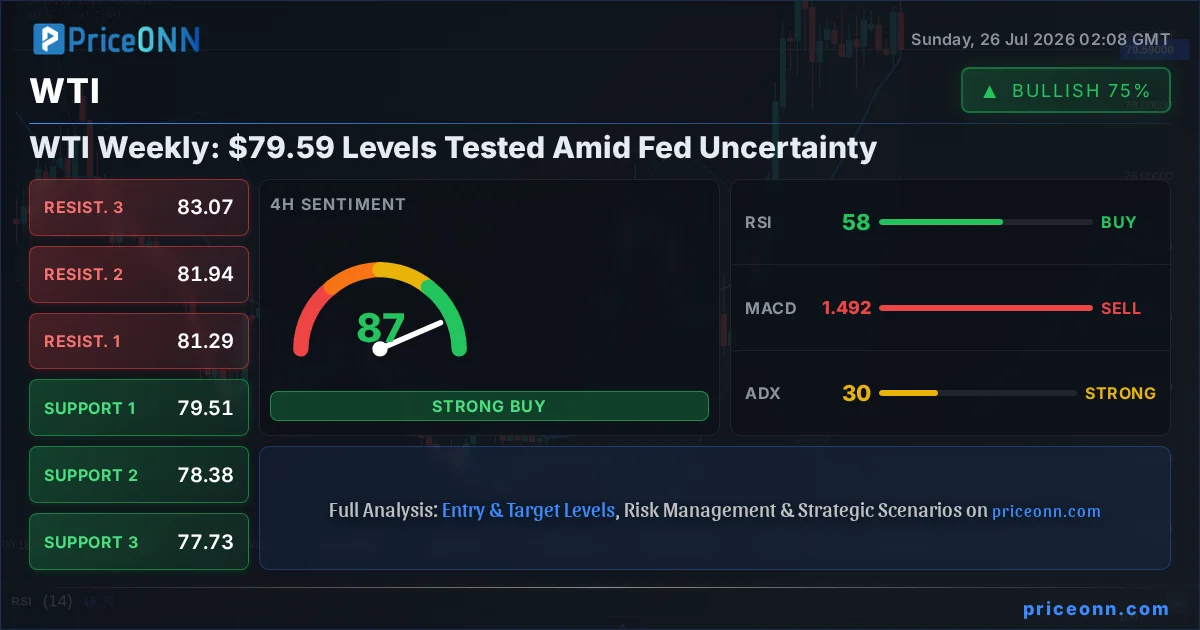
The past week for WTI crude oil was largely defined by consolidation, with prices hovering around the critical $79.59 mark. This period of relative calm, however, belies significant undercurrents shaping the energy market's trajectory. As traders step back and reassess, the looming shadow of Federal Reserve policy decisions, coupled with persistent geopolitical tensions, creates a complex backdrop. The question isn't just about where oil prices are headed next, but rather how these macro forces will dictate the terms of engagement for both bulls and bears in the coming trading sessions. This analysis delves into the key developments of the past week, examines the technical landscape, and forecasts the crucial levels and events to watch as the market prepares for another pivotal week.
- WTI crude oil closed the week near $79.59, reflecting a period of consolidation.
- Critical support for WTI is observed at $78.97, with resistance eyed at $80.17.
- The ADX at 10.18 on the 1H chart indicates a weak trend, suggesting a potential breakout is brewing.
- Federal Reserve policy expectations and ongoing Middle East tensions are key macro drivers influencing WTI's correlation with the DXY.
The Week That Was: A Market in Limbo
Last week presented a mixed bag for WTI crude oil. While supply disruption fears, particularly those stemming from escalating US-Iran tensions, provided a floor under prices, robust economic data and shifting Federal Reserve expectations acted as a ceiling. The market found itself in a tug-of-war, unable to decisively break through established resistance levels nor succumbing to significant selling pressure that would test lower support zones. This equilibrium, however, is inherently unstable, and the confluence of macroeconomic drivers and geopolitical catalysts suggests that the current flatness is merely a prelude to a more significant price move.
Price action throughout the week saw WTI trade within a relatively tight range, largely oscillating between the $78.63 support and the $80.43 resistance. This lack of directional conviction indicates that market participants are adopting a wait-and-see approach, likely awaiting clearer signals from central banks or a definitive escalation or de-escalation of geopolitical flashpoints. The absence of a strong trend on the shorter timeframes, as evidenced by the 1H ADX reading of 10.18, underscores this indecision. However, the longer-term daily chart still hints at underlying bullish potential, with an ADX of 29.46 suggesting a strong trend could re-emerge.
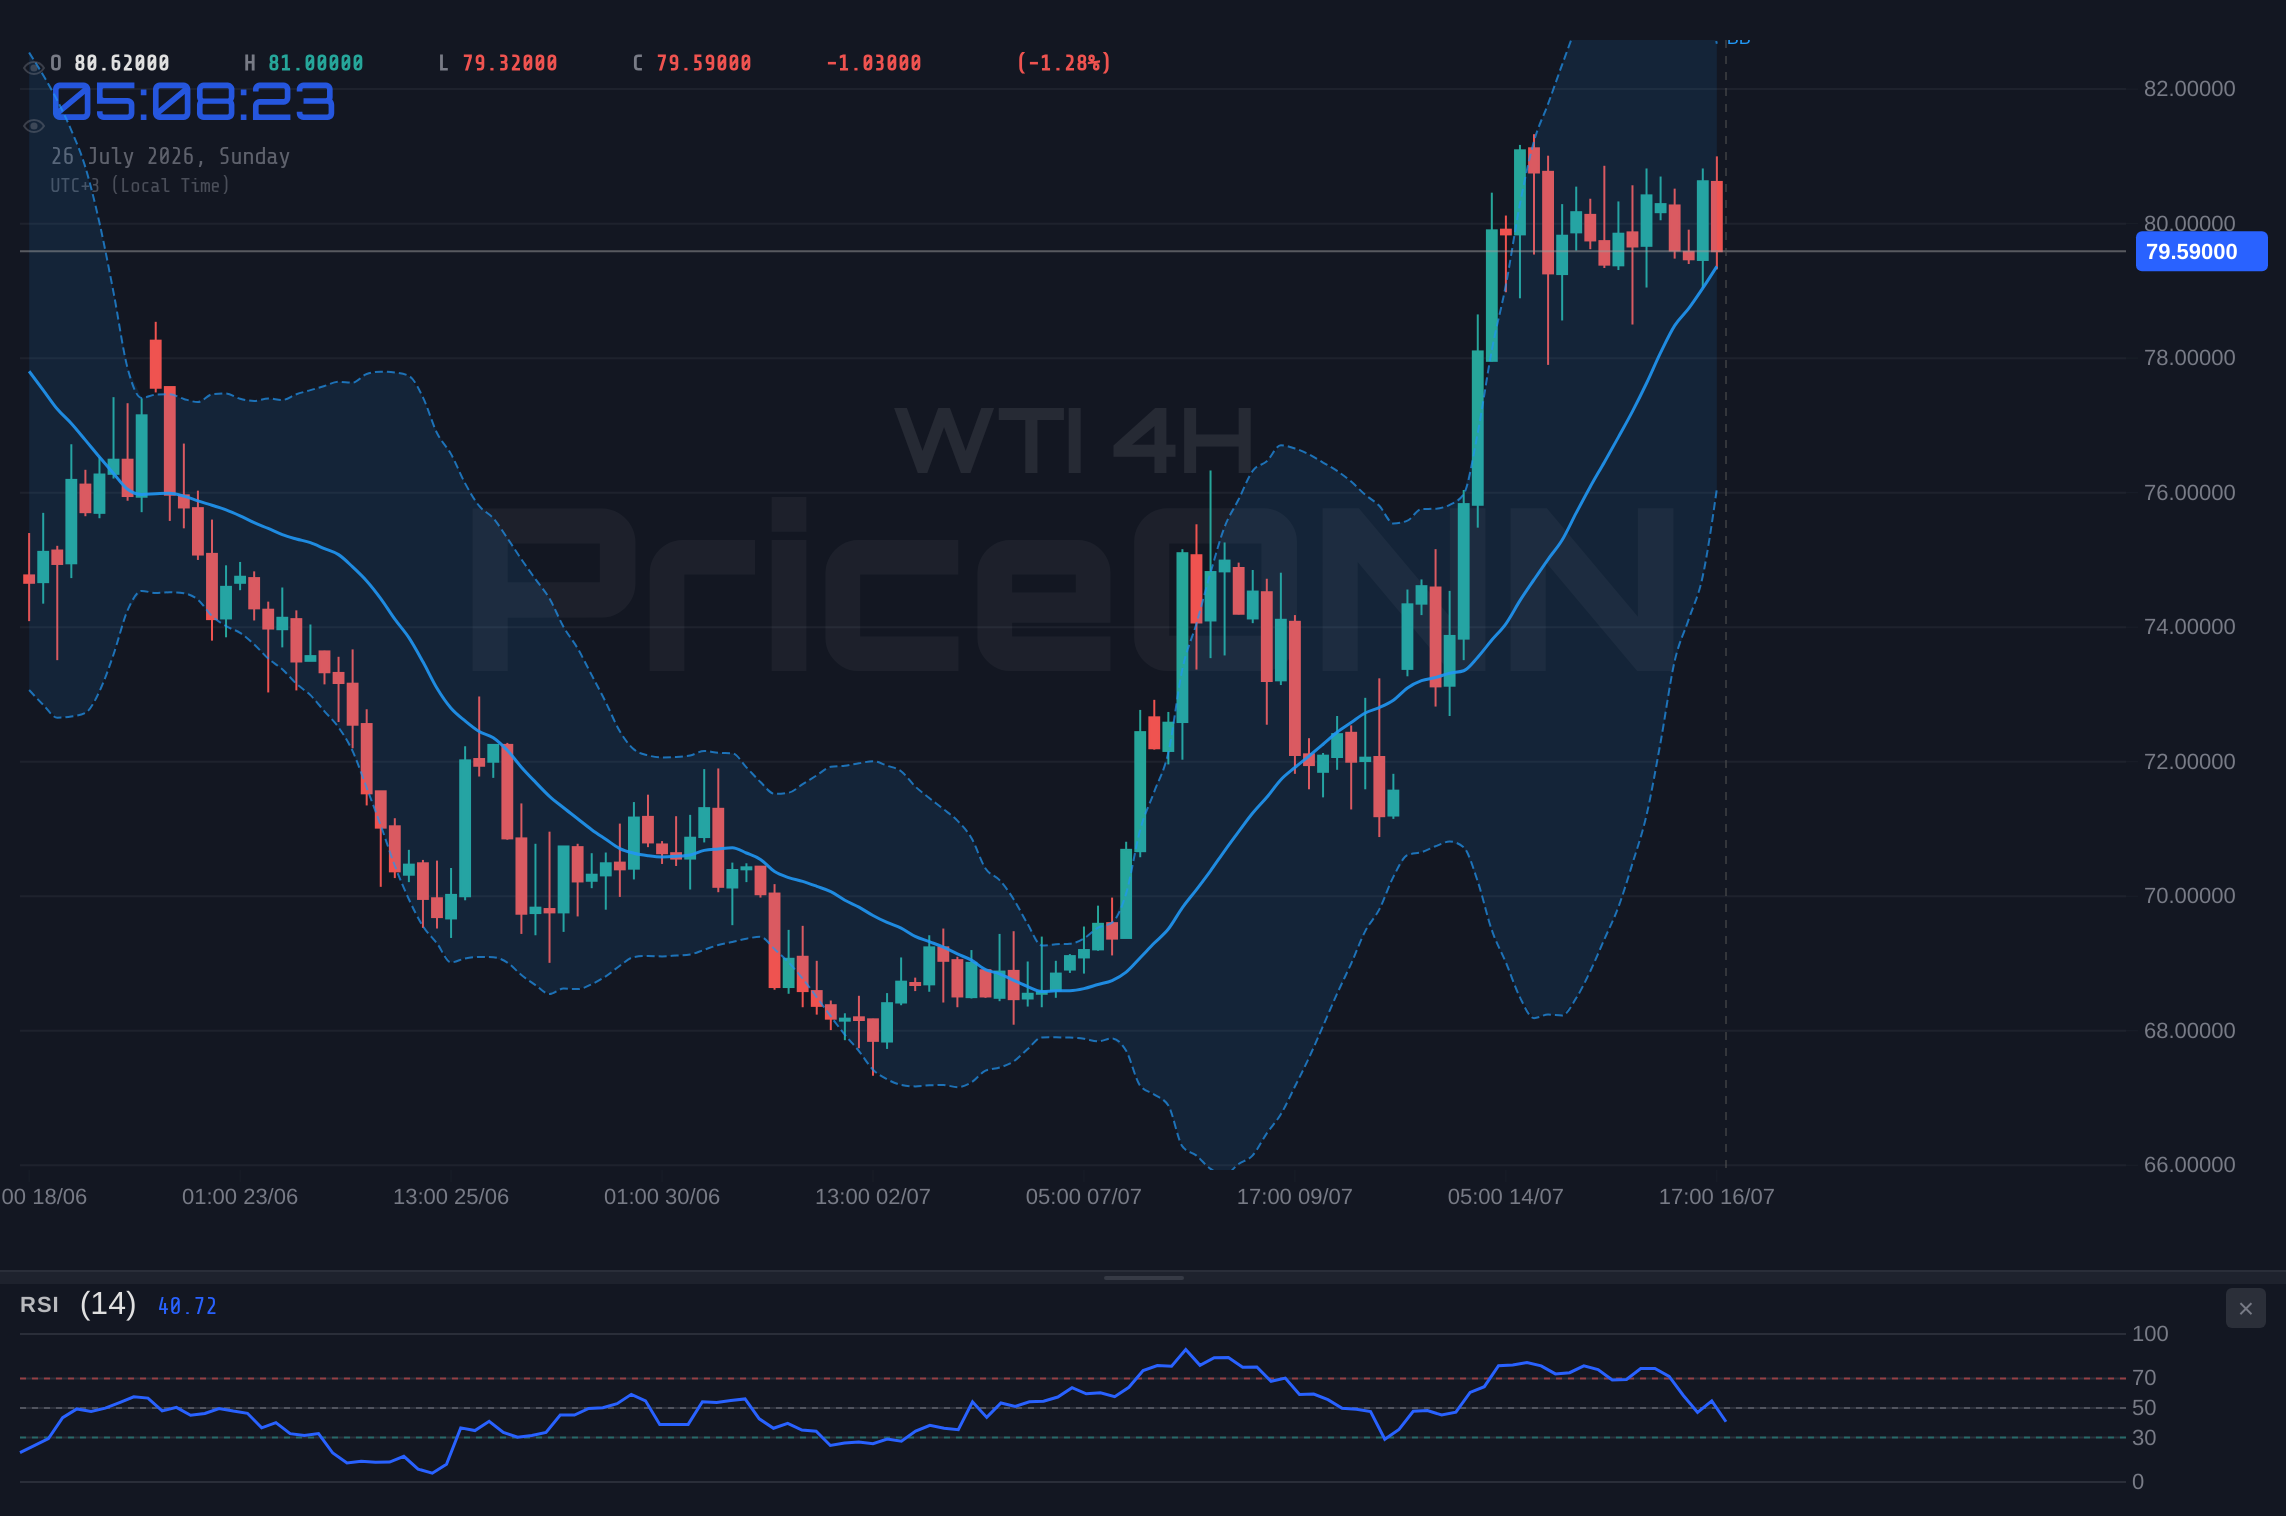
The broader energy market, represented by Brent crude trading around $83.79, mirrored WTI's choppy sentiment. This correlation is typical, as both benchmarks are heavily influenced by similar global supply and demand dynamics, as well as overarching macroeconomic trends. However, the slight premium Brent maintained throughout the week served as a subtle reminder of specific regional supply concerns that might be more acutely affecting European benchmarks. Understanding this interplay is crucial for grasping the nuanced movements within the oil complex.
Navigating this environment requires a keen eye on the confluence of technical signals and fundamental catalysts. The flat week, while seemingly uneventful, has set the stage for potential volatility. The key levels observed - $79.59 as the pivot, $78.97 as immediate support, and $80.17 as the initial resistance - will be critical watchpoints in the upcoming trading days. Any decisive breach of these zones could signal the beginning of a new trend, either a renewed push higher or a significant pullback.
The Bull Case: Supply Scarcity and Fed Pivot Hopes
The arguments for a continued bullish trend in WTI crude oil are multi-faceted, primarily revolving around persistent supply-side risks and the potential for a dovish pivot from the Federal Reserve. Geopolitical tensions in the Middle East remain a significant overhang. Recent news highlighted escalating US-Iran conflict fears, which historically have acted as a potent catalyst for oil price appreciation. Any further escalation or disruption to key export routes could rapidly tighten global supply, pushing WTI prices well above the current $79.59 level. The market's sensitivity to these events is palpable, with even minor flare-ups capable of triggering significant price spikes, as seen in past instances where prices surged towards the $84.00 and even $90.00 marks.
Furthermore, the supply side is not solely reliant on geopolitical events. OPEC+ has maintained a disciplined production stance, and reports from the group often signal a commitment to managing the market. While specific production quota adherence can fluctuate, the general sentiment from major producers has been geared towards supporting prices. This managed supply environment, combined with potential demand recovery narratives, creates a bullish fundamental backdrop. The 4H chart analysis, showing a strong uptrend (ADX: 30.49) and generally positive signals from Stochastic, supports the idea that underlying bullish momentum could reassert itself.
Another pillar of the bullish argument rests on the evolving Federal Reserve policy outlook. While recent data has shown resilience in the US economy, potentially leading to expectations of higher-for-longer interest rates, the market is always pricing in the possibility of a Fed pivot. Should inflation show signs of cooling more rapidly than anticipated, or if economic growth falters, the Fed might signal a shift towards rate cuts sooner rather than later. Such a move would typically weaken the US Dollar (DXY), which has shown a neutral stance around 100.7, and strengthen risk assets, including oil. The daily RSI at 53.65, while not overtly bullish, sits in a zone that could easily turn upwards with positive macro news.
The resilience of demand, despite higher prices and economic headwinds, also bolsters the bull case. Emerging markets continue to require energy, and seasonal demand patterns, particularly heading into cooler months in some regions, can provide a natural lift. While the current price of $79.59 might seem high in a vacuum, considering the supply constraints and potential for easier monetary policy, it could represent a launching pad for further gains rather than a peak. The bullish signals on the 1H Stochastic (K=28.74, D=52.74) and 1D Stochastic (K=89.73, D=76.8) suggest that, despite the current consolidation, upward momentum could be building.
Technically, the daily chart presents a compelling picture for bulls. The price is currently trading above the middle Bollinger Band, indicating a potentially constructive trend. The ADX at 29.46 signifies a strong trend is in place, and while the 1H chart shows a weak trend (ADX: 10.18), this often precedes a breakout. If WTI can decisively break above the $80.17 resistance, a move towards the $81.29 or even $81.94 levels could be on the cards. The daily RSI at 53.65 suggests room for upward movement before entering overbought territory.
The Bear Case: Fed Resolve, Inflation Fears, and Profit-Taking
Conversely, the bearish argument for WTI crude oil is anchored in the Federal Reserve's commitment to taming inflation, potential cracks in global economic growth, and the inherent cyclicality of commodity markets that often leads to profit-taking after significant rallies. The Fed's stance has been clear: inflation remains a primary concern, and interest rates will likely remain elevated until there is sustained evidence of price stability. Recent economic data, while mixed, has not conclusively pointed towards a sharp economic slowdown that would force the Fed's hand immediately. This hawkish narrative, if maintained, would support a stronger US Dollar (DXY at 100.7), thereby acting as a headwind for dollar-denominated commodities like WTI.
The persistent strength of the US Dollar is a significant concern for oil bulls. A rising DXY at 100.7 typically correlates with lower oil prices, as oil becomes more expensive for holders of other currencies. This inverse relationship is a fundamental factor that cannot be ignored. If the Fed continues to signal a 'higher for longer' rate policy, the dollar could find further strength, putting renewed pressure on WTI, potentially pushing it back towards the $78.97 support level and below.
Moreover, the specter of slowing global economic growth looms large. Major economies, including those in Europe and Asia, are grappling with their own inflationary pressures and the lagged effects of previous monetary tightening. A significant downturn in global manufacturing or consumer spending would directly impact oil demand, creating a bearish fundamental imbalance. While geopolitical risks can provide short-term price spikes, a sustained demand shock would ultimately overwhelm supply-side concerns. The current price of $79.59, viewed in the context of potential global economic cooling, might be unsustainable.
The technical indicators also present a mixed picture that leans bearish on certain timeframes. The 1H chart, for instance, shows a general sell signal (Al: 2, Sat: 6, Nötr: 0) and negative momentum on the MACD, suggesting immediate downward pressure. The RSI(14) at 49.74 on the 1H chart indicates a lack of bullish conviction. While the daily chart shows some bullish signals, the overall trend strength on the 1H (ADX: 10.18) and 4H (ADX: 11.13) charts is weak, indicating that the current price levels might be susceptible to a breakdown. Profit-taking after the recent run-up is also a natural market phenomenon, and a move back towards $79.04, the lower end of the daily range, is entirely plausible.
The Brent crude price at $83.79, sitting above WTI, also warrants attention. While this spread can be influenced by specific market dynamics, a widening gap could sometimes signal underlying weaknesses or shifts in regional demand/supply that might eventually impact WTI. If Brent were to face significant selling pressure, it could drag WTI down with it, especially if the broader market sentiment turns risk-averse. The daily chart's MACD showing negative momentum, despite the overall bullish trend signal, adds another layer of caution for the bulls.
Technical Crossroads: What the Charts Are Saying
The technical landscape for WTI crude oil at $79.59 is a study in contrasts, with indicators flashing mixed signals across different timeframes. This divergence is precisely what creates the current market tension, offering ammunition for both bullish and bearish arguments. Understanding these nuances is key to navigating the potential volatility ahead.
On the daily chart, the picture is cautiously optimistic for the bulls. The price is trading above the middle Bollinger Band, a sign of potential upward momentum. The ADX at 29.46 indicates a strong trend, and while the MACD shows negative momentum, it is currently above its signal line, suggesting a potential reversal or consolidation phase. The daily RSI at 53.65 is comfortably in neutral territory, with ample room to move higher before reaching overbought conditions. The Stochastic oscillator, with K at 89.73 and D at 76.8, is in overbought territory but showing a bullish crossover (K > D), which can sometimes precede further upside in a strong trend. However, this overbought condition also suggests a potential for pullback or consolidation.
The 4-hour timeframe paints a slightly different, yet still encouraging, picture for the bulls. The ADX at 11.13 signals a weak trend, implying that the current price action might be range-bound or consolidating before a larger move. The MACD is positive and above its signal line, supporting upward potential. The RSI at 58.47 is in neutral territory, leaning towards bullish. The Stochastic, however, is showing a bearish crossover (K
The 1-hour chart presents the most immediate bearish signals, reflecting the intraday choppiness. The ADX at 10.18 confirms a very weak trend, meaning intraday moves might lack conviction. The MACD is showing negative momentum, and the RSI at 49.74 is in neutral territory, lacking significant buying pressure. The Stochastic oscillator shows a bearish crossover (K
The conflict between the strong trend signals on the daily chart (ADX 29.46) and the weak trend signals on the intraday charts (ADX 10.18, 11.13) highlights the current market indecision. This suggests that while the longer-term underlying trend might be bullish, the immediate future is likely to be dictated by consolidation or a potential short-term pullback before any significant directional move. The key levels to watch remain $78.97 (support) and $80.17 (resistance). A decisive break above $80.17, especially on increasing volume, could trigger a move towards $81.29 (R2) and potentially higher. Conversely, a break below $78.97 could see prices test $78.63 (S2) and potentially challenge the $77.57 (S3) level.
The correlation with the DXY (Dollar Index), currently at 100.7, is also a critical factor. A rising DXY typically puts downward pressure on WTI. Currently, the DXY's 1H chart shows a bullish signal and overbought conditions, while the 4H and 1D charts show mixed signals. This ambiguity in the dollar's direction adds another layer of complexity to WTI's outlook. If the dollar strengthens further, it could cap any upside for oil, even if fundamental supply concerns remain.
Correlation Analysis: DXY, Equities, and the Fed Factor
Understanding the intricate web of correlations is paramount in deciphering WTI's price action. The interplay between oil prices, the US Dollar Index (DXY), major equity indices like the S&P 500 (SP500) and Nasdaq 100 (Nasdaq100), and the Federal Reserve's monetary policy stance forms the bedrock of macro-driven commodity trading.
The DXY, currently trading around 100.7, presents a mixed picture across timeframes. On the 1-hour chart, it shows bullish momentum and overbought conditions, suggesting potential dollar strength. However, the 4-hour and daily charts exhibit more neutral to bearish signals, indicating that the dollar's upward trajectory might be losing steam or facing headwinds. This ambiguity is crucial for WTI. A strengthening dollar typically exerts downward pressure on oil prices, making them more expensive for international buyers. Conversely, a weaker dollar tends to support oil prices. Given the DXY's current positioning, any sustained move above its immediate resistance could cap WTI's upside potential, while a retreat could provide a tailwind.
Equity markets offer another lens through which to view risk appetite, a key driver for commodities. The SP500, trading at 6572.87, and the Nasdaq 100, at 29164.86, both show conflicting signals across different timeframes. The SP500's daily chart indicates a downtrend with a weak ADX, despite a recent positive daily change. The Nasdaq 100, however, shows a stronger downtrend on its daily chart. This mixed equity performance suggests a cautious risk environment. In periods of risk aversion, investors often flee to safer assets, which can include the US Dollar and, to some extent, gold, while putting pressure on riskier commodities like oil. However, oil's unique position as an inflation hedge and its sensitivity to geopolitical supply shocks can sometimes cause it to decouple from broader equity market sentiment.
The Federal Reserve remains the central orchestrator of the macroeconomic narrative. While the market is currently pricing in a complex outlook for interest rates - with some expecting further hikes and others anticipating cuts later in the cycle - the Fed's ultimate goal of price stability remains paramount. Any indication from Fed officials regarding inflation persistence or economic resilience could bolster the dollar and weigh on oil prices. Conversely, signs of economic cooling or a dovish shift in rhetoric would likely weaken the dollar and potentially boost WTI. The upcoming FOMC meeting will be closely watched for any clues regarding the future path of monetary policy. The market's reaction to this anticipated Fed decision will be a critical factor in determining WTI's direction in the short to medium term.
The relationship between oil prices and inflation expectations is also noteworthy. As a key component of global inflation baskets, sustained high oil prices can complicate central banks' efforts to control price pressures. This dynamic creates a feedback loop: high oil prices can lead to tighter monetary policy, which can slow economic growth and, in turn, reduce oil demand, potentially capping prices. This delicate balance is currently being tested, with the market weighing the inflationary impact of potential supply disruptions against the dampening effects of restrictive monetary policy. The Brent crude price at $83.79, trading at a premium to WTI ($79.59), further complicates this picture, suggesting that specific supply concerns in other regions might be temporarily inflating benchmarks, but the overarching macro-economic forces will ultimately dictate the broader trend.
Economic Calendar and Geopolitical Watchlist
The upcoming week is laden with significant economic events and ongoing geopolitical developments that will undoubtedly influence WTI crude oil's price trajectory. Traders will be closely monitoring a range of data releases and central bank communications for signals that could break the current market indecision.
On the economic calendar front, the Federal Reserve's upcoming FOMC meeting is the most critical event. While a rate hike is unlikely, the accompanying statement and press conference will be scrutinized for any hints about the future path of monetary policy. Market participants will be looking for clues regarding the Fed's assessment of inflation and economic growth, which could significantly impact the US Dollar and, consequently, WTI. Recent news indicated that markets are repricing interest rate paths, with a focus on more US rate hikes. This suggests that any dovish signals from the Fed could be a strong catalyst for oil prices.
Beyond the Fed, other economic indicators will also play a role. Data releases related to inflation, employment, and manufacturing activity from major economies, including the US, Europe, and China, will provide insights into global demand trends. Stronger-than-expected data could support oil prices by signaling robust economic activity, while weaker figures might raise concerns about future demand, acting as a drag on WTI.
Geopolitically, the situation in the Middle East remains a paramount concern. Escalating tensions, particularly involving Iran, continue to pose a risk to global oil supply. Reports of potential disruptions to key export hubs or increased military posturing could trigger significant price spikes, as markets price in the risk premium. Traders will be closely following news from the region, as any adverse developments could quickly push WTI prices above the $80.17 resistance level.
The correlation between oil and the US Dollar remains a key theme. With the DXY showing mixed signals across timeframes, any significant move in the dollar will be closely watched. A strengthening dollar, potentially driven by hawkish Fed rhetoric or safe-haven flows, could cap oil's upside. Conversely, a weakening dollar, perhaps due to signs of economic fragility or a shift in Fed policy expectations, could provide a significant boost to WTI, potentially driving it towards the $81.29 resistance.
Furthermore, the broader market sentiment - whether risk-on or risk-off - will influence WTI's performance. In a risk-off environment, driven by geopolitical turmoil or economic uncertainty, investors tend to move away from commodities. However, oil's unique status as both an inflation hedge and a critical supply-chain component can sometimes lead to counter-intuitive price action. The interplay between these factors - Fed policy, economic data, geopolitical risks, dollar strength, and overall market sentiment - will be crucial in determining WTI's direction in the coming days.
The Verdict: Waiting for the Catalyst
The past week has been one of consolidation for WTI crude oil, with prices hovering around the $79.59 mark. This period of indecision reflects a market grappling with conflicting signals: supply-side risks and potential Fed easing hopes supporting prices, while inflation concerns and a potentially resilient dollar exert downward pressure. The technical picture is equally divided, with longer-term charts suggesting underlying strength while intraday indicators point to consolidation or a potential short-term pullback.
Looking ahead, WTI appears poised at a critical juncture. The $79.59 level is more than just a price point; it represents a battleground between the bulls and the bears. The key levels to watch are the immediate support at $78.97 and the resistance at $80.17. A decisive break above $80.17, fueled by escalating geopolitical tensions or a dovish Fed surprise, could open the door for a move towards $81.29 and beyond. Conversely, a failure to hold above $78.97, potentially driven by a hawkish Fed or signs of global economic slowdown, could lead to a test of lower support levels, including $78.63 and possibly $77.57.
The overarching narrative will likely be dominated by the Federal Reserve's policy outlook and the ongoing geopolitical situation in the Middle East. Any significant development on either front could provide the catalyst needed to break WTI out of its current range. Until then, expect continued volatility and a focus on these key levels. The weak trend signals on the intraday charts (ADX 10.18, 11.13) suggest that the market is waiting for a clear direction, and the next significant catalyst will likely dictate the trend for the coming weeks.
Bearish Scenario: Fed Holds Firm, Dollar Strengthens
60% ProbabilityNeutral Scenario: Consolidation Continues
25% ProbabilityBullish Scenario: Geopolitical Flare-up or Dovish Fed
15% ProbabilityFrequently Asked Questions: WTI Analysis
What happens if WTI breaks below the $78.97 support level?
A break below the $78.97 support level on WTI crude oil would likely trigger further selling, invalidating the bullish potential. This could lead to tests of the $78.63 and $77.57 levels, especially if accompanied by negative news regarding global demand or a hawkish Fed stance.
Should I buy WTI at current levels near $79.59 given the mixed signals?
Buying WTI at $79.59 requires caution due to mixed technical signals and market uncertainty. A high-probability setup would involve waiting for a confirmed breakout above $80.17 resistance or a clear bounce from the $78.97 support, ideally with confirmation from the DXY and equity markets. Risk management is paramount.
Is the ADX at 10.18 on the 1H chart a sell signal for WTI?
An ADX reading of 10.18 on the 1-hour chart indicates a very weak trend, not necessarily a sell signal. It suggests consolidation or a lack of directional conviction. While bearish momentum might be present, this low ADX reading implies the market is waiting for a significant catalyst to establish a stronger trend, either up or down.
How will the upcoming Fed meeting affect WTI crude oil around $79.59?
The upcoming Fed meeting is critical for WTI trading near $79.59. A hawkish tone suggesting prolonged higher rates would likely strengthen the dollar and pressure oil prices lower. Conversely, any dovish signals or hints of future rate cuts could weaken the dollar and provide a bullish catalyst for WTI, potentially pushing it towards resistance levels.
“Volatility creates opportunity - those prepared will be rewarded. Patience and discipline in navigating these choppy waters are key.”
Technical Outlook Summary
| Indicator | Value | Signal | Interpretation |
|---|---|---|---|
| RSI (14) | 53.65 | Neutral | Room for upward movement on daily chart. |
| MACD Histogram | -0.83 | Bearish | Negative momentum on 1H, but daily shows positive. |
| Stochastic | 89.73 / 76.8 | Bullish Crossover | Overbought on daily, potential for pullback. |
| ADX | 29.46 | Strong Trend | Indicates a strong trend, but direction needs confirmation. |
| Bollinger | Middle Band | Above | Price above middle band on daily suggests bullish bias. |
Key Levels
Time Horizon: This analysis is for short to medium-term trading.
Track markets in real-time
AI-powered analysis, technical indicators and real-time price data.
Join Our Telegram Channel
Breaking market news, AI analysis and trading signals instantly.
Join Channel