

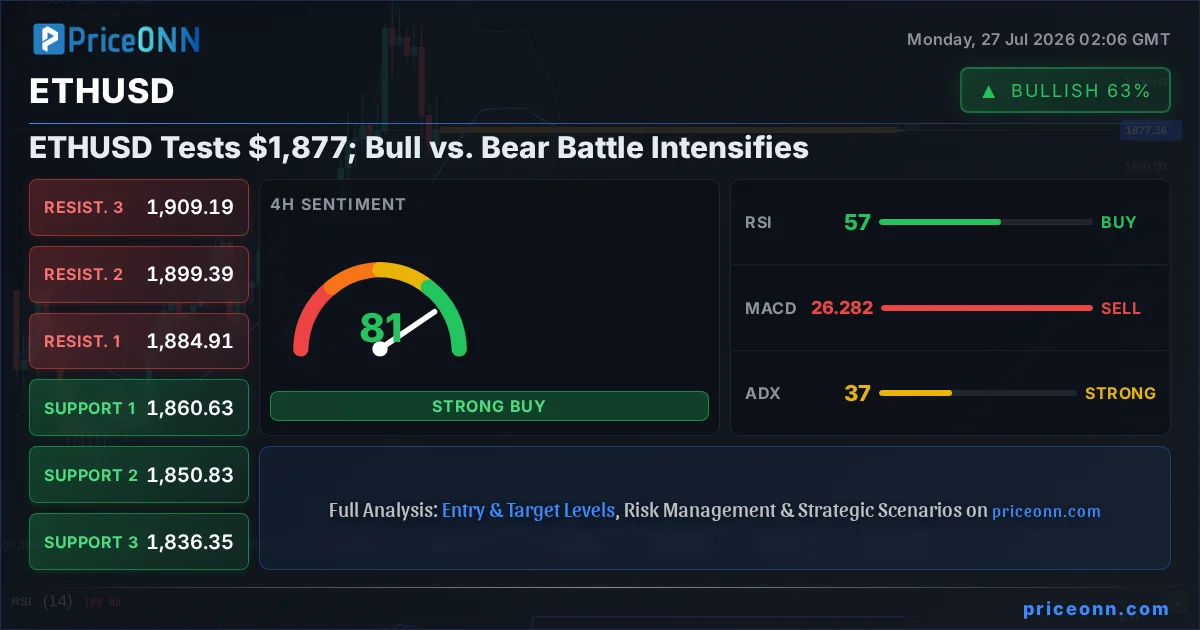
The cryptocurrency market is in a perpetual state of flux, and Ethereum's native token, ETHUSD, is currently at a critical juncture, trading around the $1,877.38 mark. This level represents a focal point where bulls and bears are locked in a fierce debate, each side presenting compelling arguments supported by technical indicators and broader market sentiment. As we navigate this complex landscape, understanding the nuances of the current price action and the underlying forces at play is paramount for any serious trader or investor looking to position themselves strategically. The ETHUSD today analysis reveals a market grappling with conflicting signals, demanding a closer look at what lies beneath the surface of this $1,877.38 price point.
- ETHUSD is currently trading at $1,877.38, a pivotal level where market sentiment is divided.
- On the daily timeframe, RSI stands at 59.95, indicating a neutral-to-bullish leaning, while MACD shows positive momentum.
- The 4-hour chart presents a more cautious picture with ADX at 37.06 suggesting a strong uptrend, yet Stochastic indicates a potential pullback.
- Key resistance is identified at $1,915.34, while crucial support lies at $1,874.22; a break of either could dictate the next major move.
- Correlation with DXY (currently at 100.7) suggests a strengthening dollar could pressure ETHUSD, while a risk-on sentiment in SP500 (at 6572.87) might support it.
The cryptocurrency market, particularly Ethereum's performance, is often seen as a barometer for broader risk appetite. Currently, with the DXY (Dollar Index) at 100.7, indicating dollar strength, we might expect headwinds for riskier assets like ETHUSD. However, the SP500 is trading at 6572.87, showing a positive daily change, suggesting that institutional investors are not entirely shying away from risk. This divergence in macro indicators immediately sets the stage for a bull vs. bear debate. The bulls see the strength in equities and the underlying bullish structure on longer timeframes as a sign of resilience, while bears point to dollar strength and potential overbought conditions on shorter timeframes as reasons for caution. This is the delicate balance we must dissect to understand the immediate future of ETHUSD.
The Bull Case: Resilience at $1,877.38
From a bullish perspective, the ETHUSD price action on the daily chart paints a picture of underlying strength, despite recent volatility. The current price of $1,877.38 is holding above significant support levels, including $1,874.22. The daily RSI(14) at 59.95, while not overtly bullish, sits comfortably in the neutral-to-bullish zone, suggesting there's still room for upward momentum without immediate overbought conditions. Furthermore, the MACD indicator on the daily timeframe is showing positive momentum, with the MACD line above its signal line. This technical alignment, even with a slightly weaker ADX at 22.66 indicating a moderate trend strength, implies that the broader upward trend established over recent weeks may still be intact. For the bulls, this consolidation around $1,877.38 is not a sign of weakness, but rather a healthy pause before the next leg higher. They are betting on the continuation of the established uptrend, viewing the current price as a strategic entry point before a potential move towards higher resistance levels.
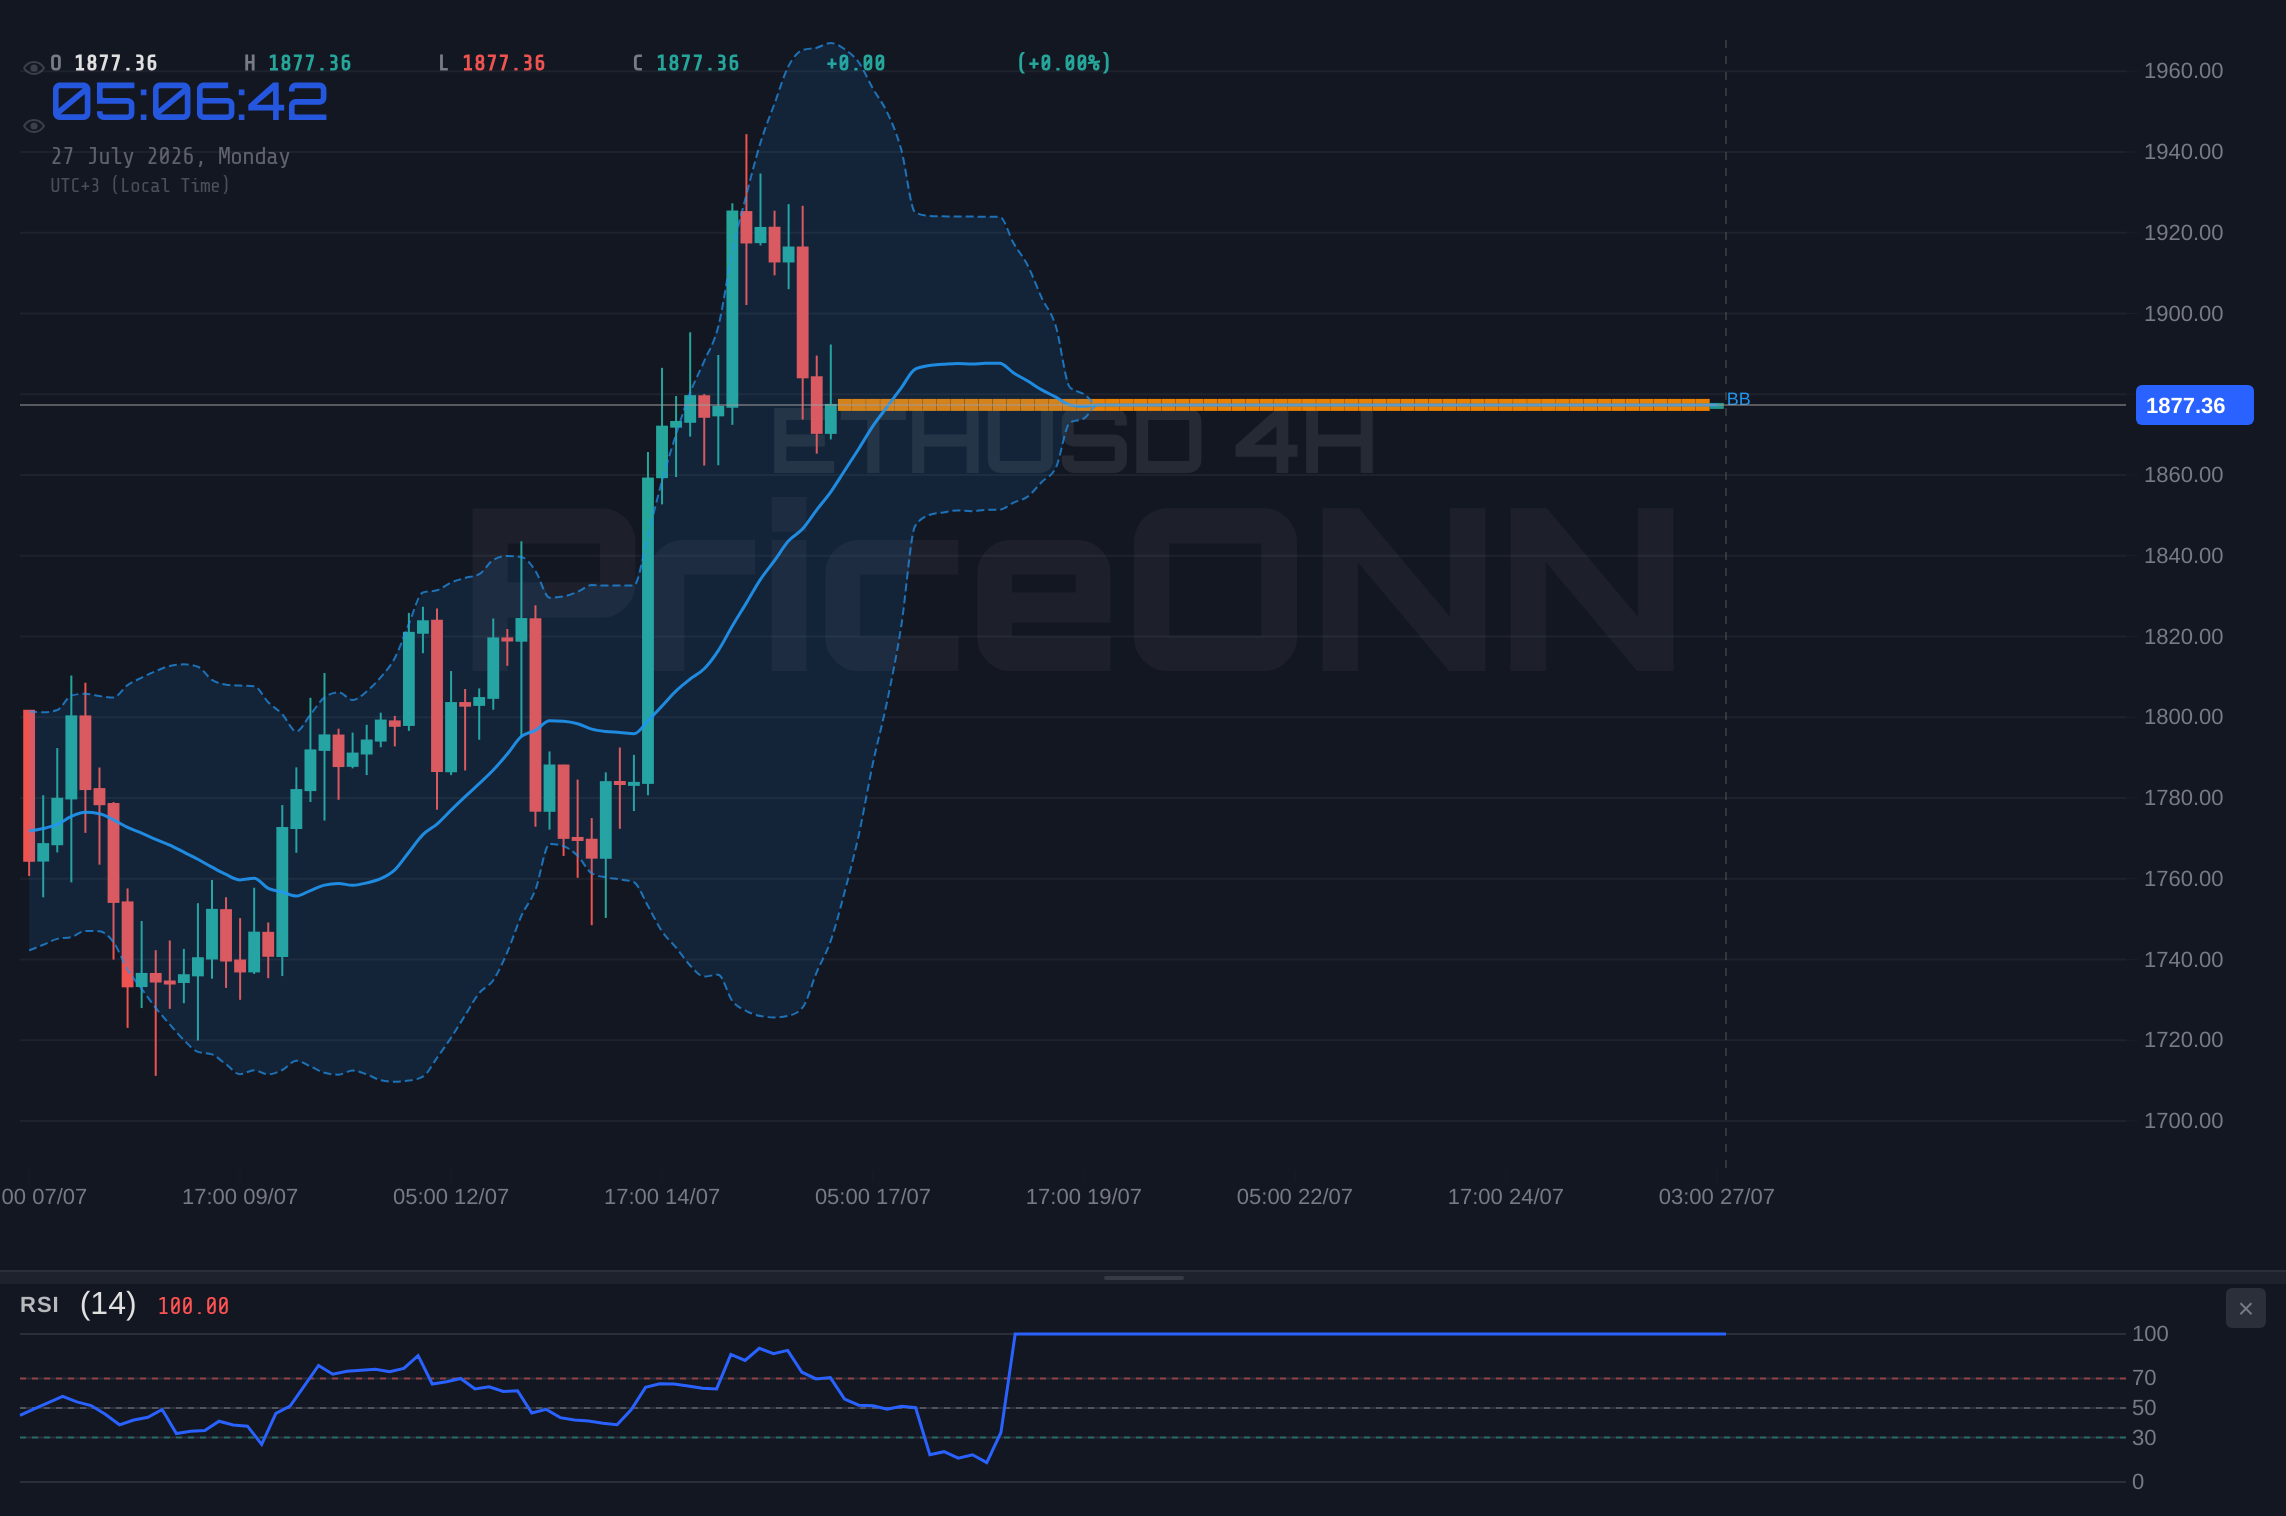
Digging deeper into the bullish argument, we observe the 4-hour timeframe for ETHUSD. Here, the trend is categorized as 'Yükseliş (Up)' with a strength of 94%, and the ADX is a robust 37.06, indicating a strong uptrend is in play. The RSI(14) at 56.88 remains in bullish territory, and the MACD is showing negative momentum, which could be interpreted as a brief pause rather than a reversal. The Stochastic indicator, however, shows K=18.24 and D=37.76, signaling a potential bearish crossover, which might temper the immediate bullish outlook. Despite this stochastic signal, the overall trend strength and the daily chart's positive MACD momentum provide a foundation for the bull case. Bulls are looking for a decisive break above the immediate resistance at $1,891.84, which would then target $1,903.83 and potentially the psychological $1,900 level. They believe that the market is simply consolidating gains, absorbing any selling pressure before resuming its upward trajectory, fueled by positive sentiment surrounding Ethereum's ecosystem developments, such as increasing DeFi TVL or upcoming network upgrades.
The narrative for the bulls is further bolstered by the broader crypto market context. While Bitcoin (BTCUSD) is trading around $64,629.65 with mixed signals across timeframes, its general stability or upward bias can provide a tailwind for Ethereum. The fact that ETHUSD is holding strong at $1,877.38, even with some headwinds from the DXY, suggests a degree of sector-specific strength. Institutional interest, often a precursor to significant price movements, remains a key factor. Any news regarding ETF inflows, staking yields improvements, or positive regulatory developments could act as catalysts, pushing ETHUSD higher. For instance, if there's a surge in active addresses or a significant whale accumulation pattern observed on-chain, it would lend further credence to the bullish thesis. The bulls are essentially betting that the fundamental strength and the established daily uptrend will eventually overcome short-term technical headwinds and macro pressures, pushing the price towards the higher support levels and eventually challenging the next resistance bands.
The 1-hour chart, while showing a 'Nötr (Neutral)' trend with 50% strength, still offers some bullish undertones. The RSI at 52.25 is neutral but trending upwards, and the MACD is positive, indicating buying pressure. The Stochastic is showing a bullish crossover (K=72.37, D=42.57), suggesting a short-term upward move might be on the cards. This aligns with the idea of a healthy consolidation before a larger move. Bulls might see this hourly setup as an opportunity to enter positions anticipating a bounce from the $1,877.38 level, targeting the immediate resistance at $1,891.84. The key here is that the price action remains above the crucial support at $1,868.34. As long as this level holds, the short-term outlook can be viewed with cautious optimism, with the potential for a test of higher price points. The bulls are keenly watching the volume accompanying any upward moves; a significant increase in trading volume on a break above resistance would be a strong confirmation signal.
The Bear Case: Caution at $1,877.38
On the other side of the spectrum, the bears present a compelling argument for caution, if not outright bearishness, for ETHUSD around the $1,877.38 level. The daily chart, despite its positive MACD, shows a weaker ADX of 22.66, indicating that the trend's strength might be waning. The RSI at 59.95, while not yet overbought, is approaching the upper threshold, suggesting that the upward momentum could be losing steam. More concerning for the bears is the 4-hour timeframe, which, despite its strong trend strength (ADX 37.06), shows a bearish Stochastic signal (K=18.24, D=37.76) and negative MACD momentum. This suggests a potential pullback is imminent. Bears are highlighting the current price of $1,877.38 as a potential rejection point, especially given the proximity of resistance levels like $1,891.84 and $1,903.83. They argue that the market might be overestimating the strength of the current uptrend, especially in the face of a strengthening DXY (at 100.7) and a somewhat shaky Nasdaq (down 1.16% today). The recent drop in XAUUSD to $4,001.21 and XAGUSD to $56.16 also indicates a broader risk-off sentiment in some commodity markets, which could spill over into crypto.
The 1-hour chart for ETHUSD offers further ammunition for the bears. While the MACD is positive, the overall trend is neutral, and the Stochastic indicator is showing a bullish crossover, which might be interpreted as a short-lived bounce before a further decline. The bears are particularly focused on the fact that the price is hovering below the mid-Bollinger Band on the 1-hour chart, a sign of potential downward pressure. They are watching for a decisive break below the immediate support at $1,868.34. A failure to hold this level could trigger a cascade of selling, targeting the next support at $1,856.83 and potentially lower. The bears believe that the market has become complacent, and any negative catalyst - be it a hawkish statement from the Fed, disappointing economic data, or a significant sell-off in traditional markets - could trigger a sharp correction. They are looking for signs of capitulation, increased selling volume, and a clear break of established support levels to confirm their bearish thesis.
The fundamental backdrop also lends support to the bearish argument. A strengthening US Dollar (DXY at 100.7) typically exerts downward pressure on dollar-denominated assets like ETHUSD, as it makes holding these assets more expensive for holders of other currencies. If the Federal Reserve signals a less dovish stance or maintains a hawkish tone regarding interest rates, this could further strengthen the dollar and dampen risk appetite. While the SP500 is currently showing upward movement, its own 1-hour chart indicates potential overbought conditions (RSI 70.95) and a bearish Stochastic signal, suggesting that the equity market might be due for a correction. This risk-off sentiment, if it materializes, would likely see capital flow out of cryptocurrencies and into safer assets, impacting ETHUSD negatively. Bears are also monitoring the crypto-specific narrative: any negative regulatory news, significant outflows from Ethereum staking, or a slowdown in DeFi growth could further exacerbate downward pressure on the price.
The longer-term daily chart, while showing positive MACD momentum, also presents warning signs for the bears. The ADX at 22.66 is not indicative of a strong, sustained trend, suggesting that the current upward move might be more of a correction within a larger downtrend or a period of consolidation. The Stochastic indicator on the daily chart, with K=26.18 and D=44.73, shows a bearish signal, reinforcing the idea that the upside momentum may be fading. Bears are looking for a daily close below $1,874.22, which would confirm a bearish bias and open the door for a more significant decline towards the next support levels. They believe that the market is currently in a 'melt-up' phase or a bear market rally, and that fundamental economic pressures and a potential shift in central bank policy will eventually lead to a more substantial price correction for ETHUSD.
The Technical Verdict: A Tightrope Walk at $1,877.38
The technical indicators for ETHUSD present a classic case of conflicting signals, reflecting the current market tension around the $1,877.38 level. On the daily chart, the MACD's positive momentum and RSI above 50 suggest a bullish bias, but the Stochastic's bearish signal and the moderate ADX value (22.66) temper this optimism. The 4-hour chart shows a strong uptrend (ADX 37.06), but the bearish Stochastic is a significant warning. The 1-hour chart is more mixed, with a neutral trend and conflicting Stochastic signals. This confluence of indicators suggests that neither bulls nor bears have a clear upper hand at this moment. The price action is essentially stuck in a battleground, with short-term signals leaning towards caution while longer-term trends still hold some bullish promise.
The key to deciphering this technical stalemate lies in observing how ETHUSD reacts to immediate support and resistance levels. The critical support level to watch on the downside is $1,874.22. A sustained break below this level, confirmed by increased selling volume and bearish closes on shorter timeframes, would likely invalidate the bullish narrative and open the door for a move towards $1,856.83. On the upside, bulls need to see a decisive close above $1,891.84. This would confirm the strength of the 4-hour uptrend and potentially target the $1,903.83 resistance. However, even a break above this level might not guarantee a sustained rally, given the mixed signals from indicators like the daily Stochastic and the overall macro environment influenced by the DXY at 100.7.
The correlation with traditional markets adds another layer of complexity. The strengthening DXY at 100.7 presents a headwind for ETHUSD, as a stronger dollar typically reduces the appeal of dollar-denominated risk assets. Conversely, the positive movement in the SP500 (at 6572.87) suggests a degree of risk-on sentiment that could benefit ETHUSD. However, the Nasdaq's 1-hour chart shows RSI at 70.95, hinting at potential overbought conditions, which could lead to a broader market pullback. If risk aversion takes hold, ETHUSD could face significant selling pressure, regardless of its own internal technical setup. Bears will be looking for this macro-driven sell-off to confirm their thesis, while bulls will hope that Ethereum's ecosystem developments can provide a degree of insulation.
Given the conflicting signals across different timeframes and the mixed macro environment, ETHUSD appears to be in a 'watch zone'. The immediate price action around $1,877.38 is crucial. A failure to hold this level could lead to a sharp decline, while a successful defense and subsequent break above $1,891.84 could signal a resumption of the bullish trend. However, the mixed indicator readings, particularly the bearish Stochastic signals on the 4-hour and daily charts, suggest that any upside move might be met with immediate resistance and potential profit-taking. The ADX values also paint a picture of a market that is either consolidating or in a trend that is losing conviction, depending on the timeframe. This suggests that traders should exercise caution and wait for clearer signals before committing to significant positions.
Trade Scenarios for ETHUSD
Bearish Reversal: The Downside Risk
40% ProbabilityConsolidation Phase: The Waiting Game
35% ProbabilityBullish Continuation: Breaking Higher
25% ProbabilityFrequently Asked Questions: ETHUSD Analysis
What happens if ETHUSD breaks below $1,874.22 support?
A confirmed daily close below $1,874.22 would invalidate the current bullish structure and likely trigger further downside. Bears would target $1,856.83 and potentially $1,844.84, especially if selling volume increases significantly.
Should I buy ETHUSD at current levels around $1,877.38 given the mixed signals?
Caution is advised. While the daily trend is still somewhat bullish, the conflicting signals on shorter timeframes and the strong DXY at 100.7 suggest waiting for a clearer setup. A confirmed break above $1,891.84 or a hold of $1,874.22 with subsequent bounce would offer a more defined entry point.
Is the RSI at 59.95 a sell signal for ETHUSD right now?
An RSI of 59.95 on the daily chart is not an immediate sell signal; it indicates a neutral-to-bullish sentiment with room for further upside. However, it suggests that the market is not oversold, and any upward momentum could face resistance as it approaches the 70+ territory.
How will the current DXY level of 100.7 affect ETHUSD this week?
A DXY at 100.7 suggests a relatively strong dollar, which typically acts as a headwind for risk assets like ETHUSD. If the dollar continues to strengthen, it could put downward pressure on ETHUSD, potentially leading to a retest of support levels around $1,874.22.
The market is a complex interplay of technical signals, macroeconomic forces, and investor sentiment. For ETHUSD around $1,877.38, the current picture is one of indecision. While longer-term trends hint at potential upside, shorter-term indicators and macro factors demand caution. Patience and disciplined risk management are key. Waiting for a clear break above resistance or a confirmed hold of support will be crucial for navigating these choppy waters. The market always provides opportunities; the key is to wait for the right setup and manage risk effectively.
Track markets in real-time
AI-powered analysis, technical indicators and real-time price data.
Join Our Telegram Channel
Breaking market news, AI analysis and trading signals instantly.
Join Channel