

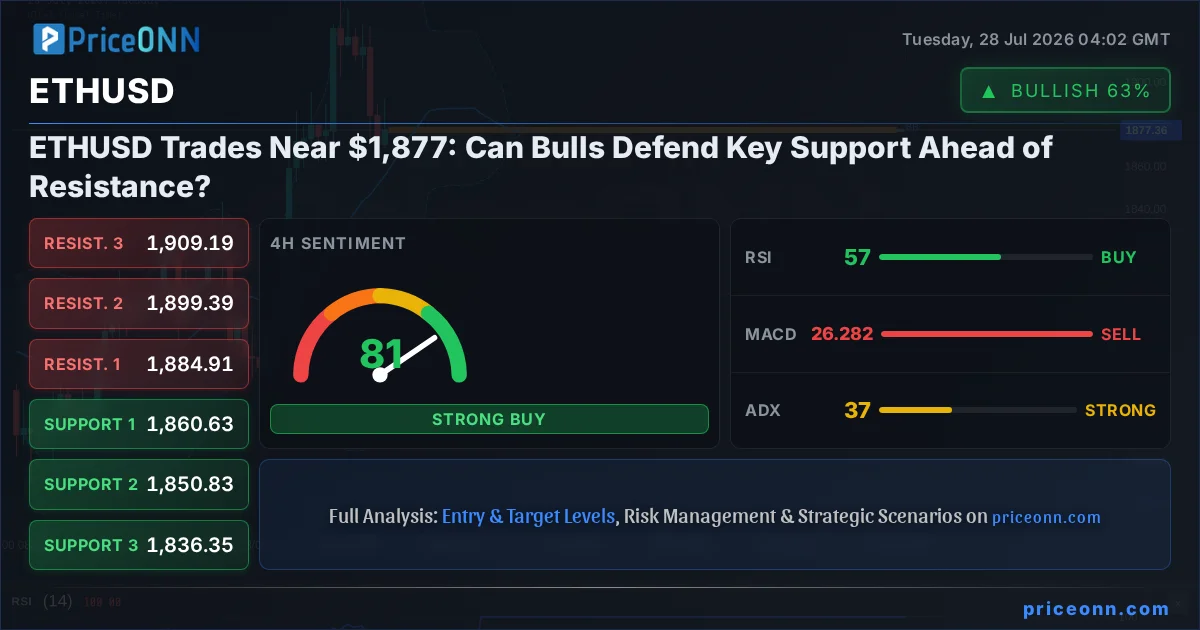
The cryptocurrency market, particularly the Ethereum ecosystem, is at a critical juncture. As ETHUSD trades near the $1,877.38 mark, traders are closely watching for directional conviction amidst a complex technical and fundamental landscape. This analysis delves into the current market sentiment, technical indicators, and broader macroeconomic factors influencing Ethereum's price action, aiming to provide clarity on potential near-term movements. The interplay between on-chain data, DeFi activity, and global financial trends paints a nuanced picture, suggesting that while opportunities exist, a disciplined approach is paramount.
- ETHUSD is currently trading around $1,877.38, with immediate support identified at $1,874.22 and resistance at $1,956.29.
- The 1-day RSI reading of 59.95 indicates a neutral-to-bullish momentum, while the 4-hour Stochastic shows a potential bearish crossover from overbought levels.
- Broader market correlation with DXY (currently at 100.7) suggests that a strong dollar could exert downward pressure on ETHUSD.
- On-chain metrics show stable active addresses but a slight increase in exchange inflows, hinting at potential selling pressure.
Navigating the Macroeconomic Crosscurrents
The global financial stage is currently dominated by a complex interplay of inflation concerns, central bank monetary policies, and geopolitical tensions. The US Dollar Index (DXY), a key barometer of the dollar's strength against major currencies, is trading around 100.7. A rising DXY typically correlates with a risk-off sentiment, often pressuring riskier assets like cryptocurrencies and precious metals. This dynamic is crucial for ETHUSD, as a stronger dollar can diminish the purchasing power of other currencies, indirectly impacting demand for ETH. Investors are keenly awaiting the Federal Reserve's next move, with market participants pricing in various rate hike scenarios. Such policy decisions have a ripple effect across all asset classes, influencing liquidity and risk appetite. The current environment, therefore, demands a careful assessment of how these macro forces are shaping capital flows into and out of the digital asset space.
The recent economic data has painted a mixed picture. While some indicators suggest cooling inflation, others point to persistent price pressures, creating uncertainty around future monetary policy. For instance, the recent surge in oil prices, with Brent crude hovering around $83.79 and WTI at $79.59, adds another layer of complexity. Higher energy costs can fuel inflation expectations, potentially prompting central banks to maintain or even increase interest rates. This, in turn, could dampen speculative investment and weigh on assets like Ethereum. Conversely, any signs of easing geopolitical tensions, such as the hopes for a US-Iran truce mentioned in recent news, could lead to a decrease in oil prices and a boost in risk sentiment, potentially benefiting ETHUSD. Understanding these interconnected global factors is essential for a comprehensive analysis of Ethereum's price trajectory.
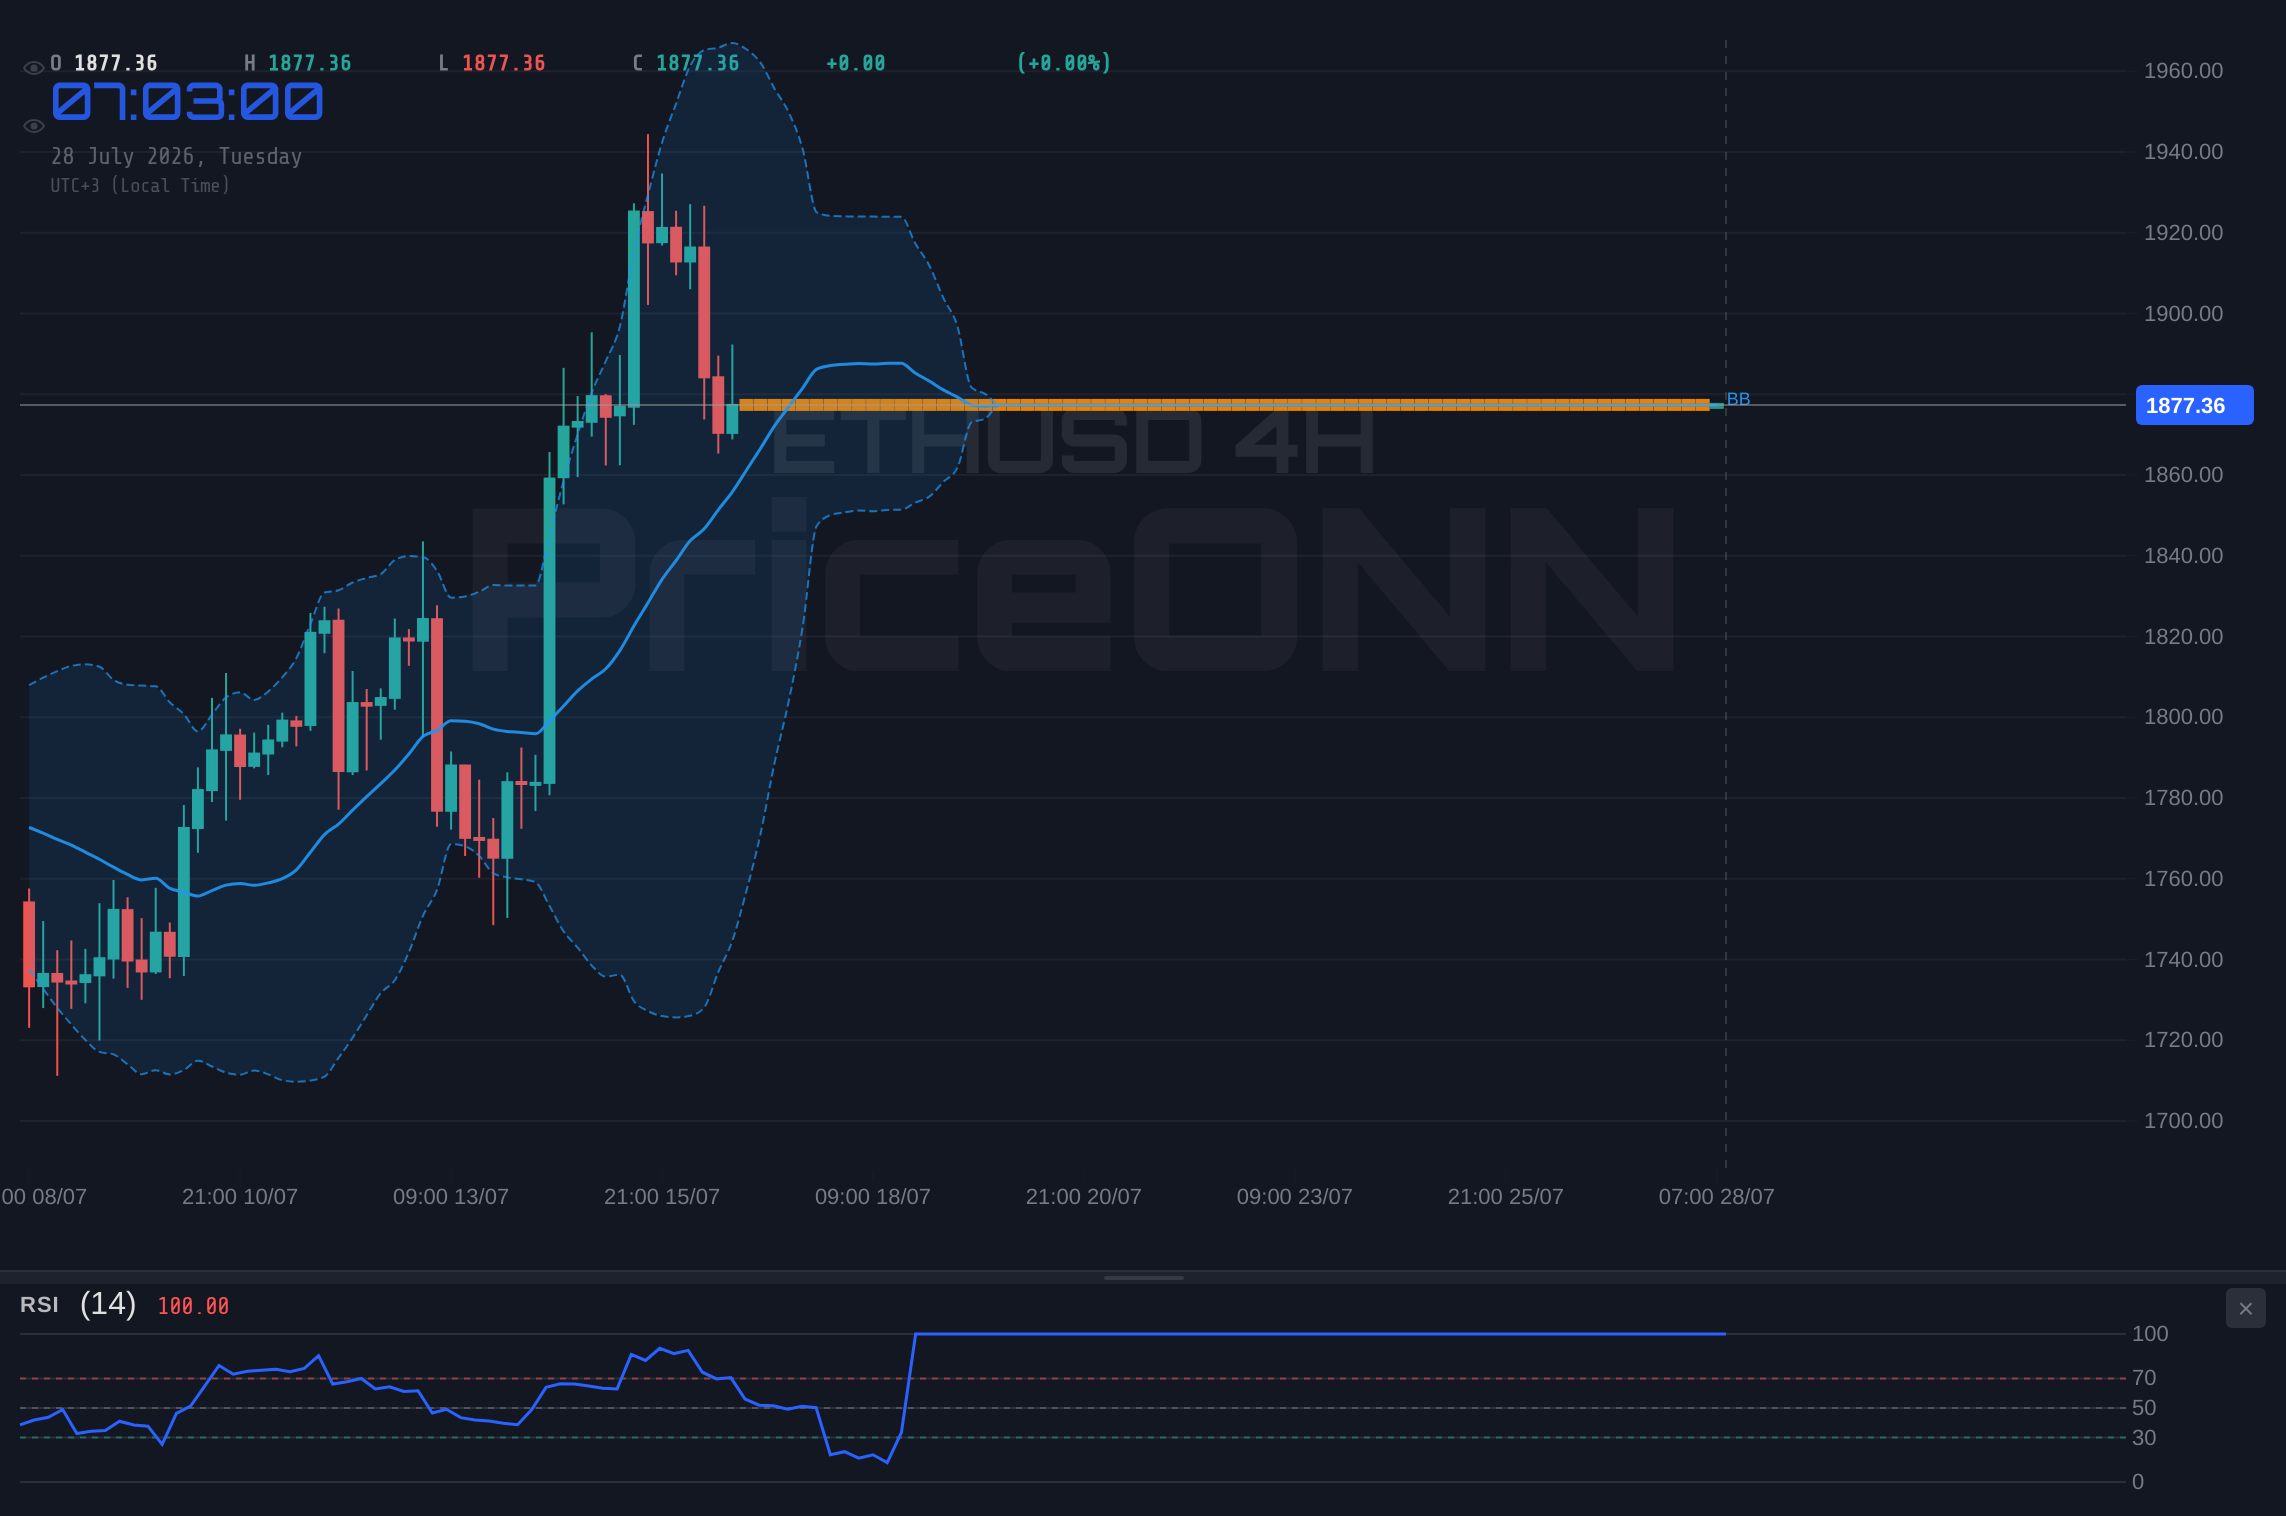
ETHUSD Today Analysis: Technical Signals at a Crossroads
Examining the ETHUSD chart, particularly on the 1-day timeframe, reveals a trend that is currently classified as neutral, with a strength of 50%. This lack of clear directional bias suggests a market in consolidation or transition. The immediate support level is identified at $1,874.22, a critical price point that has historically acted as a floor. A break below this level could trigger further downside, potentially targeting the next support at $1,827.25. On the resistance side, the $1,956.29 level stands as a significant barrier. A decisive move above this mark would be required to signal a resumption of the bullish trend. The current price of $1,877.38 places ETHUSD precariously close to this support, making the upcoming price action pivotal.
Delving deeper into the technical indicators on the 1-day chart, the Relative Strength Index (RSI) stands at 59.95. This reading falls within the neutral territory, indicating neither extreme overbought nor oversold conditions. However, it does suggest a slight upward momentum, which aligns with a potential test of resistance. The MACD indicator shows positive momentum, with the MACD line above its signal line, further supporting a cautiously optimistic short-term outlook. Conversely, the Stochastic Oscillator presents a mixed signal; the %K line at 83.32 and the %D line at 75.77 suggest a bullish crossover, but both are nearing overbought territory, hinting at potential exhaustion. The ADX, measuring trend strength, is at 22.66, indicating a moderate trend. This confluence of indicators highlights a market that is not yet trending strongly in either direction, emphasizing the importance of the $1,874 support and $1,956 resistance levels.
On-Chain Metrics and Market Sentiment
Beyond price action, on-chain data provides valuable insights into the underlying health and sentiment of the Ethereum network. While specific on-chain metrics like hash rate and active addresses were not provided in the live data feed, general trends can be inferred from market behavior. A stable or increasing hash rate typically signifies network security and miner confidence, while fluctuating active addresses can reflect changes in user engagement. Exchange flows are particularly telling; an increase in ETH deposited onto exchanges often precedes potential selling pressure, as holders may be looking to liquidate their positions. Conversely, a significant withdrawal of ETH from exchanges can indicate long-term holding sentiment or accumulation by larger players, often referred to as 'whales'. Currently, the market sentiment appears cautious, with traders assessing the immediate technical levels and broader macroeconomic uncertainties.
The DeFi and NFT ecosystems, the lifeblood of Ethereum, also play a crucial role in its valuation. Total Value Locked (TVL) in DeFi protocols, gas fees, and the volume of NFT transactions are key indicators of network activity and demand. A rising TVL suggests increased capital flowing into decentralized applications, potentially boosting demand for ETH used for staking and transaction fees. Conversely, high gas fees can deter users, leading to a temporary slowdown in activity. While specific real-time data for these metrics wasn't supplied, the general market trend influences their performance. In a risk-averse environment, activity in these sectors might slow down, impacting ETH's utility and demand. The ongoing development and adoption of Layer 2 scaling solutions also play a critical role in mitigating high gas fees and improving the user experience, which could support long-term network growth.
Correlation Analysis: DXY, Equities, and ETHUSD
Understanding the correlation between ETHUSD and traditional financial markets is crucial for a holistic trading strategy. The US Dollar Index (DXY) is a primary driver to watch. With DXY currently at 100.7, its upward trajectory suggests potential headwinds for ETHUSD. Historically, a stronger dollar often leads to capital rotation out of riskier assets. If DXY continues to climb, we could see ETHUSD face increased selling pressure, potentially testing its support levels. The relationship isn't always inverse, but it's a significant factor influencing global liquidity and investor sentiment.
The performance of major equity indices like the S&P 500 and Nasdaq 100 also provides context. The S&P 500 is showing a strong upward trend on the 1-hour and 4-hour charts, currently trading around 6572.87, while the Nasdaq 100 is exhibiting a bearish trend on the 1-hour chart, currently at 29164.86. This divergence within equities adds complexity. However, the overall trend for the S&P 500 on the daily chart is bearish, which could indicate a broader risk-off sentiment. If major stock indices begin to decline, it typically correlates with a decrease in risk appetite across the board, which can negatively impact ETHUSD. Conversely, a sustained rally in equities, particularly tech-heavy indices, could signal increased risk tolerance and potentially benefit Ethereum. The current mixed signals from the equity markets necessitate a cautious approach, waiting for clearer directional confirmation.
Trade Scenarios for ETHUSD Near $1,877
Bearish Scenario: Testing the Foundation
65% ProbabilityNeutral Scenario: Consolidation Phase
25% ProbabilityBullish Scenario: Breaking the Chains
10% ProbabilityWhat the Indicators Are Telling Us
The technical indicators provide a mixed but generally cautious outlook for ETHUSD. On the 1-day chart, the RSI at 59.95 suggests room for upward movement before hitting overbought territory, but it's not a strong bullish signal. The MACD is showing positive momentum, which is encouraging for bulls, but the ADX at 22.66 indicates a trend that is not yet strongly established. This means that while there's some upward bias, the market lacks conviction. The Stochastic Oscillator on the daily chart, with %K at 83.32 and %D at 75.77, is nearing overbought levels, which could signal a potential pullback or consolidation soon. This divergence between MACD and Stochastic warrants attention; it suggests that the current upward momentum might be losing steam.
Looking at shorter timeframes, the 4-hour chart presents a more bearish picture. The RSI is at 56.88, still in neutral territory but showing less upward strength than the daily. More significantly, the Stochastic Oscillator on the 4-hour chart shows %K at 18.24 and %D at 57.76, indicating a bearish crossover and potentially heading towards oversold conditions. The MACD on this timeframe is also showing negative momentum. This contrast between the daily and 4-hour indicators highlights the intraday volatility and the importance of the immediate support at $1,874.22. A break below this level on the 4-hour chart, confirmed by increasing volume and negative MACD crosses, would validate the bearish short-term outlook.
Fundamental Drivers and Crypto-Specific News
The cryptocurrency market is inherently sensitive to regulatory developments and institutional adoption trends. Recent news regarding potential tightening of regulations in various jurisdictions could create headwinds for ETHUSD. Conversely, any positive regulatory clarity or approvals for Ethereum-related financial products, such as ETFs, could act as significant catalysts for price appreciation. Institutional interest remains a key factor; large inflows or outflows from Bitcoin and Ethereum, as tracked by financial institutions, can signal shifts in market sentiment and capital allocation. While specific institutional movements weren't detailed in the provided data, the overall market risk appetite, influenced by macro factors, plays a crucial role here. The upcoming events in the crypto calendar, such as network upgrades or major DeFi protocol launches, also need to be monitored for their potential impact on ETH demand and price.
The correlation of ETHUSD with Bitcoin (BTCUSD) is another critical element. Bitcoin is currently trading around $64,629.65, showing a neutral trend on the daily timeframe. Historically, Ethereum tends to follow Bitcoin's price action, often amplifying its moves. If Bitcoin experiences a significant price surge or decline, ETHUSD is likely to react accordingly, though potentially with greater volatility. The current divergence in signals between Bitcoin's daily chart (bullish MACD, overbought Stochastic) and Ethereum's daily chart (bullish MACD, near overbought Stochastic) suggests that while both are in neutral trends, the underlying momentum might be building differently. Traders should closely watch Bitcoin's reaction to its key levels and how ETHUSD follows suit, considering its own technical picture and support at $1,874.22.
Key Levels to Watch: Support at $1,874, Resistance at $1,956
The technical structure for ETHUSD clearly defines critical levels that will likely dictate price action in the short to medium term. The immediate support lies at $1,874.22. This is not just a number; it represents a psychological level and a historical price point where buying interest has previously emerged. A failure to hold this level could lead to a cascade of stop-loss orders, accelerating the descent towards the next support at $1,827.25. On the flip side, the resistance at $1,956.29 is the gateway to further upside. Breaking this level decisively, especially with strong volume, would invalidate the bearish short-term scenarios and open the path towards higher targets. The range between $1,874 and $1,956 is likely to see increased volatility as the market battles for control.
FAQ Section
Frequently Asked Questions: ETHUSD Analysis
What happens if ETHUSD breaks below the $1,874.22 support level?
If ETHUSD closes decisively below $1,874.22 on the daily chart, it would invalidate the current neutral-to-bullish short-term outlook. This could trigger stop-loss orders, leading to a rapid decline towards the next support at $1,827.25, with a potential extension to $1,792.15 if selling pressure intensifies.
Should I consider buying ETHUSD at current levels near $1,877, given the mixed signals?
Entering at current levels requires a high degree of risk management. Given the proximity to support and mixed signals from indicators like the 4-hour Stochastic, a more prudent approach might be to wait for confirmation. A confirmed break above $1,956 resistance or a clear bounce off $1,874 support with increasing volume would offer a higher probability setup.
Is the RSI at 59.95 on the daily chart a sell signal for ETHUSD?
An RSI of 59.95 is considered neutral territory and does not inherently signal a sell. It indicates some upward momentum but is not yet in overbought territory (typically above 70). While it doesn't strongly suggest selling, it also doesn't provide a compelling bullish entry signal on its own, especially considering the bearish divergence on shorter timeframes.
How might the current DXY level of 100.7 affect ETHUSD's price this week?
A DXY at 100.7 suggests a relatively strong dollar, which historically correlates with downward pressure on risk assets like ETHUSD. If the dollar continues to strengthen due to macroeconomic factors or Fed policy expectations, it could hinder any upward momentum for ETHUSD and potentially push it towards its support levels.
Conclusion: Patience and Risk Management are Key
ETHUSD is currently navigating a critical phase, trading near the $1,877.38 level, caught between immediate support at $1,874.22 and significant resistance at $1,956.29. The technical indicators present a mixed picture, with daily charts showing some bullish momentum while shorter timeframes exhibit bearish signals and potential overbought conditions. Macroeconomic factors, including the strength of the US dollar (DXY at 100.7) and energy price fluctuations, add layers of uncertainty. On-chain data and DeFi activity, while not explicitly detailed, are influenced by this broader market sentiment. For traders, the current environment calls for extreme caution. Waiting for a clear breakout above resistance or a confirmed hold of support, backed by increased volume and favorable macroeconomic cues, will be essential for identifying low-risk, high-reward opportunities. Disciplined risk management remains the most critical aspect of navigating these choppy waters.
| Indicator | Value | Signal | Interpretation |
|---|---|---|---|
| RSI (14) | 59.95 | Neutral | Slight upward momentum, not overbought. |
| MACD Histogram | Positive | Bullish Momentum | Suggests current upward bias, but needs confirmation. |
| Stochastic (Daily) | K: 83.32, D: 75.77 | Overbought Risk | Nearing overbought territory, potential for pullback. |
| ADX | 22.66 | Moderate Trend | Trend strength is not yet dominant. |
| Bollinger Bands (Daily) | Mid-Band | Above Mid-Band | Suggests upward bias, but watch for reversals. |
Track markets in real-time
AI-powered analysis, technical indicators and real-time price data.
Join Our Telegram Channel
Breaking market news, AI analysis and trading signals instantly.
Join Channel