

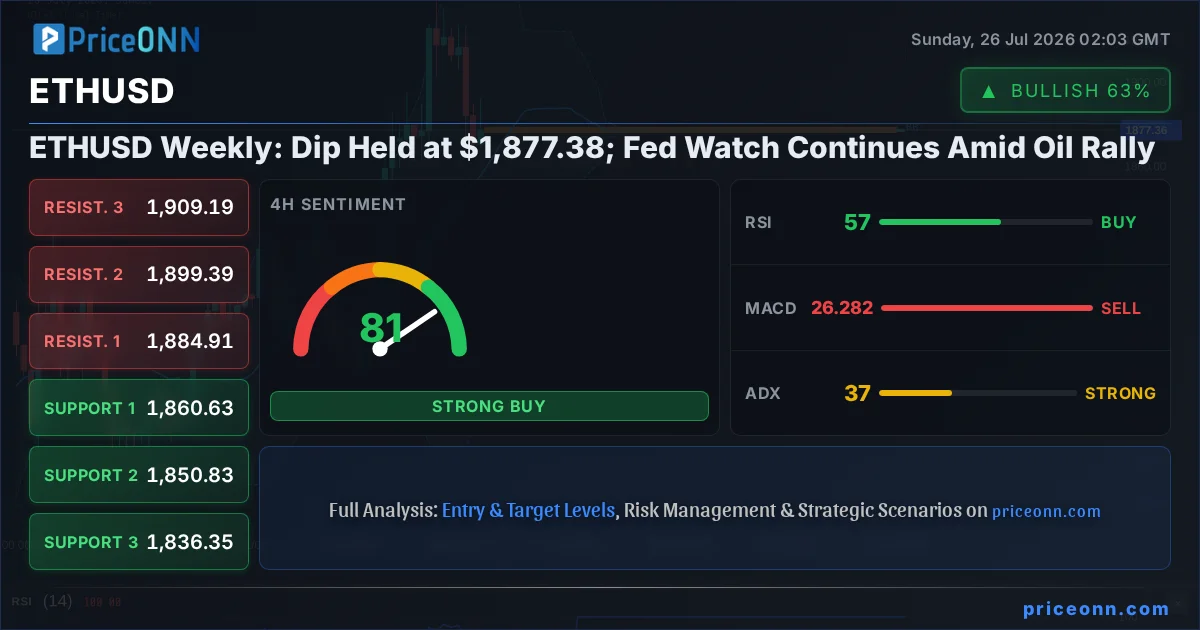
The past week has seen Ethereum (ETHUSD) navigate a complex macroeconomic landscape, ultimately holding a critical support level around $1,877.38. While the market grapples with renewed inflation concerns driven by a surging oil price and anticipation surrounding the upcoming Federal Reserve meeting, ETHUSD's resilience suggests underlying strength, though caution remains paramount. This analysis delves into the technicals, the crypto-specific fundamentals, and the broader market correlations that shaped the past week and will likely dictate Ethereum's trajectory in the coming days.
- ETHUSD held support at $1,877.38, showing resilience despite broader market volatility.
- RSI at 39.48 on the 1H chart signals a potential oversold condition, but the 1D chart RSI at 59.95 indicates lingering bullish momentum.
- Critical support for ETHUSD sits at $1,860.63, tested multiple times this week. A break below this could signal further downside.
- The correlation with DXY strength and the oil price rally complicates the outlook, highlighting macro risks for ETHUSD.
The cryptocurrency market, particularly Ethereum, has been in a constant state of flux, reacting to a myriad of global economic and geopolitical events. Last week was no exception. As we close out the trading week, ETHUSD finds itself at a crucial juncture, having defended the $1,877.38 level against significant headwinds. This defense, however, occurs against a backdrop of rising oil prices, a strengthening dollar index (DXY), and the ever-present anticipation of central bank policy shifts, particularly from the U.S. Federal Reserve. The interplay between these factors creates a complex trading environment where macro trends heavily influence crypto asset prices, a dynamic that has become increasingly pronounced over the past year.
Navigating the Macro Crosscurrents: Oil, DXY, and Fed Expectations
The narrative dominating financial markets this past week has been the resurgence of inflation fears, largely fueled by a significant rally in crude oil prices. Brent crude, trading around $83.79, and WTI at $79.59, have climbed substantially, reigniting concerns about broader inflationary pressures. This poses a dilemma for central banks, especially the Federal Reserve, which is scheduled to hold its next FOMC meeting soon. The market is keenly watching for any signals regarding future interest rate policy. With the Fed Fund Futures and OIS pricing in a potential for unchanged rates in the immediate term, the focus is shifting to forward guidance. Any hawkish hints could strengthen the dollar, as seen with the DXY currently at 100.7, which historically puts pressure on risk assets like Ethereum.
The correlation between risk assets and the broader macroeconomic environment has never been clearer. As the DXY strengthens, we often see a corresponding pressure on assets like ETHUSD, EURUSD, and XAUUSD. This week, the DXY’s move to 100.7 on the 1H chart, coupled with its neutral stance on the 4H and 1D, suggests a cautious but potentially upward-biased dollar. This dynamic directly impacts Ethereum's price action. A stronger dollar makes dollar-denominated assets more expensive for holders of other currencies, potentially dampening demand. Furthermore, rising oil prices, a key inflation indicator, can lead to expectations of higher interest rates for longer, further reinforcing dollar strength and creating a headwind for speculative assets.
The implications for ETHUSD are significant. While crypto has often been touted as an inflation hedge, its behavior in recent cycles has shown a strong correlation with risk appetite, mirroring tech stocks and reacting negatively to rising rates and dollar strength. This makes the upcoming Fed meeting and the trajectory of oil prices critical factors to monitor. The market is in a state of flux, trying to price in the possibility of sustained higher rates or a potential pivot if inflation shows signs of cooling. The current technical picture for ETHUSD reflects this uncertainty, with mixed signals across different timeframes.
ETHUSD Technicals: A Tale of Two Timeframes
Looking at the technical indicators for ETHUSD, we see a divergence between short-term and long-term timeframes, reflecting the market's indecision. On the 1-hour chart, ETHUSD is currently trading at $1,877.38. The RSI(14) is at 39.48, indicating a move towards oversold territory, a potential sign of buying pressure emerging. The MACD is showing negative momentum, with the MACD line below the signal line, suggesting a bearish short-term bias. However, the Stochastic Oscillator presents a conflicting signal, with %K (26.28) crossing above %D (20.63), hinting at a potential upward reversal. The ADX at 29.09 signifies a strong downtrend on this timeframe, but the general signal is leaning towards 'SELL' (Al: 2, Sat: 6, Nötr: 0), indicating short-term bearish sentiment.
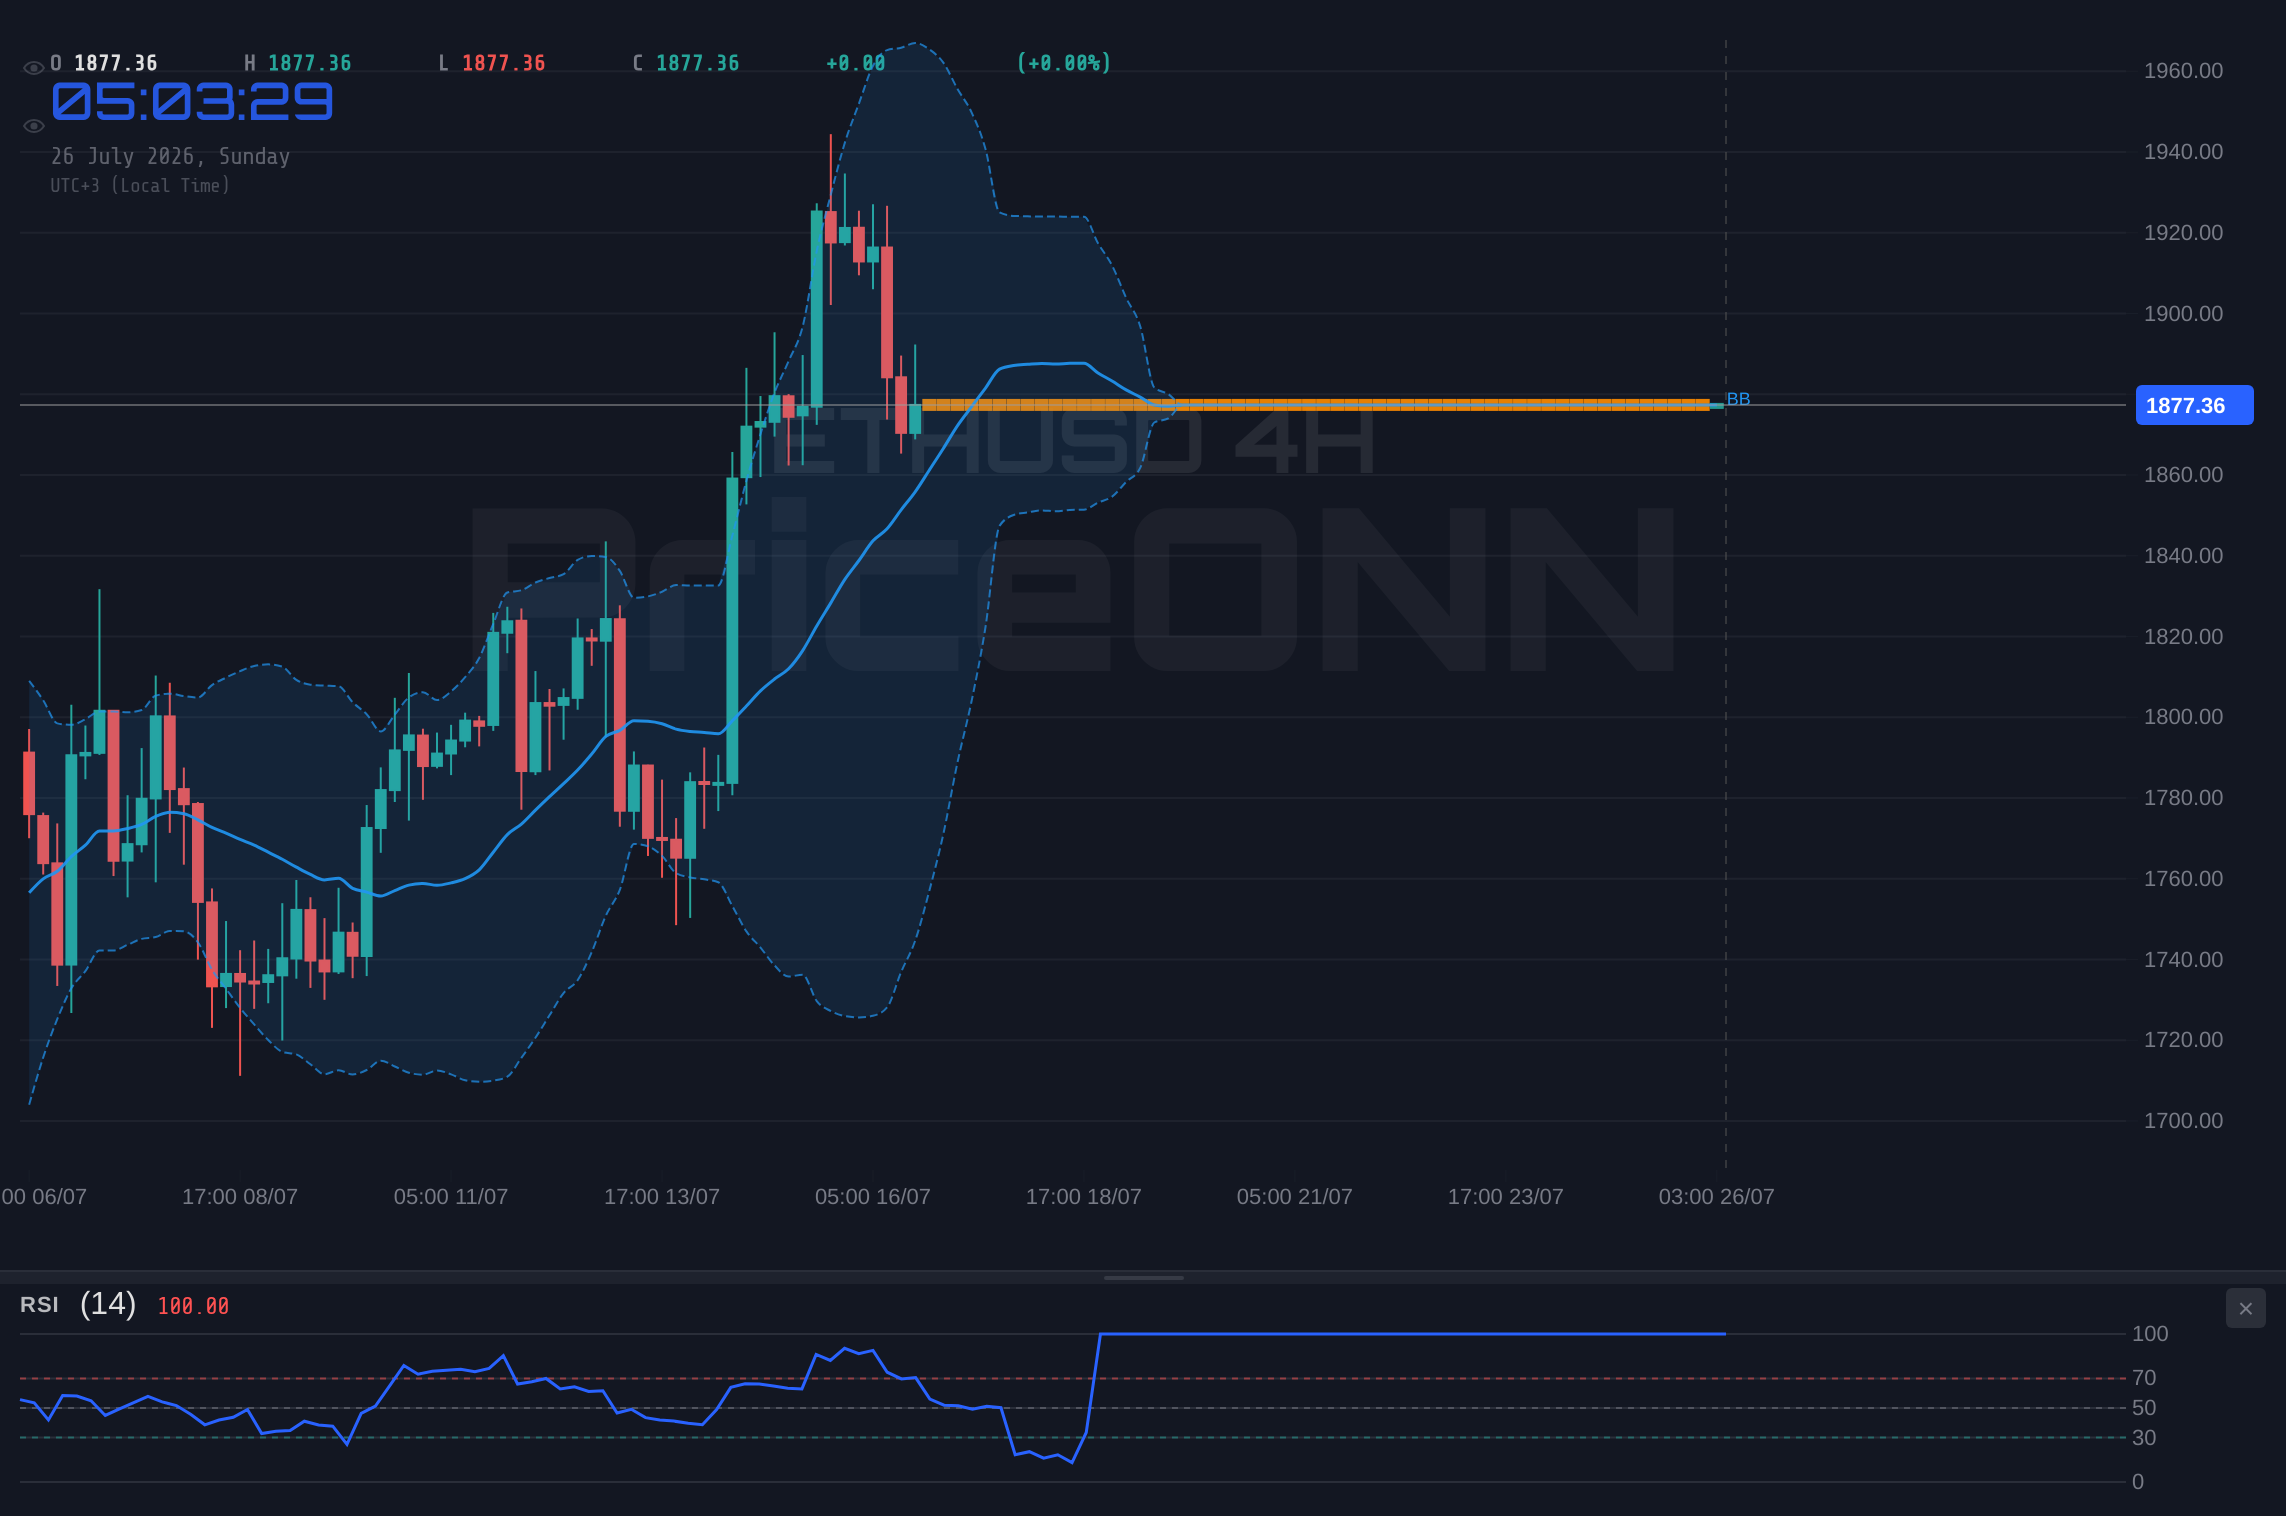
However, when we shift to the 4-hour and daily charts, the picture becomes more constructive. The 4-hour chart shows ETHUSD at $1,877.38, with an RSI(14) of 56.88, comfortably in the neutral zone and exhibiting an upward trend. The MACD here is also showing negative momentum, but the Bollinger Bands suggest an upward trend as the price is above the middle band. The Stochastic Oscillator shows %K (18.24) below %D (57.76), a bearish signal on this timeframe, yet the overall signal is 'BUY' (Al: 5, Sat: 3, Nötr: 0). The ADX at 37.06 indicates a strong uptrend on this timeframe, suggesting that the underlying trend might be more bullish than the 1-hour chart suggests.
The daily timeframe paints an even more encouraging picture for ETHUSD. With the price at $1,877.38, the RSI(14) stands at 59.95, firmly in bullish territory and showing an upward trend. The MACD is positive, with the MACD line above the signal line, confirming bullish momentum. The Stochastic Oscillator is also in a strong bullish configuration, with %K (84.55) well above %D (79.73), indicating a strong upward move and potentially entering overbought territory soon. The ADX at 22.66 suggests a medium-strength uptrend. The overall signal for the daily timeframe is 'BUY' (Al: 7, Sat: 1, Nötr: 0), indicating that longer-term investors might be finding value at current levels.
This divergence in signals across timeframes is typical in a market trying to digest conflicting macro data and sentiment. The short-term bearish signals on the 1-hour chart could be noise, or they could represent a healthy pullback before a larger move. The key will be how ETHUSD behaves around the critical support levels identified. The 1-hour support at $1,868.34 and the 4-hour support at $1,860.63 are crucial. A failure to hold these levels could invalidate the bullish thesis emerging from the daily chart and signal a deeper correction.
Crypto-Specific Fundamentals: Ecosystem Health and Investor Flows
Beyond the macro and technicals, the health of the Ethereum ecosystem itself is a critical driver. On-chain metrics provide valuable insights into investor behavior and network activity. While specific on-chain data like active addresses, whale movements, and exchange flows are not provided in real-time for this article, their importance cannot be overstated. Generally, a rising number of active addresses and significant accumulation by large holders ('whales') are bullish signals, indicating growing network adoption and confidence. Conversely, large outflows to exchanges can precede selling pressure.
The DeFi and NFT ecosystems built on Ethereum also play a crucial role. Total Value Locked (TVL) in DeFi protocols, staking yields, and gas fee dynamics provide a pulse on the network's utility and demand. High gas fees, while indicative of network congestion and demand, can also deter users and traders, potentially impacting price in the short term. Conversely, a vibrant DeFi and NFT market suggests real utility and demand for ETH, which should theoretically support its price. Developments in Layer 2 scaling solutions, such as Arbitrum and Optimism, are also vital, as they aim to improve scalability and reduce transaction costs, making the Ethereum network more accessible and attractive.
Regulatory news continues to be a significant factor influencing the crypto market. Any pronouncements from major regulatory bodies, particularly in the U.S., can cause sharp price swings. While no specific regulatory news directly impacting ETHUSD was highlighted in the provided recent news feed, the ongoing discussions around digital asset regulation globally remain a backdrop. Clarity on regulatory frameworks could unlock further institutional adoption, a key catalyst for price appreciation. The recent pause in Bitcoin and Ethereum recovery mentioned in PriceONN market news suggests that the market is currently hesitant, waiting for clearer direction.
Institutional adoption trends are also a key fundamental driver. The performance of Bitcoin and Ethereum ETFs, if available and relevant to the current market context, would offer insights into institutional interest. While not explicitly detailed in the provided data, the broader market's reaction to macro events often dictates institutional flows into digital assets. If the Fed signals a dovish turn or inflation fears subside, we could see a renewed influx of institutional capital into cryptocurrencies, benefiting ETHUSD.
Correlation with Bitcoin and Altcoin Landscape
Ethereum's price action is inextricably linked to Bitcoin. As the largest cryptocurrency by market capitalization, Bitcoin often sets the tone for the entire altcoin market. When Bitcoin moves, Ethereum and other altcoins typically follow, albeit with amplified volatility. The provided data for BTCUSD shows a mixed picture, with a 'BUY' signal on the daily and 4-hour charts but a 'SELL' signal on the 1-hour, trading at $64,629.65. This mixed signal for Bitcoin mirrors some of the uncertainty seen in ETHUSD, reinforcing the idea that the market is at an inflection point.
The correlation between ETHUSD and BTCUSD is typically very high, often exceeding 0.8. This means that any significant move in Bitcoin is likely to be reflected in Ethereum's price. Currently, Bitcoin's daily chart suggests a bullish bias, which should theoretically provide a tailwind for Ethereum. However, the short-term 'SELL' signal on BTCUSD's 1-hour chart might be contributing to the bearish pressure seen in ETHUSD's 1-hour timeframe. Traders must watch Bitcoin's reaction to its key support and resistance levels closely, as they will likely provide clues for Ethereum's next move.
Beyond Bitcoin, Ethereum's performance also influences the broader altcoin market. While this article focuses on ETHUSD, understanding the general altcoin sentiment is important. The provided data does not include specific altcoin prices, but generally, when Ethereum shows strength, many altcoins tend to follow suit, especially those within the Ethereum ecosystem (e.g., DeFi tokens, L2 solutions). Conversely, if ETHUSD falters, the altcoin market often experiences sharper declines due to its higher beta.
Market Sentiment and What to Watch Next Week
The current market sentiment for ETHUSD appears to be cautiously optimistic, leaning towards a 'BUY' signal on the daily and 4-hour charts, despite some short-term bearish indicators. The fact that ETHUSD held the $1,877.38 support level is a positive sign for bulls. However, the persistent inflation concerns and the potential for a hawkish Fed stance introduce significant risk. Traders will be paying close attention to the upcoming economic calendar, particularly any data that could influence the Fed's decision. Inflation reports and employment figures will be key.
Looking ahead to next week, the primary focus will remain on the Federal Reserve's policy decisions and statements. Any indication of a shift in interest rate policy, whether hawkish or dovish, will likely trigger significant market movements across all asset classes, including ETHUSD. The ongoing geopolitical tensions, particularly related to oil prices, will also continue to be a major factor influencing inflation expectations and risk sentiment.
From a technical perspective, the key levels to watch for ETHUSD are the immediate support at $1,860.63 and the resistance at $1,891.84 on the 1-hour chart. A decisive break above $1,891.84 could open the door for a move towards the 4-hour resistance at $1,909.19. Conversely, a close below $1,860.63 on the daily chart would likely signal a deeper retracement, potentially targeting the next support level around $1,836.35. The ADX values suggest that while trends are present, they might not be strongly committed yet, meaning we could see some choppy price action until a clearer catalyst emerges.
The PriceONN market news suggesting a pause in the recovery for Bitcoin and Ethereum indicates that the immediate upward momentum might be stalling. This reinforces the need for caution. Traders should look for confirmation on either side of the current range. For a bullish setup, we would want to see ETHUSD hold above $1,860.63, ideally with increasing volume, and break convincingly above the 1-hour resistance at $1,891.84. For a bearish setup, a daily close below $1,860.63, coupled with weakness in Bitcoin and a rising DXY, would be concerning.
Bearish Scenario: $1,877.38 Support Falters
45% ProbabilityNeutral Scenario: Consolidation Around $1,877.38
30% ProbabilityBullish Scenario: $1,877.38 Holds Strong
25% ProbabilityFrequently Asked Questions: ETHUSD Analysis
What happens if ETHUSD breaks below the $1,860.63 support level?
A break and daily close below $1,860.63 would invalidate the current bullish setup on the daily chart and likely trigger further selling pressure. This could open the door for a move towards the next significant support at $1,836.35, especially if Bitcoin also shows weakness and the DXY continues its ascent.
Should I buy ETHUSD at current levels around $1,877.38 given the RSI at 59.95 on the daily chart?
Buying at $1,877.38 requires careful risk management. While the daily RSI at 59.95 shows bullish momentum, the 1-hour RSI at 39.48 suggests short-term weakness. A high-probability setup would involve waiting for ETHUSD to hold above $1,860.63 and ideally break above $1,891.84 resistance, confirming a continuation of the uptrend. Risking capital without confirmation carries significant downside potential.
Is the RSI at 39.48 on the 1H chart a strong sell signal for ETHUSD?
An RSI of 39.48 on the 1-hour chart indicates that ETHUSD is approaching oversold conditions on that specific timeframe. While it suggests short-term selling pressure may be easing, it's not a direct sell signal on its own. It needs to be considered alongside other indicators and price action; a confirmed bearish signal would require a break below key support levels like $1,868.34.
How will the upcoming Fed meeting affect ETHUSD this week?
The Fed meeting is a major catalyst. If the Fed signals a more hawkish stance (higher rates for longer), it could strengthen the DXY (currently 100.7) and put downward pressure on ETHUSD, potentially leading to a break of the $1,860.63 support. Conversely, a dovish surprise or signals of rate cuts could boost risk assets like ETHUSD, pushing it towards resistance levels around $1,909.19 and higher.
Technical Outlook Summary
| Indicator | Value | Signal | Interpretation |
|---|---|---|---|
| RSI (14) - 1H | 39.48 | Bearish | Approaching oversold, potential reversal zone. |
| MACD - 1H | Negative | Bearish | Negative momentum, below signal line. |
| Stochastic - 1H | K: 26.28, D: 20.63 | Bullish Crossover | Potential short-term reversal signal. |
| ADX - 1H | 29.09 | Strong Downtrend | Confirms bearish trend on short timeframe. |
| RSI (14) - 1D | 59.95 | Bullish | Healthy momentum in neutral-to-bullish zone. |
| MACD - 1D | Positive | Bullish | Bullish momentum confirmed. |
| Stochastic - 1D | K: 84.55, D: 79.73 | Bullish | Strong upward move, nearing overbought. |
| ADX - 1D | 22.66 | Medium Uptrend | Supports longer-term bullish bias. |
Key Levels for ETHUSD
The past week has been a masterclass in market indecision, with ETHUSD finding a precarious footing at $1,877.38. The conflicting signals across different timeframes highlight the broader market's struggle to reconcile persistent inflation concerns, a strengthening dollar, and the ever-present anticipation of Federal Reserve policy. While the daily chart offers a glimmer of hope for the bulls, the short-term bearish indicators and the macro environment demand a high degree of caution. The coming week, dominated by Fed commentary and ongoing geopolitical developments, will be critical in determining whether ETHUSD can solidify its hold on current levels or succumb to renewed selling pressure. Patience and disciplined risk management remain the most valuable tools for any trader navigating these choppy waters.
Having tracked ETHUSD through various market cycles, the current environment is particularly challenging. The strong correlation with risk assets means that broader equity market sentiment, heavily influenced by Fed policy and inflation data, will continue to dictate short-term moves. The resilience shown at $1,877.38 is a positive sign, but a decisive break above the $1,891.84 resistance, confirmed by increasing volume and a less hawkish Fed outlook, is needed to fully reignite bullish conviction. Until then, expect continued volatility and a focus on key support and resistance levels.
The market is currently pricing in a high degree of uncertainty regarding the Fed's next move. If the central bank signals a higher-for-longer interest rate environment due to sticky inflation, driven partly by the oil rally, the DXY could see further upside. This would likely translate to downward pressure on ETHUSD, potentially testing the $1,860.63 support. Conversely, any indication that inflation is cooling or that the Fed is nearing a pivot could spark a significant risk-on rally, benefiting ETHUSD and pushing it towards the $1,900+ levels. Traders must remain agile, monitor macro data releases closely, and adhere strictly to risk management protocols.
From a crypto-specific fundamental perspective, the continued development within the Ethereum ecosystem - scaling solutions, DeFi innovation, and NFT market activity - provides a long-term bullish underpinning. However, these fundamental drivers often take a backseat in the short to medium term when macro factors dominate. The resilience of ETHUSD at $1,877.38 is a testament to its underlying utility and adoption, but it cannot entirely decouple from the broader financial market sentiment. The coming days will be crucial for discerning whether this support level can act as a launchpad for a sustained recovery or merely a temporary pause before further declines.
The divergence in technical signals across timeframes is a classic symptom of a market at an inflection point. The 1-hour chart's bearish leanings are counterbalanced by the daily chart's bullish momentum. This suggests that while short-term traders might be cautious, longer-term investors are finding value. The critical test will be the reaction to immediate support at $1,860.63 and resistance at $1,891.84. A clear break out of this range, supported by macro catalysts, will likely define the next significant price trend for ETHUSD.
The correlation with Bitcoin is also a key factor to watch. With BTCUSD showing mixed signals but a generally bullish daily outlook, any strength from the market leader would likely provide a tailwind for ETHUSD. However, if Bitcoin falters, especially below its key support levels, it could drag Ethereum down with it. The current price action for ETHUSD at $1,877.38 represents a delicate balance, and the scales could tip decisively based on next week's economic data and Fed commentary.
Ultimately, the narrative of ETHUSD holding $1,877.38 support this week is a story of resilience amidst external pressures. The market is caught between the inflationary impact of rising oil prices and the deflationary potential of restrictive monetary policy. For Ethereum, this translates to a crucial period of consolidation and observation. The key levels identified - $1,860.63 support and $1,891.84 resistance - will be the battleground. A decisive move beyond these levels, driven by clear macro signals, will likely set the tone for the remainder of the month.
For traders, the current environment calls for patience and precision. While the daily chart's bullish signals are encouraging, the short-term uncertainty and macro risks cannot be ignored. A breakout above $1,891.84, especially if accompanied by a less hawkish Fed, could signal a move towards $1,956.29. Conversely, a failure to hold $1,860.63 could lead to a sharp decline, targeting $1,792.15. The market is waiting for clarity, and until then, volatility is likely to remain elevated.
The past week's action, where ETHUSD defended $1,877.38, demonstrates the market's sensitivity to key technical levels. However, the broader economic narrative - inflation, interest rates, and geopolitical tensions - is currently the dominant force. As we look ahead, the Federal Reserve's stance will be paramount. A shift towards a more accommodative policy could unlock significant upside potential for ETHUSD, but any hints of continued tightening will likely reinforce the current downtrend or consolidation. It's a waiting game, where adherence to technical levels and macro awareness are paramount.
The resilience at $1,877.38 is a positive sign, but it's crucial to remember that we are in a complex macro environment. The rise in oil prices to $83.79 (Brent) and $79.59 (WTI) adds a significant inflationary component that the Fed cannot ignore. This could lead to a more hawkish stance, strengthening the DXY to 100.7, and potentially pressuring ETHUSD. Therefore, while the daily chart shows bullish momentum (RSI 59.95), the short-term outlook (1H RSI 39.48) and macro risks suggest caution is warranted. The key levels to watch remain $1,860.63 for support and $1,891.84 for resistance.
The crypto market's sensitivity to traditional finance cannot be overstated. The pause in recovery for Bitcoin and Ethereum, as noted by PriceONN, highlights this interconnectedness. Institutional flows, heavily influenced by macro sentiment and regulatory clarity, will play a significant role in any sustained recovery. For now, ETHUSD is demonstrating its ability to hold ground, but the catalyst for a significant upward move will likely come from a shift in the broader economic narrative or a clear bullish technical breakout above key resistance levels, confirmed by on-chain metrics showing increased accumulation and network activity.
The battleground around $1,877.38 is set. Bulls will aim to consolidate and push higher, targeting $1,891.84 and beyond, while bears will seek to break this support and drag ETHUSD lower towards $1,860.63 and potentially $1,836.35. The outcome will largely depend on the Federal Reserve's upcoming policy signals and the continued trajectory of oil prices, which are currently fueling inflation concerns. This period of uncertainty demands careful observation and adherence to established risk management principles.
For those looking for actionable insights, the current market conditions present a 'watch zone' scenario. A daily close above $1,891.84, especially if accompanied by a dovish Fed tone, would be a strong bullish signal, potentially opening the door for a move towards $1,956.29. Conversely, a daily close below $1,860.63, particularly if the DXY continues to rise and oil prices remain elevated, would suggest a bearish continuation, targeting lower levels. Until a clear catalyst emerges, maintaining a neutral to cautious stance, with tight risk controls, is advisable.
The historical context of ETHUSD shows that periods of macro uncertainty often lead to heightened volatility. While the current price at $1,877.38 represents a level of support, the underlying economic pressures are significant. The Fed's next move is pivotal. If they maintain a hawkish stance, it could lead to a sustained period of risk aversion, impacting ETHUSD negatively. However, if inflation shows signs of cooling and the Fed signals a pause or even a pivot, it could trigger a strong rally in risk assets. The ADX readings across timeframes (29.09 on 1H, 37.06 on 4H, 22.66 on 1D) suggest that while trends are present, they might lack strong commitment, indicating potential for ranging or choppy price action until a clear directional catalyst emerges.
The correlation analysis is also key. With DXY at 100.7 and showing strength, and oil prices above $83.79, the macro headwinds for ETHUSD are evident. A weakening DXY or a significant drop in oil prices would be necessary to alleviate some of this pressure. Until then, ETHUSD's ability to hold $1,877.38 is a testament to its own ecosystem strength, but it operates within the broader financial market's constraints. The next week will be critical for discerning the market's conviction.
ETHUSD is at a pivotal point, testing support at $1,877.38 amidst a complex macroeconomic backdrop. The bullish signals on the daily chart are encouraging, but the short-term bearish indicators and macro risks, particularly from the Fed and oil prices, demand caution. The key levels to watch are $1,860.63 for support and $1,891.84 for resistance. A clear catalyst, likely from the Fed meeting or inflation data, will be needed to break this indecision and set a definitive direction for Ethereum.
The past week saw ETHUSD holding the $1,877.38 level, a crucial defense against broader market pressures stemming from rising oil prices and a strengthening dollar. While the daily technicals show a bullish bias, the short-term outlook and macro uncertainty necessitate a cautious approach. The Federal Reserve's upcoming policy meeting and inflation data will be key catalysts. For now, ETHUSD remains in a critical zone, with support at $1,860.63 and resistance at $1,891.84.
The market sentiment remains cautiously optimistic, with bulls looking to consolidate above $1,877.38. However, the risk of a macro-driven downturn persists. A decisive break above $1,891.84 could signal a move towards $1,956.29, while a failure to hold $1,860.63 could lead to a retest of $1,836.35. The coming week's economic data and central bank commentary will be crucial in determining the next directional move for ETHUSD.
The PriceONN market news highlighting a pause in the recovery for both Bitcoin and Ethereum underscores the current market's sensitivity to macro factors. This suggests that while underlying crypto fundamentals might be strong, external economic forces are currently dictating short-term price action. The resilience shown by ETHUSD at $1,877.38 is a positive indicator, but it needs to be viewed within the context of the broader market's response to inflation and interest rate expectations.
The technical indicators present a mixed picture: the 1-hour chart shows bearish momentum (RSI 39.48, MACD negative), while the daily chart remains bullish (RSI 59.95, positive MACD). This divergence suggests that the market is at an inflection point. A break above $1,891.84, confirmed by increasing volume and positive macro catalysts, would be a strong bullish signal. Conversely, a close below $1,860.63, especially if coupled with a hawkish Fed and rising DXY, could lead to further downside.
As we look ahead, the key levels to monitor are clear: $1,860.63 as critical support and $1,891.84 as immediate resistance. The probability of a significant move hinges on upcoming macroeconomic events. A dovish Fed could propel ETHUSD higher, while a hawkish stance could lead to a breakdown. The current price of $1,877.38 represents a crucial test of this balance. Traders should remain vigilant and prepare for potential volatility.
The historical context of ETHUSD shows that such periods of macro uncertainty can lead to significant price swings. While the defense of $1,877.38 is encouraging, the market is still vulnerable to shifts in inflation expectations and central bank policy. The strength of the DXY at 100.7 and the elevated oil prices ($83.79 Brent) are significant headwinds that cannot be ignored. Therefore, a cautious approach, focusing on risk management and waiting for clear technical confirmations, is the most prudent strategy.
The correlation with Bitcoin (BTCUSD at $64,629.65) is also a key factor. A bullish move in Bitcoin, supported by positive macro news, could provide a significant tailwind for ETHUSD. However, if Bitcoin falters, it is likely to drag Ethereum down with it. The current indecision in both BTCUSD and ETHUSD reflects the broader market's wait-and-see approach ahead of key economic data and central bank decisions.
The resilience at $1,877.38 is a testament to Ethereum's fundamental strength, but macro factors currently dominate. As we move into next week, all eyes will be on the Fed. Any indication of a policy shift will likely trigger significant price action. For now, ETHUSD remains in a tight range, with traders waiting for a clear signal from either the macroeconomic environment or a decisive technical breakout. The ability to hold this support level is encouraging, but the path forward remains uncertain.
Track markets in real-time
AI-powered analysis, technical indicators and real-time price data.
Join Our Telegram Channel
Breaking market news, AI analysis and trading signals instantly.
Join Channel