WTI Crude Oil Holds Firm at Support, Is a Fresh Surge Coming?

Crude Oil's Resilience Tested at Key Support
The volatile journey of WTI Crude Oil saw prices retreat from highs exceeding $100, ultimately testing the critical $85.00 support zone. This pullback followed a notable breach of a bullish trendline that had been guiding the market higher on the 4-hour XTI/USD chart, with that line previously situated at the $96.00 mark.
Despite the downward pressure and a dip below the $98 and $95 levels, which signaled a short-term bearish bias, the market's resilience above $85.00 has become a focal point. This level, coupled with the 100-period simple moving average on the 4-hour timeframe, appears to be acting as a solid floor. The price action has since entered a consolidation pattern, indicating a temporary stalemate between buyers and sellers.
Immediate upside pressure is being met near the $95.50 area. This level is significant as it aligns with the 61.8% Fibonacci retracement of the recent decline from the $102.07 peak down to the $85.02 trough. Overcoming this hurdle is crucial for any renewed bullish sentiment.
Navigating Resistance and Support Levels
For upward momentum to resume, a decisive close above the $98.00 level is paramount. Such a move could pave the way for a retest of the $102.00 region. Should buyers maintain control beyond this, the market could eye a move towards the $105.00 mark in the near term, signaling a potential reversal of the recent correction.
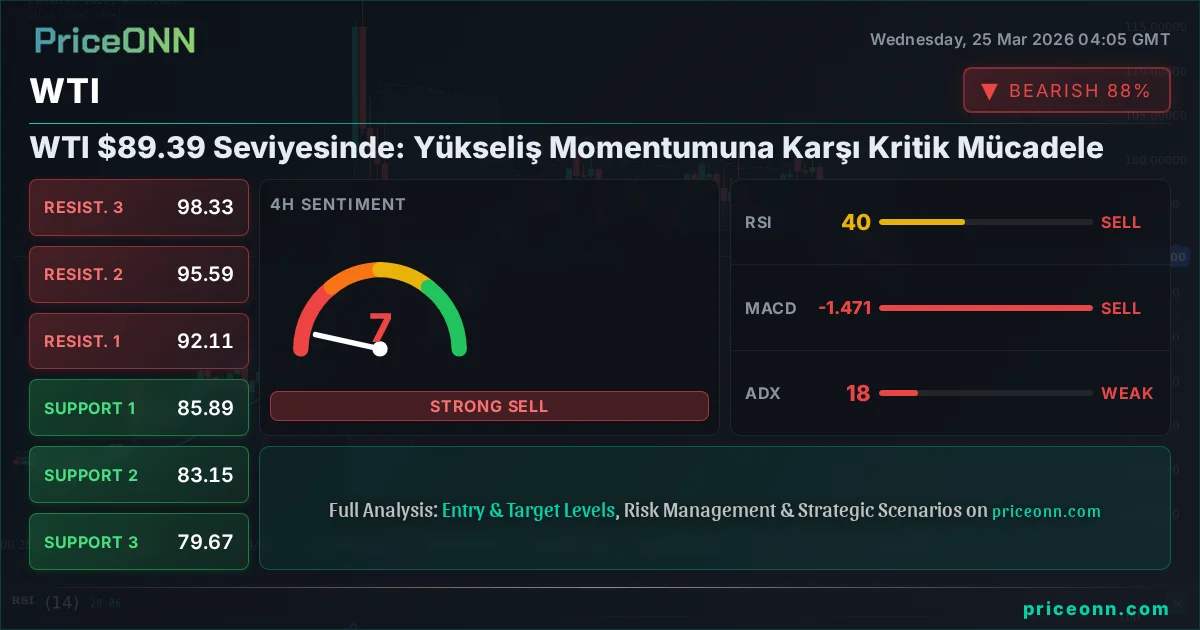
Conversely, downside risks remain in play. The initial area of defense for the bulls lies around the $89.00 zone, reinforced by the aforementioned 100-period moving average. A failure to hold this level could accelerate the descent, with the $85.00 support looming large once more.
Should the price decisively break below $85.00, the next significant target for sellers would be the $82.00 level. A daily settlement below this point would significantly heighten the risk of a more substantial downturn, potentially sending WTI Crude Oil prices towards the $76.00 area and the 200-period moving average on the 4-hour chart. This scenario would suggest a deeper bearish trend is taking hold.
Broader Market Movements and Economic Signals
In parallel market developments, gold has shown signs of weakness, struggling to maintain its value. Traders are watching closely to see if the precious metal will extend its losses below the $4,200 level, a move that could signal further risk aversion in financial markets.
Meanwhile, the EUR/USD currency pair has entered a period of consolidation, trading above the 1.1500 support. This suggests a temporary pause in its recent movements, with market participants awaiting clearer direction.
Looking ahead, economic data releases offer potential catalysts for market shifts. The US Import Price Index for February 2026 is anticipated to show a rise of 0.5% month-over-month, an acceleration from the prior month's 0.2% increase. The US Export Price Index for the same period is forecasted to remain steady at 0.5%, a slight deceleration from the previous 0.6% reading. These figures could influence inflation expectations and, by extension, central bank policy, indirectly impacting commodities and currency markets.
Market Ripple Effects
The current price action in WTI Crude Oil, particularly its defense of the $85.00 level after breaking a key trendline, creates a complex picture for related markets. A sustained rebound from these lows could reignite inflationary pressures, potentially strengthening the US Dollar Index (DXY) as the Federal Reserve might be compelled to maintain a hawkish stance for longer to combat rising energy costs.
Conversely, a decisive break below $85.00 would signal weakening demand or increased supply, potentially easing inflation concerns. This could lead to a softening of the DXY and provide a tailwind for riskier assets like emerging market currencies and even certain technology stocks, which often benefit from lower inflation expectations and a less aggressive monetary policy environment.
The performance of gold, currently showing weakness below $4,200, is also a critical indicator. If gold continues to slide, it might suggest a broader move away from safe-haven assets, potentially driven by improving economic sentiment or a belief that inflation is being brought under control. This would contrast sharply with a scenario where oil prices surge, implying a more stagflationary environment.
Furthermore, the EUR/USD pair's consolidation above 1.1500, while seemingly contained, is sensitive to energy price movements. A significant jump in oil prices could put downward pressure on the Euro, given Europe's reliance on imported energy, potentially causing EUR/USD to break below its current support and test lower levels.
Track markets in real-time
Empower your investment decisions with AI-powered analysis, technical indicators and real-time price data.
Join Our Telegram Channel
Get breaking market news, AI analysis and trading signals delivered instantly to your Telegram.
Join Channel