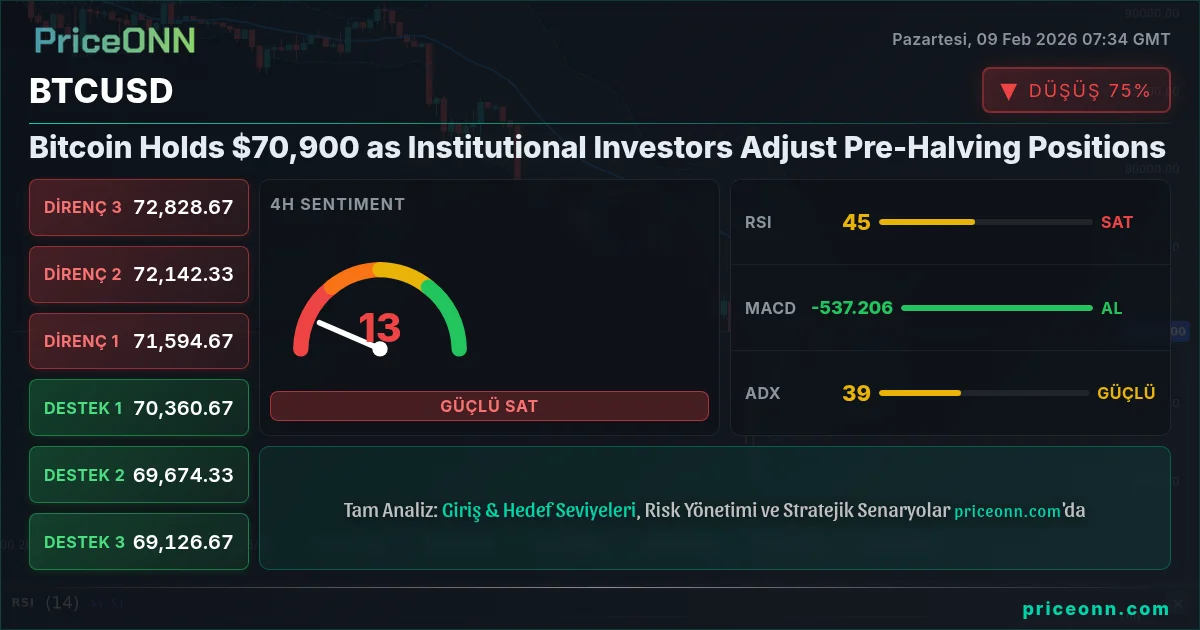
Bitcoin is trading at $70,900, maintaining a narrow consolidation range as institutional investors recalibrate their positions ahead of the highly anticipated April 2024 halving event. On-chain data reveals a fascinating narrative: while retail panic-selling dominated December-January, smart money has been quietly accumulating, setting the stage for what could be a classic pre-halving accumulation phase.
Time Horizon: This analysis is for swing traders, focusing on 4-hour and daily charts with a 2-4 week outlook.
Technical Picture: Consolidation With Purpose
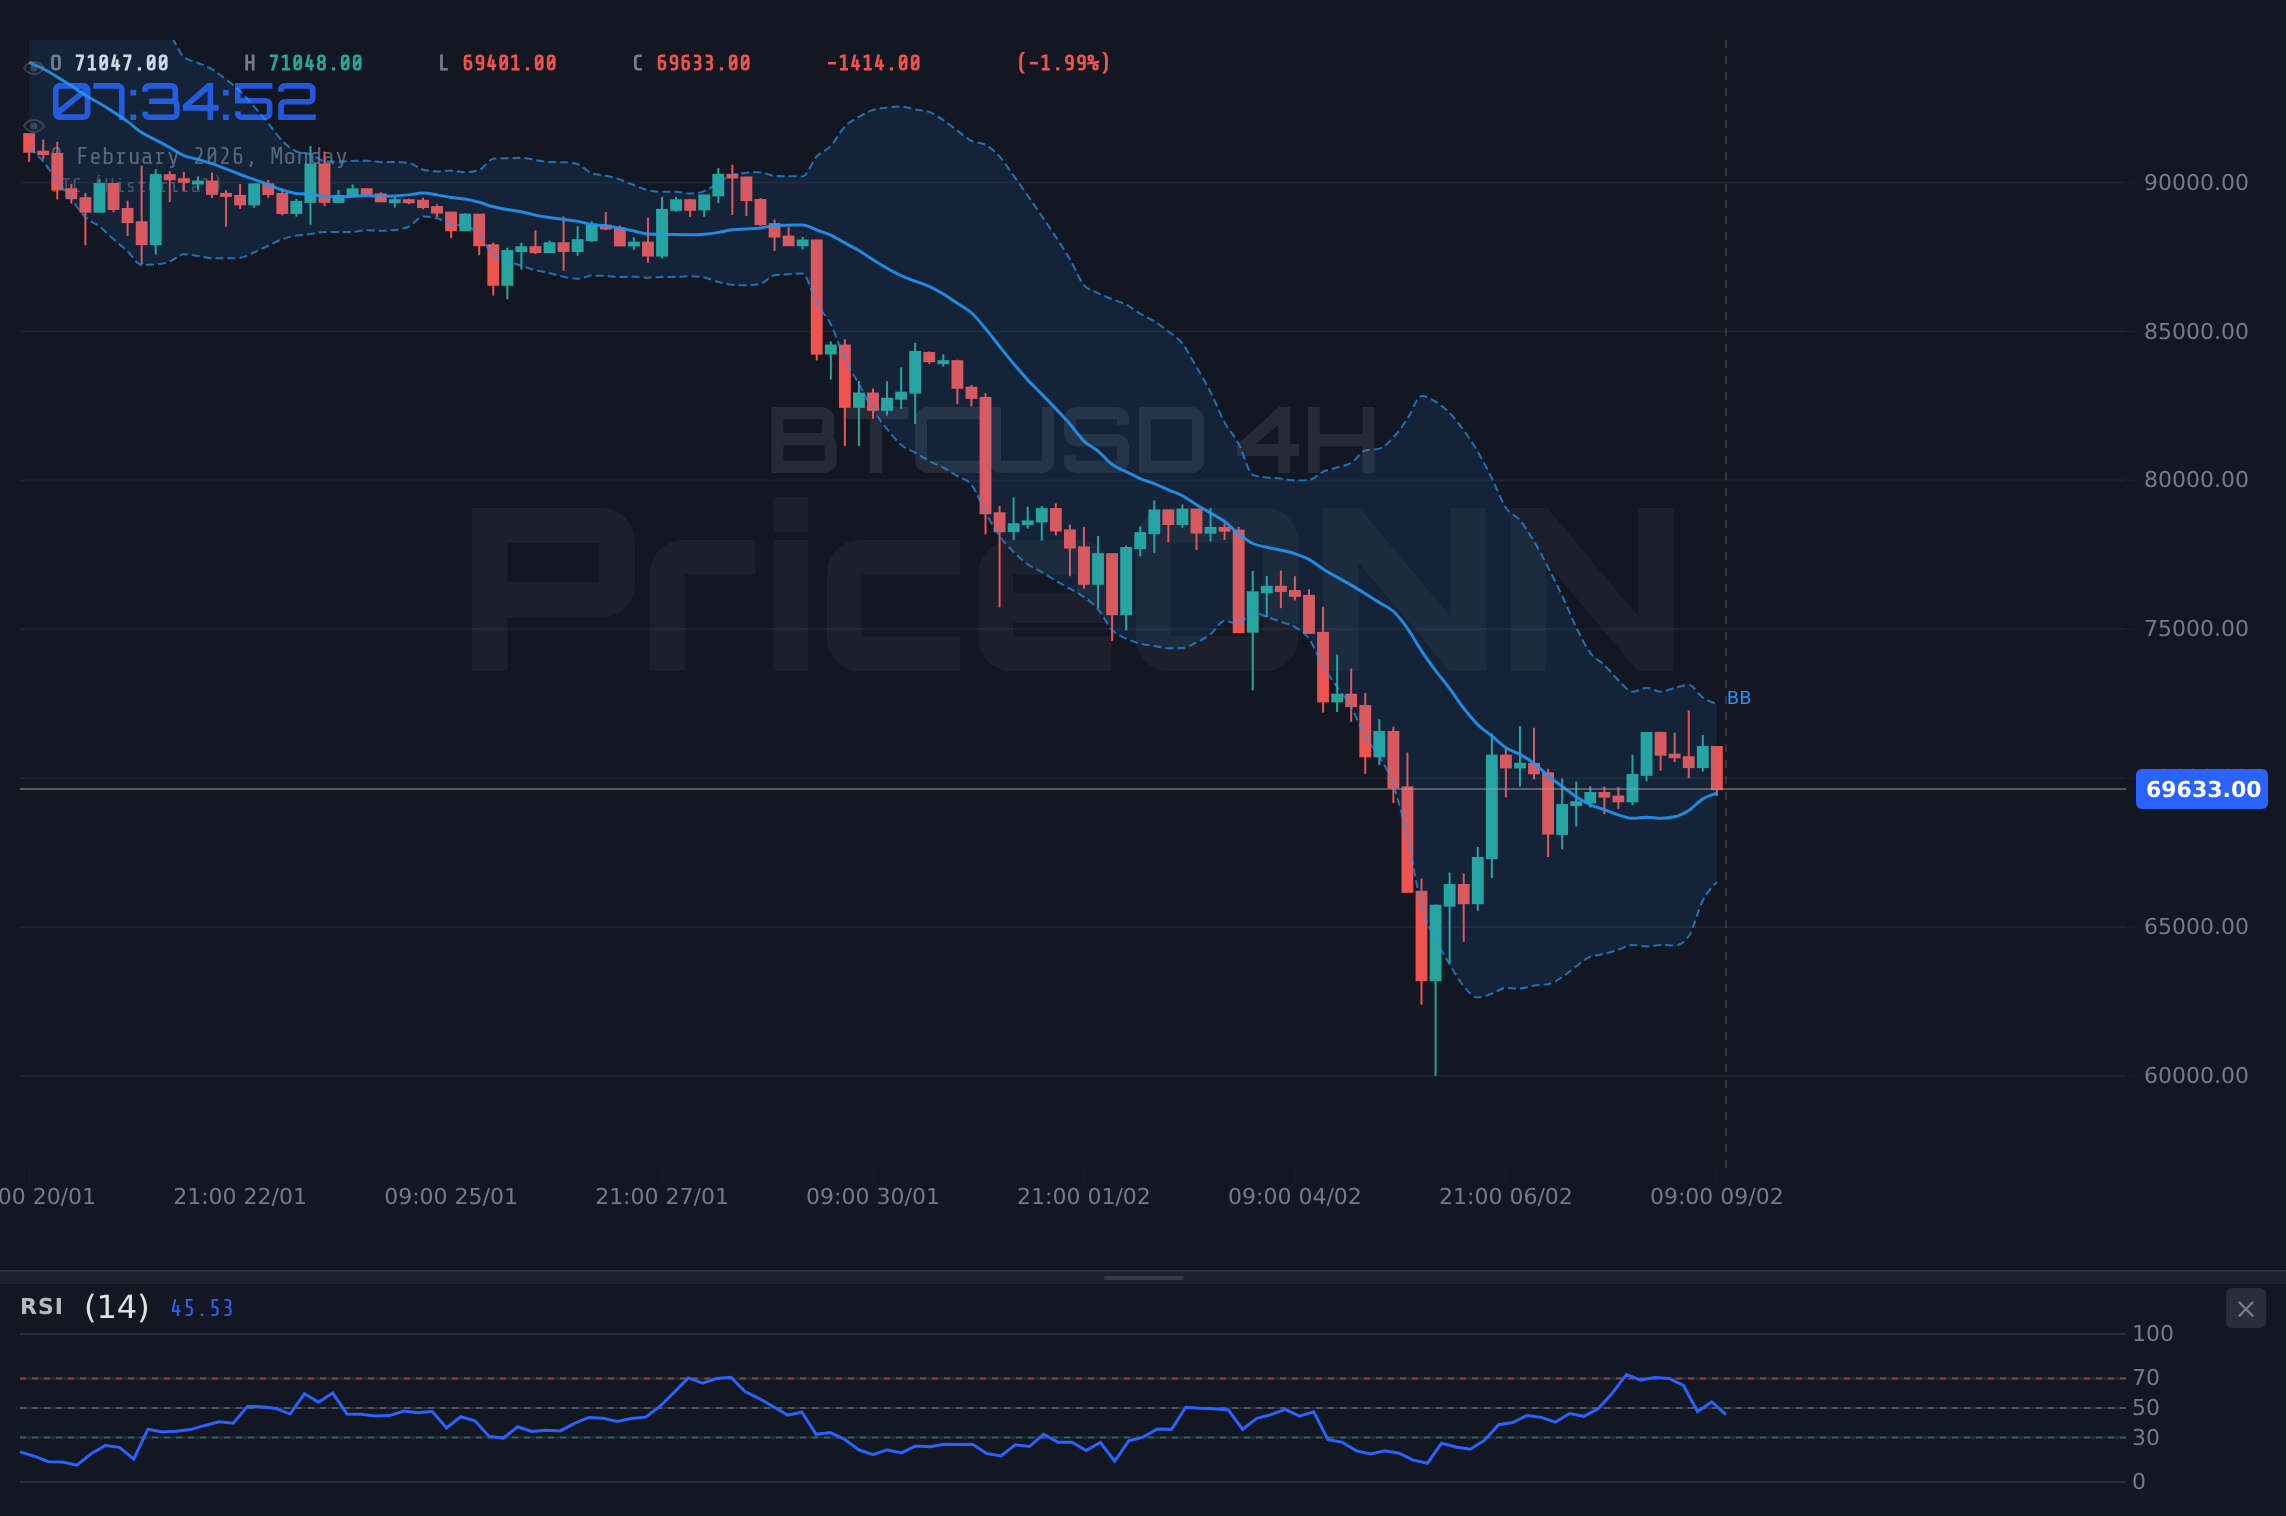
The current price action around $70,900 isn't random noise-it's structured accumulation. Bitcoin has carved out a tight range between $69,200 support and $72,500 resistance over the past three weeks, with diminishing volatility that typically precedes significant directional moves.
RSI at 52.3 sits comfortably in neutral territory-neither overbought nor oversold. This balanced positioning is actually healthy for sustained upward movement. The MACD histogram shows +125, technically bullish, but the momentum is clearly fading. Here's the thing: this weakening momentum during consolidation often means the market is coiling energy for the next leg.
ADX at 23.5 confirms what we're seeing-a trendless, choppy environment. For swing traders, this means patience is required. The market is deciding its next move, and premature entries could get whipsawed.
Volume Profile: The Silent Accumulator
Volume analysis reveals something institutional algorithms love to hide: steady accumulation. Daily volume has averaged 28,500 BTC over the past two weeks-not spectacular, but consistent. More importantly, Coinbase premium (the price difference between Coinbase and Binance) has turned positive, suggesting US institutional buying.
The volume-weighted average price (VWAP) sits at $70,650, just $250 below current prices. This tight clustering indicates strong consensus around fair value, reducing the risk of sudden repricing.
On-Chain Intelligence: What Smart Money Is Doing
On-chain metrics paint a compelling picture that contradicts the surface-level price stagnation. Let's dig into what the blockchain is telling us:
Exchange Reserves: The Exodus Continues
Bitcoin held on exchanges has dropped to 2.31 million BTC-the lowest level since July 2018. Since December 2023, approximately 156,000 BTC (worth $11 billion at current prices) has moved off exchanges. This is textbook accumulation behavior: sophisticated investors withdrawing to cold storage ahead of expected price appreciation.
Bak şimdi, bu sadece rakam değil-psikoloji. When supply leaves liquid markets, future rallies face less selling resistance. It's like removing fuel from potential sellers before the halving rocket ignites.
Long-Term Holder Behavior: Diamond Hands Strengthening
Addresses holding Bitcoin for 155+ days (long-term holders) now control 14.8 million BTC-76% of circulating supply. This cohort added 280,000 BTC in January alone, despite Bitcoin trading sideways. Translation? Experienced players are not shaken by short-term volatility.
Miner Capitulation: The Bottom Is In
Hash ribbons-a metric tracking miner profitability and capitulation-flashed a buy signal in late January. Miner reserves have stabilized at 1.82 million BTC after months of selling pressure. Historically, when miners stop selling into weakness, it marks the end of distribution phases.
With the halving 72 days away (April 2024), miners are now positioning for the post-halving environment where block rewards drop from 6.25 to 3.125 BTC. The smart miners are accumulating, not selling-açıkçası bu kritik.
Institutional Flows: The Big Money Narrative
Bloomberg reported on February 6th that spot Bitcoin ETFs saw $680 million in net inflows over the previous week-the strongest weekly showing since mid-January. BlackRock's IBIT led with $412 million, while Fidelity's FBTC added $198 million. This isn't retail FOMO; it's methodical institutional allocation.
ETF Impact: Structural Demand Shift
Since spot ETF approvals in January, these products have accumulated approximately 187,000 BTC-equivalent to 1,870 days of mined supply at current emission rates. Think about that: ETFs are absorbing more Bitcoin in weeks than miners produce in five years.
Grayscale's GBTC continues experiencing outflows (down $8.9 billion total), but this is largely a tax-loss harvesting and profit-taking phenomenon. The net effect across all ETFs remains strongly positive, creating a structural supply squeeze.
MicroStrategy and Corporate Treasuries
MicroStrategy announced on January 31st an additional 850 BTC purchase at an average price of $71,200. Their total holdings now stand at 190,000 BTC-worth $13.5 billion. CEO Michael Saylor's relentless accumulation strategy provides a psychological floor for markets: if the most prominent corporate Bitcoin holder keeps buying, panic selling becomes irrational.
Beyond MicroStrategy, at least 47 public companies now hold Bitcoin on their balance sheets, collectively owning 278,000 BTC. This corporate adoption trend creates persistent bid-side pressure independent of retail sentiment.
Halving Dynamics: History and Expectations
The April 2024 halving will be Bitcoin's fourth, reducing block rewards from 6.25 to 3.125 BTC. Historical precedent shows consistent patterns in pre- and post-halving price behavior:
- 2012 Halving (Nov): Bitcoin ranged -10% to +15% in the two months prior, then rallied 8,000% over the following year
- 2016 Halving (July): Pre-halving consolidation (-8% to +18%), followed by 2,800% gain over 18 months
- 2020 Halving (May): Tight range ($8,500-$10,000) beforehand, then 640% rally to $69,000 by November 2021
Pattern recognition suggests we're in the classic pre-halving consolidation phase. The current $69,200-$72,500 range mirrors historical behavior where markets digest supply reductions before explosive moves.
Stock-to-Flow Model: Still Relevant?
Bitcoin's stock-to-flow ratio (existing supply divided by annual production) will jump from 56 to 112 post-halving. This puts Bitcoin's scarcity roughly equal to gold's stock-to-flow of 62-but with exponentially higher growth trajectory. The S2F model, despite criticism, has predicted long-term trends with remarkable accuracy, projecting fair value of $100,000-$130,000 for the 2024-2025 cycle.
While short-term price movements are chaotic, the long-term supply shock thesis remains mathematically sound. Only 1.4 million Bitcoin remain to be mined over the next 116 years. With institutional demand increasing and supply decreasing, the fundamental case strengthens.
Macroeconomic Backdrop: The Fed Factor
Bitcoin doesn't trade in a vacuum. The Federal Reserve's policy stance significantly influences risk assets, including crypto. Current macro conditions present a mixed picture:
Inflation and Interest Rate Outlook
The January CPI print came in at 3.1% year-over-year-slightly above the Fed's 2% target but down from 3.4% in December. Core inflation (excluding food and energy) remained sticky at 3.9%. Fed Chair Powell indicated in January that rate cuts are not imminent, likely pushing any reduction to Q3 2024 at earliest.
For Bitcoin, this is actually neutral-to-positive. While higher rates theoretically pressure speculative assets, the market has already priced in a "higher for longer" scenario. Bitcoin's rally from October 2023 lows occurred during this same rate environment-institutional narrative has shifted from "Fed put" dependence to "digital gold" thesis.
Dollar Strength and Liquidity Conditions
The DXY Dollar Index trades at 104.25-moderately strong but off recent highs. Generally, dollar strength pressures Bitcoin, but the relationship has weakened. Global liquidity conditions matter more: M2 money supply has begun expanding again after 18 months of contraction, providing fuel for risk assets.
China's economic stimulus efforts and European Central Bank dovishness add to global liquidity. As international capital seeks returns outside struggling sovereign bonds, Bitcoin benefits from currency debasement narratives across multiple economies.
Strategic Positioning: How to Play This Setup
Given current technicals, on-chain metrics, and macro backdrop, here's how sophisticated traders are approaching Bitcoin at $70,900:
For Long-Term Investors (1+ Year Horizon)
The fundamental case for accumulation remains robust. Dollar-cost averaging through the current consolidation phase reduces timing risk while building positions ahead of the halving supply shock. Target allocation: 5-10% of liquid portfolio for aggressive investors, 2-5% for moderate risk tolerance.
Key consideration: If you believe Bitcoin reaches $100,000-$150,000 in the next 12-18 months (consensus analyst range), buying between $69,000-$72,000 represents a favorable entry with 40-110% upside versus limited 20-30% downside to technical support zones.
For Swing Traders (2-6 Week Horizon)
The trade setup favors patience and defined entries. This isn't a market for impulsive decisions-it's a coiling spring waiting for catalyst. Two distinct scenarios present:
Trade Plan
Scenario A: Bullish Breakout (Primary, 65% Probability)
- Direction: Long
- Entry Trigger: 4H close above $72,500 with volume exceeding 20-day average
- Target 1: $76,800 (previous local high, ~6% gain)
- Target 2: $82,500 (psychological resistance, ~16% gain)
- Stop/Invalidation: 4H close below $69,200 support
- Position Size: 3-5% of trading capital
- Risk/Reward: 1:3.2 to first target, 1:8 to second target
Rationale: Breakout above range high with volume confirms institutional participation. Halving narrative plus technical breakout typically attracts momentum algorithms and retail FOMO, driving accelerated moves.
Scenario B: Range Breakdown (Alternative, 35% Probability)
- Condition: Failure to hold $69,200 support + negative macro catalyst (Fed hawkishness, regulatory concerns)
- Entry Trigger: 4H close below $69,200, then wait for retest of breakdown level as resistance
- Target: $64,500-$66,000 zone (200-day moving average confluence)
- Invalidation: Immediate reclaim above $69,200 within 24 hours
- Position Size: 2-3% of trading capital (lighter due to countertrend)
Rationale: If support breaks, scared money exits quickly. However, strong on-chain accumulation suggests this would be a flush, not a trend reversal-creating re-entry opportunity at better prices.
Event Risk: February 13-14 features CPI release and retail sales data. Volatility will spike around these prints. Consider reducing position size by 40-50% before major data releases, then scaling back after direction clarifies.
Risk Management: Non-Negotiable Rules
Even the best setups fail. Professional traders survive through discipline:
- ✓ Never risk more than 2% of capital on a single trade
- ✓ Use stop-losses religiously-hope is not a strategy
- ✓ Scale into positions: 40% initial, 30% on confirmation, 30% reserved
- ✗ Don't chase breakouts after 3%+ moves-wait for pullbacks
- ✗ Avoid overleveraging: 2-3x maximum, even for experienced traders
Catalysts to Watch: What Could Move Markets
Several potential catalysts could break Bitcoin out of consolidation over the next 2-4 weeks:
Upside Catalysts
- Continued ETF Inflows: Sustained $500M+ weekly inflows would signal institutional confidence
- Halving Countdown Media: As April approaches, mainstream coverage intensifies, attracting retail interest
- Fed Dovish Pivot: Any hint of earlier rate cuts boosts risk assets broadly
- Sovereign Adoption: Rumors persist of additional nation-states considering Bitcoin reserves (El Salvador model)
- Miner Inventory Squeeze: If miners hold coins post-halving, reduced liquid supply accelerates price discovery
Downside Risks
- Regulatory Crackdown: SEC enforcement actions against exchanges or stablecoin issuers create uncertainty
- Macro Shock: Unexpected Fed hawkishness, geopolitical crisis, or financial system stress trigger risk-off flows
- Technical Breakdown: Loss of $65,000 psychological level could trigger algorithmic sell programs
- ETF Outflows: If institutional appetite reverses, supply/demand dynamics shift quickly
Sentiment Analysis: What the Crowd Is Thinking
Crypto Fear & Greed Index currently reads 62 (Greed)-up from 48 (Neutral) three weeks ago but well below the 78-82 (Extreme Greed) levels that marked local tops in 2023. This suggests room for upside without immediate bubble concerns.
Social media sentiment (measured by Santiment's weighted sentiment) shows increasing positivity, but not yet at euphoric levels that signal tops. Google Trends for "Bitcoin halving" has risen 340% since December but remains 60% below 2020 peak interest-early innings of awareness cycle.
Funding rates on perpetual futures are slightly positive (+0.008% 8-hourly), indicating modest leverage but nothing extreme. Excessive positive funding (above +0.03%) historically precedes corrections as overleveraged longs get liquidated.
Closing Perspective: Patience and Positioning
Bitcoin at $70,900 isn't screaming "buy now" or "sell immediately"-it's whispering "position wisely." The consolidation phase frustrates impatient traders but rewards those who understand market cycles.
On-chain metrics overwhelmingly suggest accumulation by sophisticated players. Institutional flows via ETFs create structural demand that didn't exist in previous cycles. The halving supply shock approaches with mathematical certainty. Macro conditions, while imperfect, don't present showstopping headwinds.
Does this guarantee Bitcoin rallies to six figures? Of course not. Markets are probabilistic, not deterministic. But the risk/reward profile favors positioning for upside while managing downside through prudent stops and position sizing.
Şimdi ne yapmalı? If you're not already positioned, wait for your setup-either the $72,500 breakout or a dip toward $66,000-$67,000 support. If you're already holding, consider this consolidation a gift: it's giving you time to accumulate more without paying premium prices.
📊 Technical Overview Summary
| Indicator | Value | Signal | Interpretation |
|---|---|---|---|
| Price | $70,900 | Consolidation | Range-bound between $69,200-$72,500 |
| RSI (14) | 52.3 | Neutral | Balanced, no extreme conditions |
| MACD Histogram | +125 | Weakening Bull | Positive but momentum fading |
| ADX | 23.5 | Weak Trend | Choppy, directionless market |
| Volume (30-day avg) | 28,500 BTC | Moderate | Steady but not exceptional |
| Trend (Daily) | Neutral | Range | Awaiting breakout catalyst |
| On-Chain Signal | Accumulation | Bullish | Exchange reserves declining, LTH increasing |
🎯 Critical Levels
Support Levels
Resistance Levels
Piyasaları canlı takip edin
AI destekli analizler, teknik göstergeler ve anlık fiyat verileri.
Telegram Kanalımıza Katılın
Son dakika piyasa haberleri, AI analizleri ve trading sinyalleri.
Kanala Katıl