BRENT Climbs to $65.73: Bulls Eyeing Next Week's PMI Data
BRENT crude oil closed the week at $65.73, buoyed by a weaker dollar and anticipation of upcoming PMI data. Traders are watching key resistance levels after a volatile week.
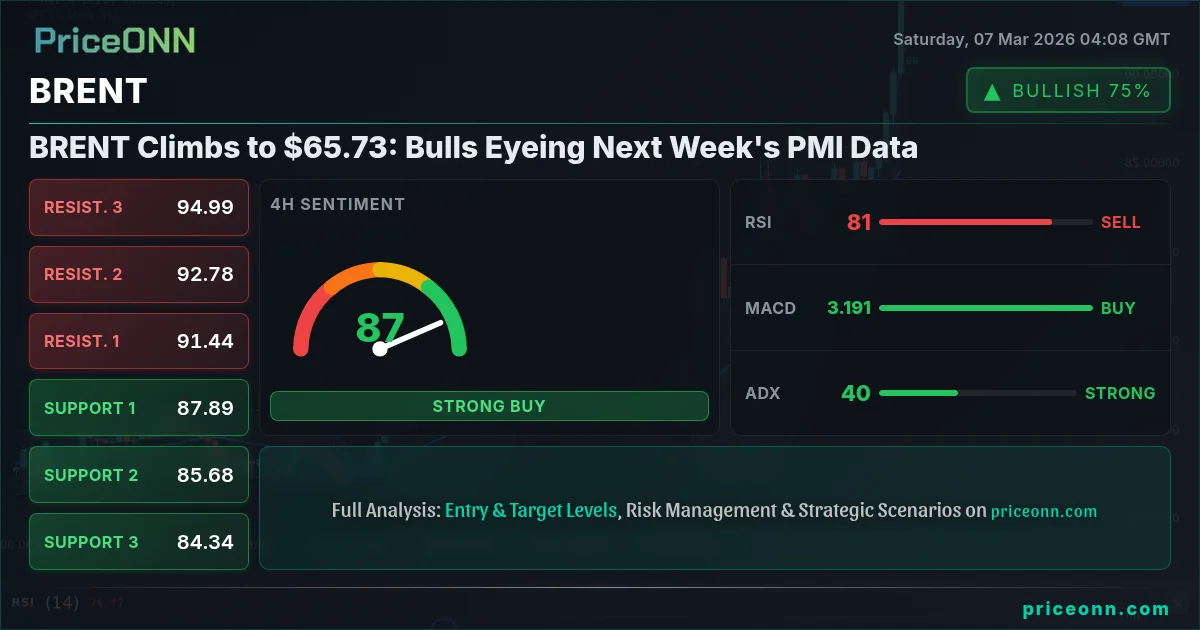
Oil markets are displaying cautious optimism as BRENT crude closed the week at $65.73, a nearly 2% gain on the day, but traders are looking ahead to next week's Purchasing Managers' Index (PMI) data for further directional cues. The energy complex has been whipsawed by geopolitical tensions and fluctuating risk sentiment, but the upcoming economic releases could provide a clearer picture of global demand.
- BRENT closed at $65.73, up 1.96% on Friday, amid fluctuating risk sentiment.
- Key resistance lies at $65.42, with potential upside to $66.36 if bullish momentum persists.
- ADX at 19.03 on the 1H chart signals a weak trend, suggesting potential consolidation.
- Upcoming PMI data and geopolitical developments will be critical drivers next week.
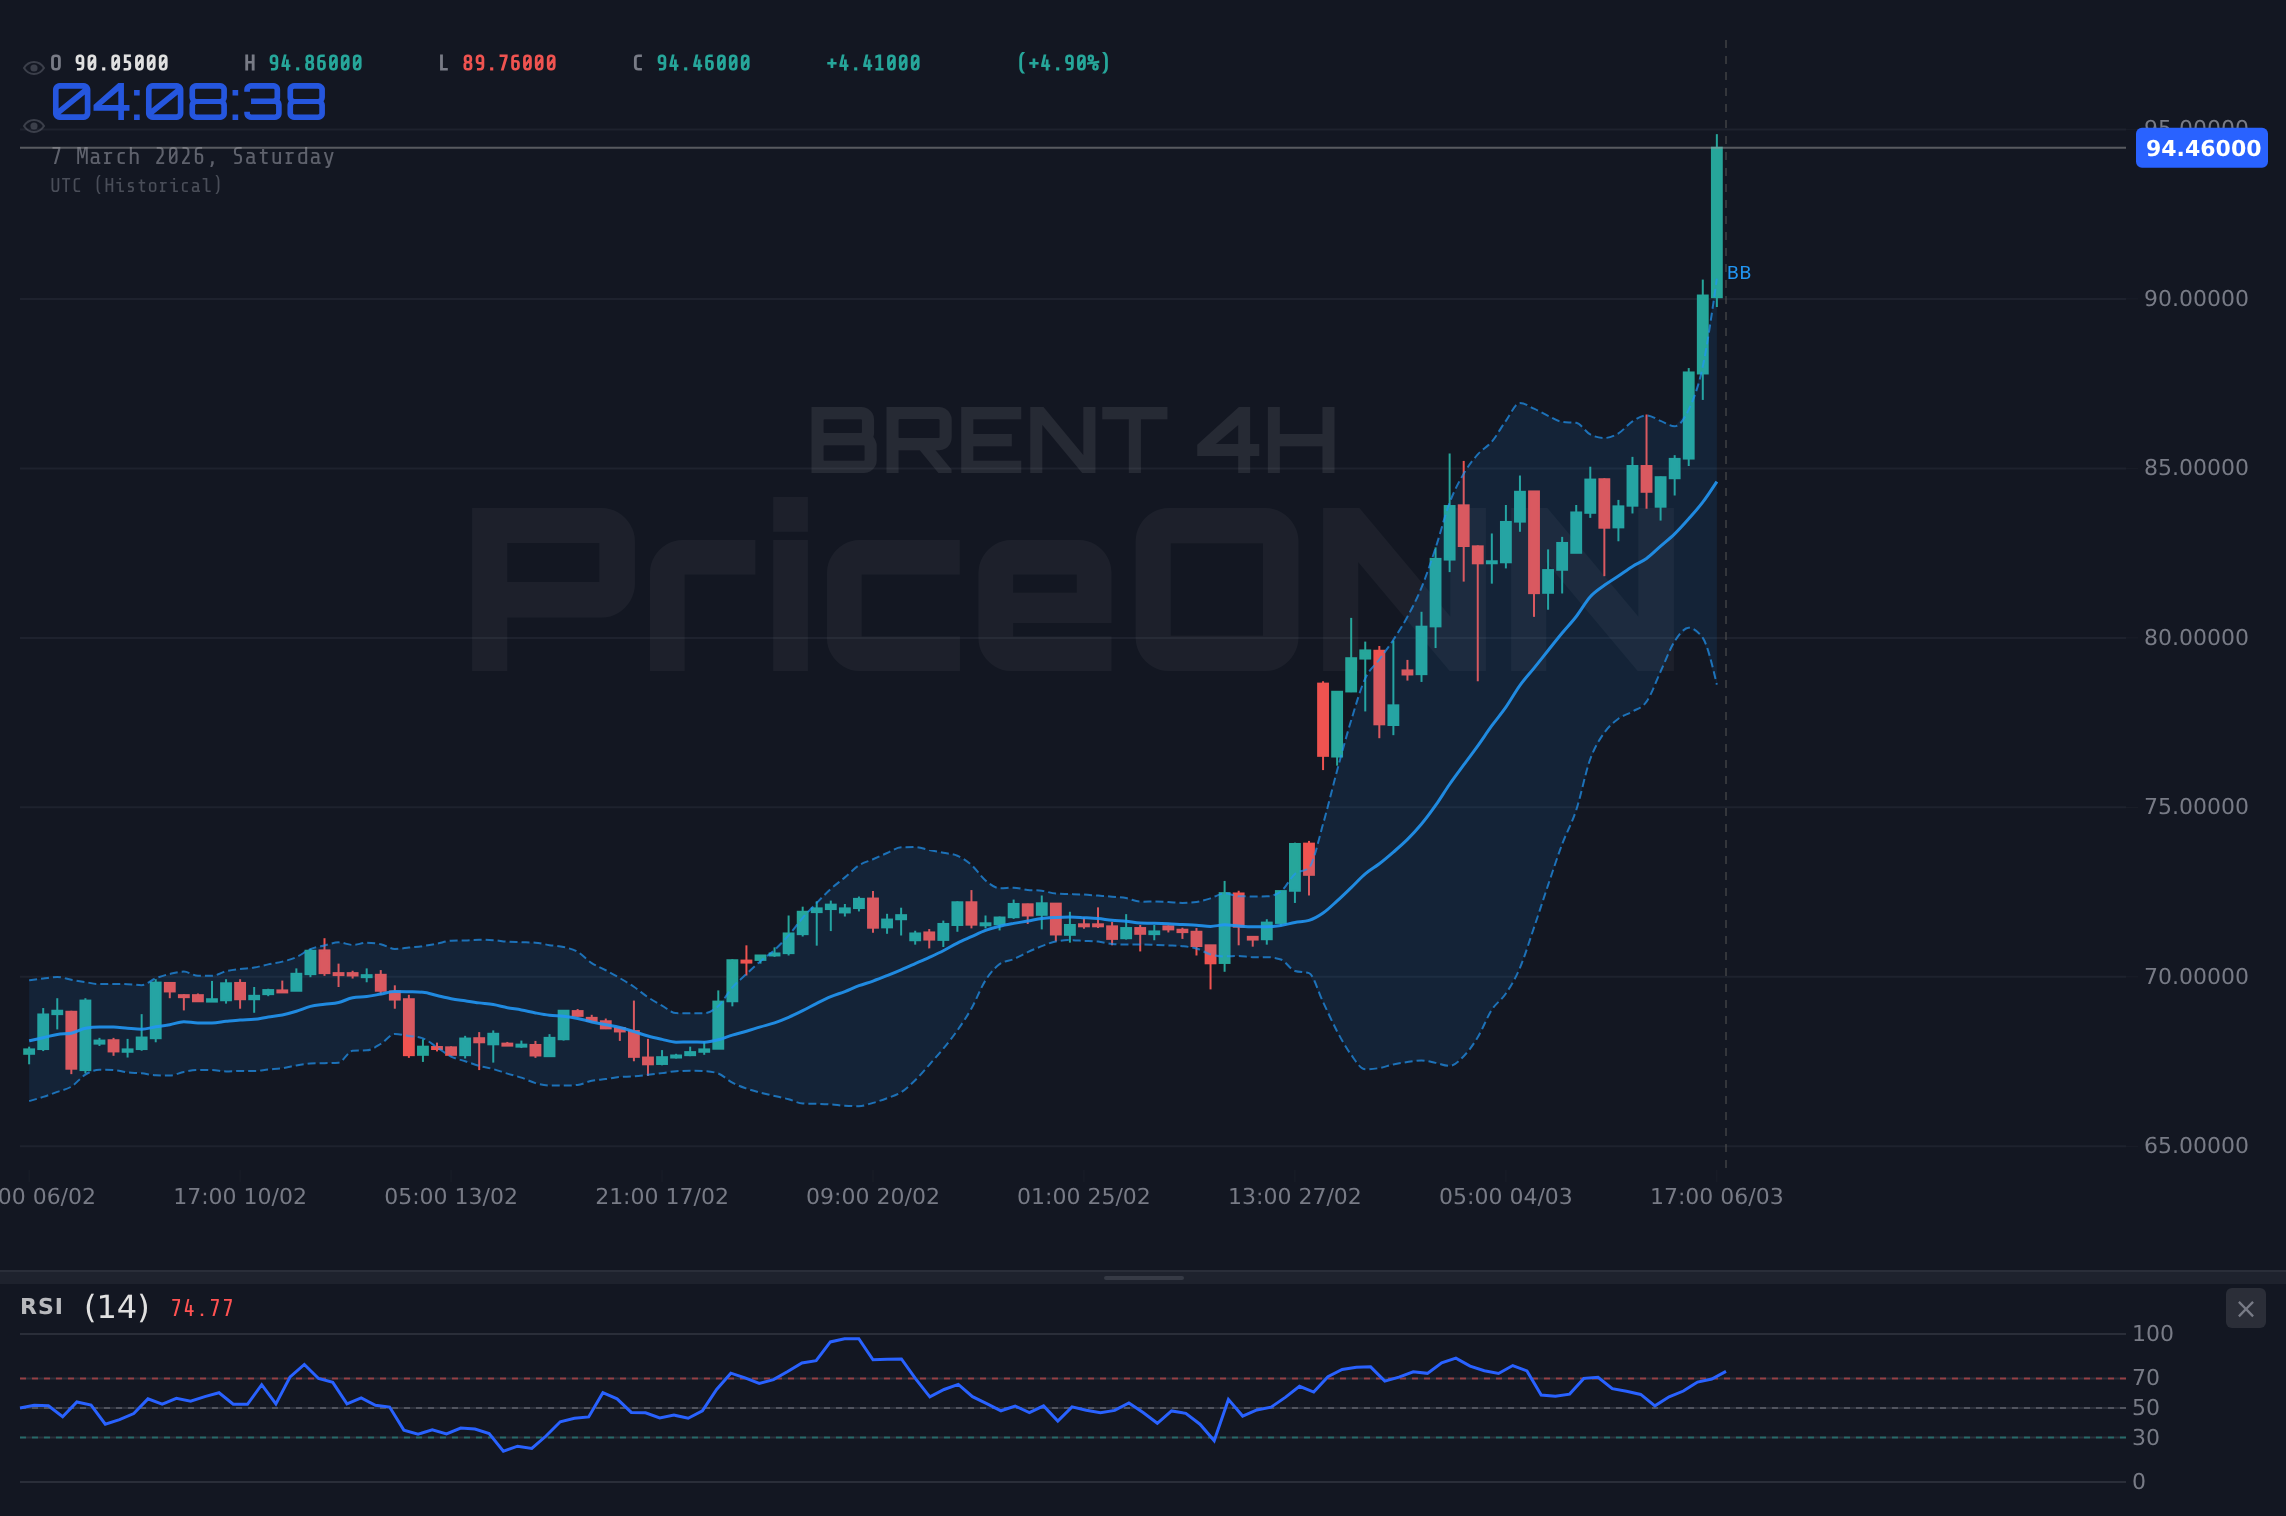
The recent surge in oil prices, with WTI jumping over 15% to $90.81, has largely been fueled by escalating tensions in the Middle East, specifically concerns surrounding the Strait of Hormuz. This critical chokepoint for global oil supply has traders on edge, with some analysts predicting a potential spike to $100 or even $120 per barrel if the situation deteriorates further. PriceONN market news highlighted this concern, noting that Hormuz tensions are driving tanker rates to multi-year highs. However, BRENT's more muted response indicates a degree of skepticism, perhaps reflecting concerns about global demand or the ability of other producers to offset any supply disruptions.
Geopolitical Risks and Market Sentiment
The geopolitical backdrop is undeniably complex. As NZD/USD and USD/MXN are impacted by Middle East tensions, the energy market is also affected. The Middle East conflict continues to be a key factor influencing oil prices. While the potential for supply disruptions is a major concern, it's also important to consider the broader impact on global economic growth. A prolonged conflict could dampen demand, offsetting some of the upward pressure on prices. For instance, with the DXY at 98.71, putting pressure on commodities like oil, the strength of the dollar could temper further gains in BRENT.
Market sentiment is equally volatile. Risk appetite has been fluctuating, with the SP500 currently down 1.16% and the Nasdaq100 down 1.31%. This risk-off environment could limit the upside for BRENT, as investors seek safer havens. The forex market is also bracing for volatility ahead of US jobs data, with USD/JPY testing 158.00 and EUR/USD under pressure, according to recent reports. These currency movements can have a significant impact on commodity prices, particularly for oil, which is priced in dollars.
The Goldman Sachs forecasts noted by PriceONN, Goldman Sachs Raises Brent Forecast to $76 Amidst Middle East Tensions, have also played a role in shaping market expectations. While these forecasts provide a useful benchmark, it's important to remember that they are based on a range of assumptions that can change rapidly. The surge in oil prices is prompting some to consider increasing output amid these tensions. This could potentially ease supply concerns and limit further price increases.
Technical Analysis: BRENT at a Crossroads
From a technical perspective, BRENT is currently trading at a critical juncture. The 1-hour chart shows a neutral trend, with the ADX at a weak 19.03. This suggests that the recent rally may be losing steam, and the market could be entering a period of consolidation. Immediate resistance lies at $65.41, with further upside potential to $66.36 if the bulls can regain control. Support, on the other hand, can be found at $65.20 and $65.10. A break below these levels could signal a deeper correction.
The 4-hour chart paints a slightly more bullish picture, with the trend identified as bullish, albeit with only 82% strength. The RSI at 62.33 is neutral, suggesting that there is still room for further upside before the market becomes overbought. Key resistance on this timeframe lies at $65.01, $65.22, and $65.52. A sustained break above these levels could pave the way for a test of higher targets. However, the ADX remains relatively weak at 13.59, indicating a lack of strong conviction behind the current rally.
Looking at the daily chart, the trend is identified as bullish with a strength of 89%. The RSI at 59.99 is also neutral, suggesting that there is still potential for further upside. Key resistance on this timeframe lies at $65.42, $66.36, and $67.23. Support, on the other hand, can be found at $63.61, $62.74, and $61.80. The MACD is showing positive momentum, supporting the bullish outlook. However, the Stochastic oscillator is showing a bearish crossover, which could signal a potential pullback.
The overall signal for BRENT is "AL" (Buy) according to the data provided. However, traders should be cautious and consider the conflicting signals from the various timeframes and indicators. The weak ADX readings suggest that the current rally may not be sustainable, and a period of consolidation or correction could be in the cards.
The Impact of Economic Data: Next Week's PMI
Next week's PMI data will be crucial in determining the next direction for BRENT. A strong reading would signal robust global demand, supporting higher prices. Conversely, a weak reading would raise concerns about a potential slowdown, putting downward pressure on prices. Traders will be closely watching the data from major economies, including the US, China, and Europe. Any surprises could trigger significant volatility in the oil market.
The recent U.S. Weekly Economic & Financial Commentary has been uniformly negative, and the U.S. Week In Review noted that the February jobs report slipped by 92K. The Forex Market Awaits US Jobs Data: USD/JPY Eyes 158.00, EUR/USD Under Pressure. These data points could have an impact on the dollar, thus affecting BRENT prices inversely. Traders should also pay attention to other economic releases, such as inflation data and interest rate decisions from central banks. These factors can all influence the overall demand for oil and, consequently, its price.
Middle East tensions are also relevant. Middle East Conflict Drives Oil Surge: Implications for New Zealand and WTI Crude - Escalating tensions in the Middle East have triggered a significant surge in crude oil prices, particularly WTI, presenting both opportunities and risks for New Zealand's economy. WTI Crude Oil Surges: Qatar's $150 Forecast Amid Middle East Tensions. Escalating tensions in the Middle East have triggered a significant rally in crude oil prices, driven by geopolitical tensions and a forecast from Qatar's Energy Minister. This creates more uncertainty for the BRENT market.
The key is to manage risk effectively and wait for the right setup. The market always gives a second chance. The oil price forecast mentioned that Middle East Conflict Could Send Brent to $100. Thus, traders should be prepared for volatility and potential for a sharp rise in prices, depending on further geopolitical developments.
The upcoming FOMC meetings also need to be considered. The Fed's decision on interest rates will have a significant impact on the dollar, which, in turn, will affect commodity prices. If the Fed signals a more hawkish stance, the dollar is likely to strengthen, putting downward pressure on BRENT. Conversely, a more dovish stance would weaken the dollar, supporting higher prices.
Trade Recommendation
Based on the current technical and fundamental outlook, a clear trade recommendation is not supported. The ADX at 13.59 indicates that the market is choppy and ranging, making any trade plan risky. While the RSI and MACD histogram are aligned, providing a clear directional signal, the Stochastic oscillator is in an extreme zone, making entry timing uncertain. Therefore, it is best to remain on the sidelines and wait for a clearer signal before entering a trade.
Frequently Asked Questions: BRENT Analysis
Is BRENT a good buy right now?
BRENT is at $65.73. While there's bullish momentum, the weak ADX suggests consolidation. Wait for a breakout above $65.41 with strong volume for a potential long entry.
What is the BRENT price forecast for this week?
The forecast hinges on PMI data. A strong reading could push BRENT to $66.36, while a weak reading could see it test support at $65.20.
What are the key support and resistance levels for BRENT?
Key support levels are $65.20 and $65.10. Resistance levels to watch are $65.41 and $66.36, based on the 1H chart.
Why is BRENT moving today?
BRENT is moving today due to a weaker dollar and anticipation of next week's PMI data, although geopolitical tensions remain a factor.
Track markets in real-time
AI-powered analysis, technical indicators and real-time price data.
Join Our Telegram Channel
Breaking market news, AI analysis and trading signals instantly.
Join Channel