

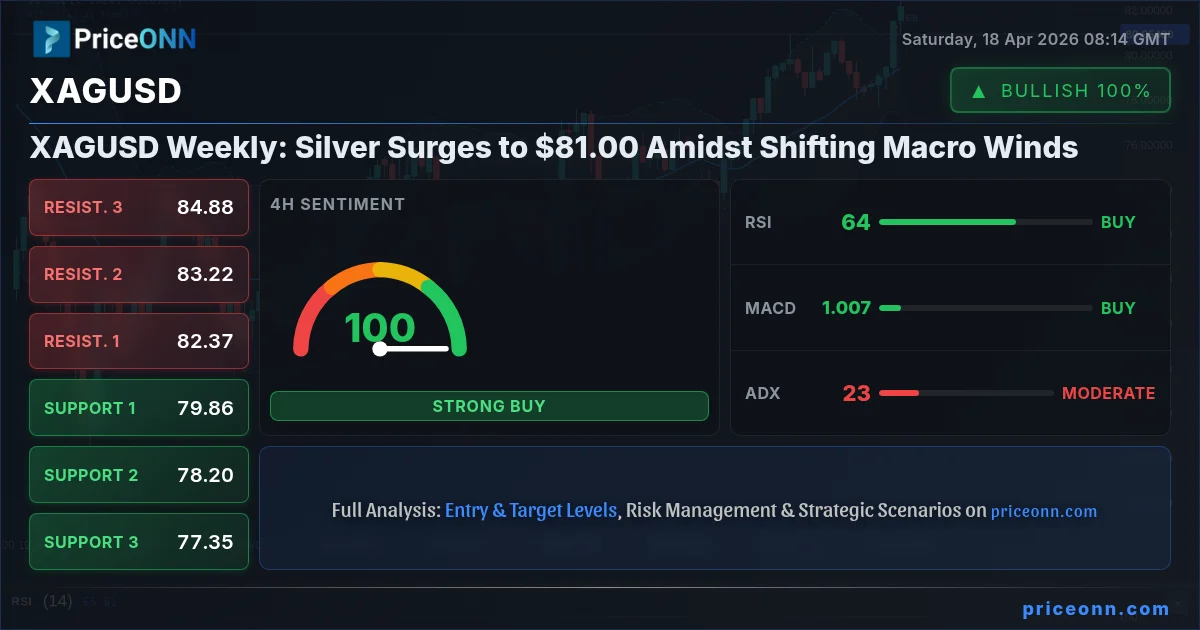
The past week has painted a compelling picture for silver, with XAGUSD closing Friday at a robust $81.00 after a significant 3.32% gain. This upward momentum, driven by a confluence of factors ranging from cooling inflation data to geopolitical undercurrents and a weakening US Dollar, suggests that the precious metal is carving out a potentially bullish path forward. As traders digest these developments, the critical question becomes: can this rally sustain, and what key levels will dictate silver's trajectory in the coming week?
- Silver (XAGUSD) closed the week at $81.00, up 3.32% after a strong showing.
- The US Dollar Index (DXY) is trading near 97.90, showing signs of weakness that typically supports silver prices.
- Key support for XAGUSD is identified at $77.35, while resistance lies at $80.13 and potentially higher.
- Geopolitical tensions, particularly concerning the Strait of Hormuz, are adding a hawkish undertone to commodity markets.
- Technical indicators like RSI at 63.99 on the 4H chart suggest further upside potential, though daily Stochastic indicates overbought conditions.
Navigating the Currents: Macroeconomic Crosscurrents and Silver's Ascent
The Dollar's Dance and Inflationary Echoes
The narrative surrounding silver's recent surge is intrinsically linked to the broader macroeconomic landscape, particularly the performance of the US Dollar Index (DXY) and evolving inflation expectations. With the DXY currently hovering around 97.90, exhibiting a slight pullback from recent highs, the pressure on dollar-denominated assets like silver has eased. Historically, a weaker dollar often correlates with stronger commodity prices, as it makes these assets cheaper for holders of other currencies. This inverse relationship is a cornerstone of commodity analysis, and its current manifestation provides a fertile ground for silver's bullish sentiment.
Furthermore, the recent economic data, particularly concerning inflation, has played a crucial role. While specific US inflation figures were not detailed in the provided economic calendar for the last 3 days, the broader context of rising gasoline prices, as indicated by the surge in WTI and Brent crude oil futures, suggests persistent inflationary pressures. Reports mentioning a 26% surge in gasoline prices and Canadian inflation potentially crossing 3% due to oil costs underscore this inflationary concern. In an environment where inflation remains a significant market driver, precious metals like silver often act as a hedge, attracting investor capital seeking to preserve purchasing power. This dynamic amplifies the demand for silver, providing a fundamental tailwind to its price action.
The market's reaction to these inflationary signals is multifaceted. On one hand, rising energy prices can be a double-edged sword. While they can support precious metals as inflation hedges, they also raise concerns about consumer spending and economic growth. The anticipation surrounding upcoming US retail sales data, which is expected to show an upswing driven by gasoline prices, highlights this tension. If consumer resilience falters under the weight of higher costs, it could dampen risk appetite and impact commodities across the board. However, for now, the narrative appears to favor commodities, with silver benefiting from the inflation hedge narrative.
Geopolitical Tensions Add Fuel to the Fire
Adding another layer to silver's bullish case are the simmering geopolitical tensions, particularly in the Middle East. News regarding Iran's announcement to reopen the Strait of Hormuz, while seemingly a de-escalation, still leaves a backdrop of fragile stability. Such geopolitical events, even if they lead to a temporary easing of direct conflict fears, often create underlying uncertainty that bolsters demand for safe-haven assets. Gold, silver's traditional safe-haven counterpart, saw a significant surge to $4,885.50 following these developments, as reported by Forex news outlets. This movement in gold often serves as a leading indicator or at least a strong correlative signal for silver.
The reopening of the Strait of Hormuz, a critical chokepoint for global oil supply, has had a dramatic impact on crude oil prices, with reports indicating a 10% collapse in WTI and Brent. This unexpected plunge in oil prices, despite the geopolitical backdrop, introduces a new dynamic. Typically, rising oil prices correlate with inflation and can boost precious metals. The sharp decline in oil, however, might suggest that market participants had perhaps over-anticipated a larger supply disruption or that other factors are now weighing more heavily on energy markets. For silver, this could mean a slight tempering of the inflation hedge narrative if energy prices continue to fall, but the immediate effect is overshadowed by the broader safe-haven demand stemming from the region's instability.
The interplay between these geopolitical events and commodity markets is complex. While the oil price collapse might seem counterintuitive to a bullish commodity outlook, the underlying geopolitical risk premium remains. Silver, often seen as a more industrial metal than gold but still possessing safe-haven characteristics, can benefit from both inflation hedging and a general increase in risk aversion. The market's reaction to the Strait of Hormuz news, despite the oil price drop, highlights the persistent demand for assets that can preserve value amidst global uncertainty. This persistent demand, coupled with the dollar's current weakness, creates a supportive environment for XAGUSD.
Technical Read on XAGUSD: Charting the Path Forward
Daily Timeframe: A Mixed Signal with Bullish Undertones
On the daily chart, XAGUSD is currently trading at $81.00, reflecting a neutral trend with a 50% strength. The price action has been consolidating, with key support identified at $4763, $4735.45, and $4697.96, while resistance levels are observed at $4828.04, $4865.53, and $4893.08. The Relative Strength Index (RSI) stands at 53.91, indicating a neutral position but with a slight upward inclination, suggesting that momentum is gradually building on the buy side. The Moving Average Convergence Divergence (MACD) indicator shows positive momentum, with the MACD line positioned above its signal line, reinforcing the potential for an upward move.
However, the Stochastic Oscillator presents a conflicting signal. With K at 75.02 and D at 77.9, it suggests an overbought condition and a potential pullback. This divergence between the MACD and Stochastic warrants caution. The Average Directional Index (ADX) at 22.43 indicates a moderately trending market, leaning towards a downward trend, which contradicts the MACD's positive momentum. Despite these mixed signals on the daily chart, the overall signal leans towards BUY (Al: 6, Sat: 2, Nötr: 0), suggesting that the bullish forces are currently outweighing the bearish indicators. This implies that while short-term corrections are possible, the broader sentiment remains positive.
4-Hour Chart: Strong Uptrend Confirmation
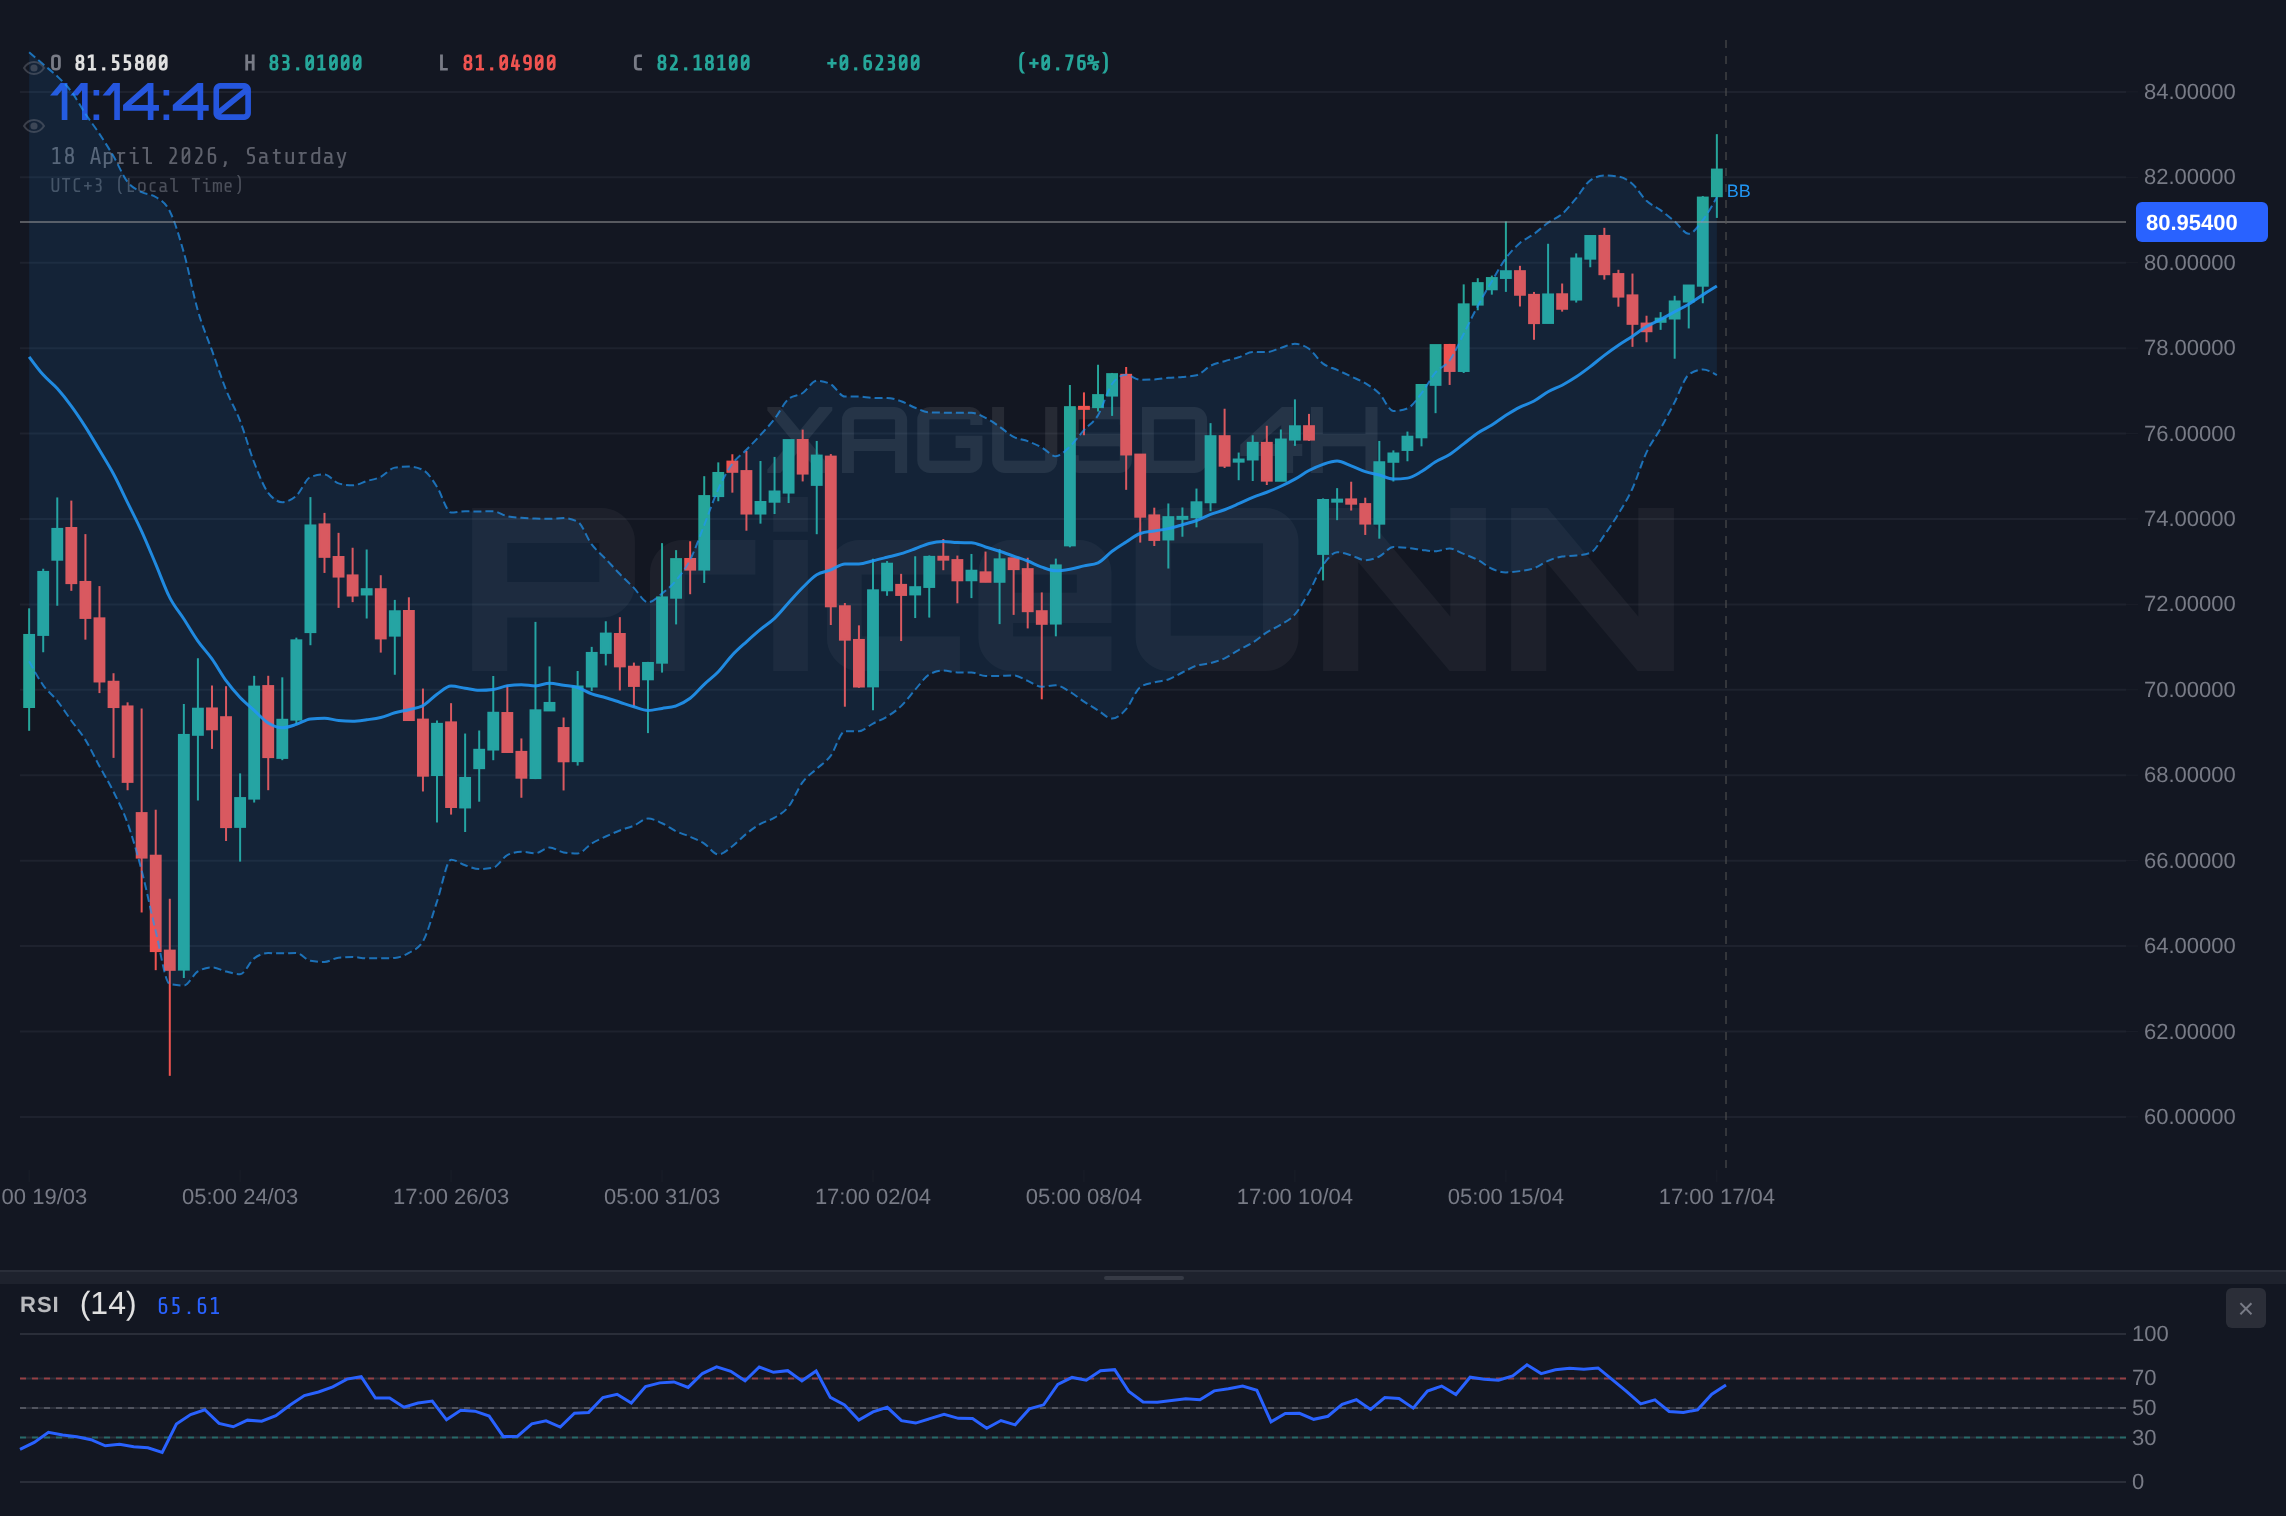
The 4-hour timeframe offers a more robust bullish outlook for XAGUSD. The trend is firmly established as bullish with a high strength of 95%. Support levels are clearly defined at $4803.12, $4759.83, and $4737.57, providing a solid floor for any potential retracements. Resistance is identified at $4868.67, $4890.93, and $4934.22, marking potential upside targets for the current rally. The RSI at 59.02 sits comfortably in neutral territory, showing a clear upward trend, indicating room for further price appreciation without immediate overbought conditions.
The MACD is exhibiting negative momentum on this timeframe, with the MACD line below its signal line, which might seem contradictory. However, the overall signal for the 4-hour chart is strongly AL (Al: 7, Sat: 1, Nötr: 0). The Stochastic Oscillator, with K at 64.4 and D at 44.28, confirms a bullish signal as %K is above %D, indicating upward momentum. The ADX at 20.46 suggests a moderately trending market, supporting the bullish bias. The combination of these indicators, particularly the strong overall signal and the Stochastic's confirmation, points towards continued strength in the short to medium term, provided the key support levels hold.
1-Hour Chart: Neutral Momentum Amidst Short-Term Fluctuations
On the 1-hour chart, the picture for XAGUSD is more neutral, with a trend strength of 50%. The immediate support levels are located at $81.25, $81.02, and $80.65, while resistance is seen at $81.85, $82.23, and $82.45. The RSI at 56.78 is in the neutral zone with an upward tendency, suggesting that buyers are still active. The MACD shows positive momentum, with the MACD line above its signal line, indicating potential for further upside in the immediate term. The Bollinger Bands are trading above the middle band, also suggesting a bullish inclination.
However, the Stochastic Oscillator presents a bearish signal, with K at 59.56 and D at 79.73, indicating that %K is below %D and suggesting a potential pullback. The ADX at 27.43 signifies a strong uptrend, which aligns with the overall positive sentiment. Despite the mixed signals from the Stochastic, the general consensus on the 1-hour chart leans towards BUY (Al: 6, Sat: 2, Nötr: 0). This suggests that while there might be short-term fluctuations or minor corrections, the underlying trend is still pushing higher. The key will be to observe if the price can consolidate above the $81.00 mark and break through the immediate resistance levels.
Intermarket Dynamics: XAGUSD in Context
The Shadow of the DXY and Equity Markets
The performance of silver is inextricably linked to broader market sentiment, often reflected in the movements of major indices like the S&P 500 and Nasdaq 100, as well as the US Dollar Index (DXY). Last week, the DXY showed signs of weakness, trading around 97.90. This decline in the dollar typically provides a tailwind for commodities, including silver. As the dollar weakens, assets priced in dollars become relatively cheaper for international buyers, potentially increasing demand and pushing prices higher. This dynamic has been a significant factor in silver's recent ascent, as seen on the 1-hour chart where the DXY's slight dip coincided with XAGUSD's upward movement.
Conversely, the performance of equity markets offers insights into risk appetite. The S&P 500 closed the week strong at 6572.87, up 0.74%, and the Nasdaq 100 also saw a significant gain of 1.45%, reaching 26682.75. These gains in major indices suggest a 'risk-on' environment, which might typically lead investors away from safe-haven assets like silver. However, the simultaneous strength in silver indicates that other factors, such as inflation hedging and geopolitical concerns, are currently overriding the typical risk-on/risk-off correlation. This complex interplay suggests that while equities are performing well, the demand for silver is being driven by a different set of fundamental catalysts.
The divergence between strong equity performance and the bullish trend in silver highlights the nuanced nature of market sentiment. While broad market risk appetite appears healthy, specific concerns about inflation and geopolitical stability are creating demand for precious metals independent of equity market movements. This is a crucial distinction for traders to make; simply assuming that a 'risk-on' equity market negates precious metal strength would be an oversimplification. The sustained upward pressure on XAGUSD, even amidst rising stocks, suggests a strong underlying bid driven by inflation and geopolitical factors.
Oil's Volatility and its Ripple Effect
The energy markets have been particularly volatile, with crude oil prices experiencing significant swings. Reports indicated a substantial 10% collapse in WTI and Brent crude prices, despite ongoing geopolitical tensions in the Middle East. This dramatic drop in oil prices presents an interesting dynamic for silver. Traditionally, oil price surges have been seen as inflationary, boosting silver's appeal as an inflation hedge. However, the recent sharp decline in oil, even with the Strait of Hormuz reopening, introduces a degree of uncertainty about the immediate inflationary outlook driven by energy costs.
If oil prices continue to fall, it could potentially reduce the urgency for investors to seek inflation hedges like silver. However, the narrative is not solely about energy-driven inflation. Geopolitical risks themselves can independently drive demand for safe-haven assets. The fact that gold prices surged to $4,885.50 following Iran's announcement, even as oil plunged, underscores this point. Silver, which often trades in correlation with gold, is likely benefiting from this broader safe-haven demand, irrespective of the oil price movements. The key takeaway is that while the energy market's influence on inflation is a factor, geopolitical risk is currently playing a more dominant role in supporting precious metals.
The significant daily change in both WTI (-6.71% at 86.42) and Brent (-6.93% at 92.54) highlights the choppiness in the energy sector. This volatility can spill over into other markets, creating uncertainty. For silver traders, monitoring oil price action is crucial, not just for its direct impact on inflation expectations but also for its potential to signal shifts in broader commodity market sentiment. However, given the current geopolitical backdrop, silver's safe-haven appeal might provide a degree of insulation from the most extreme downside risks that could affect other commodities.
Trading Scenarios and Key Levels for the Week Ahead
The Bullish Case: Breaking Higher
The bullish scenario for XAGUSD hinges on its ability to sustain momentum above the current price of $81.00 and decisively break through key resistance levels. The 4-hour chart, in particular, shows strong bullish conviction with an ADX of 20.46 indicating a moderately trending market. If silver can clear the immediate resistance at $81.85, it could pave the way for a move towards the next significant resistance at $82.23 and potentially higher towards $82.45. Confirmation of this bullish breakout would likely come from sustained buying pressure, strong volume, and a continued weakening of the US Dollar.
The daily chart's RSI at 53.91, while neutral, shows an upward trend, suggesting that there is still room for price appreciation. A break above the daily resistance at $4828.04 would be a strong signal. The overall signal on the daily chart is AL (Al: 6, Sat: 2, Nötr: 0), reinforcing the potential for upside. For this scenario to play out, key support levels around $81.25 and $81.02 must hold firm, preventing any significant pullback that could undermine the bullish sentiment. The trigger for this scenario would be a clear and sustained break above $81.85, with targets extending towards $82.23 and then $82.45. Invalidation would occur if the price closes decisively below $81.00.
The Bearish Case: Facing Resistance
Conversely, the bearish scenario anticipates a potential pullback or consolidation, particularly given the mixed signals on the daily chart and the Stochastic Oscillator indicating overbought conditions in some timeframes. The daily Stochastic, with K at 75.02 and D at 77.9, suggests that silver might be due for a correction. If XAGUSD fails to break through the immediate resistance at $81.85, it could retreat towards the support levels. The most critical support to watch on the 1-hour chart is $81.25, followed by $81.02 and $80.65.
A break below the $81.00 psychological level could trigger further selling pressure, potentially testing the $80.65 support. If this level gives way, the next significant support lies at $79.86 on the 4-hour chart. The daily support levels at $4763, $4735.45, and $4697.96 represent deeper downside targets if a more substantial reversal occurs. The trigger for this bearish scenario would be a failure to hold the $81.00 level, leading to a close below $80.65. Invalidation would occur if the price rallies and closes decisively above $82.45.
The Neutral Scenario: Consolidation and Waiting Game
A neutral scenario suggests that silver might enter a period of consolidation, trading within a defined range as market participants digest the recent gains and await clearer directional cues. The 1-hour chart, with its neutral trend strength and mixed indicator signals, lends itself to this possibility. Price could oscillate between the immediate support at $81.02 and resistance at $81.85, with the market seeking further fundamental catalysts or clearer technical signals to break the deadlock.
In this scenario, traders might look for confirmation from other correlated markets. For instance, a stabilization or slight recovery in the DXY, or a pause in the upward trend of equities, could lead to a period of sideways movement in silver. The ADX values across different timeframes show moderate to strong trending conditions, which might make prolonged consolidation less likely. However, if key economic data releases, such as upcoming retail sales figures or further central bank commentary, prove inconclusive, a period of range-bound trading is plausible. The trigger for this scenario would be the inability of price to decisively break either the key support or resistance levels within the next 24-48 hours, leading to a period of choppy, range-bound trading.
Bearish Scenario: Pullback to Support
40% ProbabilityNeutral Scenario: Consolidation Phase
30% ProbabilityBullish Scenario: Breaking Resistance
30% ProbabilityThe Week Ahead: Economic Calendar and Market Watchlist
Upcoming Economic Releases
The economic calendar for the upcoming week, while not explicitly detailed with specific dates beyond today's Saturday, April 18, 2026, will be crucial in shaping the direction of XAGUSD. Key high-impact events in the past three days included a significant drop in a USD-denominated manufacturing index (Actual: -0.913 vs Forecast: 2.1), a stronger-than-expected retail sales figure for GBP (Actual: 0.5 vs Forecast: 0.1), and a notable increase in EUR inflation (Actual: 2.6 vs Forecast: 2.5). These figures paint a picture of divergent economic performance across major economies, influencing currency pairs and, by extension, commodities.
Looking ahead, the market will be keenly watching for any further updates on inflation, central bank policy signals, and geopolitical developments. The anticipation of US retail sales data, expected to show an upswing driven by gasoline prices, will be a focal point. Any deviation from forecasts could trigger significant volatility in the US Dollar and, consequently, in silver. Additionally, continued monitoring of geopolitical news from the Middle East and its potential impact on oil prices and safe-haven demand will be paramount. The market's reaction to these unfolding events will likely determine whether silver can sustain its rally towards higher resistance levels or face a corrective pullback.
Key Levels to Monitor
For the upcoming week, traders should keep a close eye on the established support and resistance levels. On the daily chart, the critical support remains at $4763, with subsequent levels at $4735.45 and $4697.96. These levels are crucial for determining the broader trend. On the resistance side, the immediate hurdle is at $4828.04, followed by $4865.53 and $4893.08. A decisive move above these levels, particularly $4893.08, could signal a significant continuation of the bullish trend.
On the shorter timeframes, the $81.00 psychological level remains a key pivot point. Holding above this level on the 1-hour chart would be a positive sign, with resistance at $81.85 and $82.23. Conversely, a break below $80.65 could signal a short-term reversal, targeting the 4-hour support at $79.86. The interplay between these levels, coupled with the evolving macroeconomic and geopolitical landscape, will provide the roadmap for silver's movements in the days ahead. Traders are advised to manage risk diligently, as volatility remains a key characteristic of the current market environment.
| Indicator | Value | Signal | Interpretation |
|---|---|---|---|
| RSI (14) | 63.99 | Neutral | Upside potential remains, but watch for overbought conditions on shorter timeframes. |
| MACD Histogram | +0.78 | Bullish Momentum | Positive momentum on 4H, suggesting upward pressure. |
| Stochastic | K:72.23, D:41.37 | Bullish Crossover | Confirms upward movement on 4H, but daily Stochastic shows overbought. |
| ADX | 20.46 | Moderate Trend | Supports a trending environment, not indicating a choppy market. |
| Bollinger Bands | Middle Band | Above Middle Band | Price action above the middle band suggests bullish bias. |
Frequently Asked Questions: XAGUSD Analysis
What happens if XAGUSD breaks above the $82.92 resistance level?
A sustained break above the $82.92 resistance level on the daily chart would signal strong bullish momentum, potentially targeting higher levels not seen in recent price action. This would likely be confirmed by continued dollar weakness and positive macro-economic data, suggesting further upside towards $83.00 and beyond.
Is the current RSI level of 63.99 a buy signal for XAGUSD at $81.00?
An RSI of 63.99 on the 4-hour chart suggests a neutral to bullish leaning, indicating room for further upward movement without immediate overbought conditions. However, on the daily chart, the Stochastic is showing overbought signals, so caution is advised. A confirmation of strength above $81.85 resistance would strengthen the bullish case.
How will upcoming US retail sales data affect XAGUSD this week?
Stronger-than-expected US retail sales could bolster the US Dollar, potentially putting pressure on XAGUSD. Conversely, weaker-than-expected data might weaken the dollar and support silver's safe-haven appeal. Traders should watch for deviations from forecasts, as this could trigger significant volatility around the $81.00 mark.
Should I buy XAGUSD at current levels of $81.00 given the mixed signals?
Given the mixed signals, a cautious approach is recommended. The bullish case is supported by the 4H trend and positive momentum, but the daily Stochastic's overbought reading warrants attention. Waiting for a clear break above $81.85 resistance or a pullback to test support around $80.65 might offer a more defined risk/reward setup.
Track markets in real-time
AI-powered analysis, technical indicators and real-time price data.
Join Our Telegram Channel
Breaking market news, AI analysis and trading signals instantly.
Join Channel