

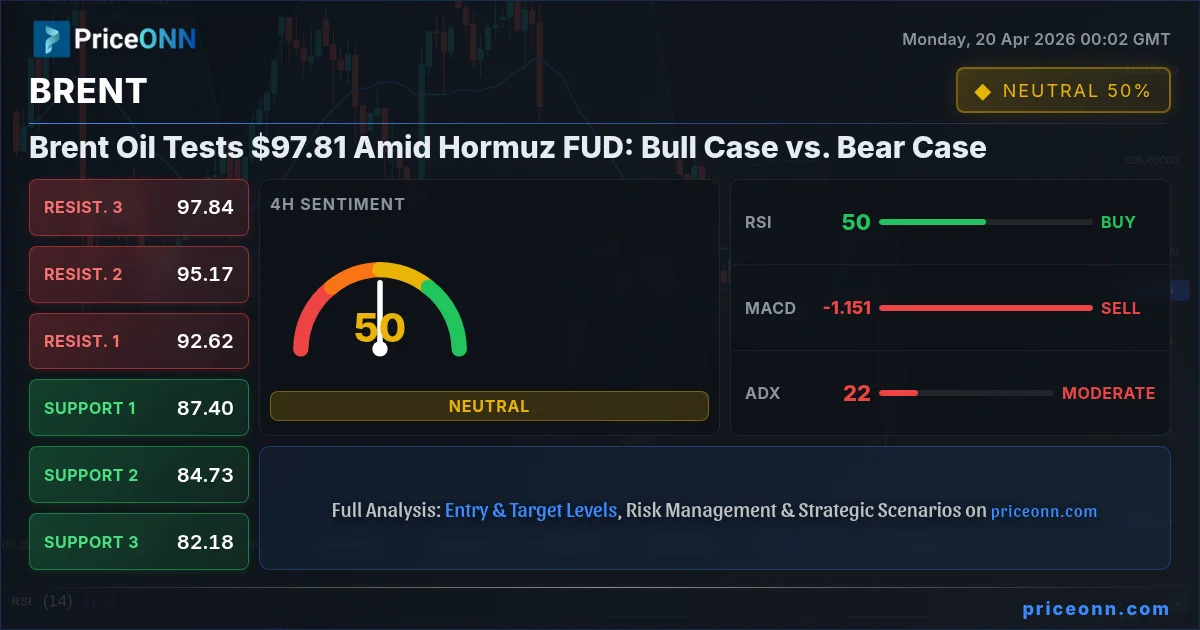
Brent crude oil is currently navigating a critical juncture, trading around the $97.81 mark. This price point is more than just a number; it's a battleground where bullish optimism clashes with bearish skepticism, fueled by renewed tensions surrounding the Strait of Hormuz. The market's reaction to these geopolitical whispers, coupled with a detailed technical breakdown, presents a complex picture for traders. Is the current price action a precursor to a significant move, or are we witnessing a temporary pause before a decisive trend emerges? This analysis delves into the competing narratives shaping the Brent market today.
- Brent oil is trading near $97.81, with the 1H chart showing a neutral trend (ADX: 21.89) and the 4H chart indicating a stronger bullish trend (ADX: 35.4).
- Critical support for Brent is identified at $96.41 (S1), while the immediate resistance lies at $101.86 (R1).
- The RSI on the 1H chart is at 57.53, suggesting upward momentum, but the MACD histogram shows negative momentum on the 4H chart, indicating potential selling pressure.
- Geopolitical concerns over the Strait of Hormuz are adding volatility, but the actual impact on supply remains to be seen.
The Bulls' Stand: Can Brent Climb Above $97.81?
Supply Constraints and OPEC+ Influence
On the supply side, the narrative remains tilted towards tightness, which has been a foundational pillar for the bullish case in crude oil markets. OPEC+ has demonstrated a consistent willingness to manage the market through production cuts, aiming to balance supply and demand and support higher prices. Saudi Arabia's commitment to voluntary cuts, often exceeding official quotas, continues to be a significant factor. Recent data, although not explicitly provided for OPEC+ production in this dataset, historically suggests that adherence to these cuts has been robust, leading to a tangible reduction in global supply. This deliberate scarcity creates a floor under prices, making substantial sell-offs less likely unless demand falters dramatically or non-OPEC supply surges unexpectedly. The market is keenly aware that any deviation from these supply management strategies by key producers could dramatically alter the price landscape, but for now, the discipline shown by OPEC+ provides a baseline of support for Brent.
Demand Resilience Amidst Global Uncertainty
While geopolitical risks often dominate headlines, the underlying demand for oil remains a critical driver. Despite global economic uncertainties and inflationary pressures, key economies are showing surprising resilience. China's economic recovery, though perhaps not as robust as initially hoped, still represents a significant source of demand growth. Its manufacturing sector and domestic consumption patterns are closely watched indicators. Furthermore, the reopening of economies post-pandemic, and the ongoing need for energy in transportation and industry, ensures a baseline level of consumption. While the 1H RSI for Brent at 57.53 suggests upward momentum, indicating buyers are stepping in, we must also consider the broader economic climate. High inflation, as seen in Canada's projected surge partly due to gasoline prices, can eventually dampen consumer spending and, consequently, oil demand. However, for the immediate term, the current demand picture, supported by strategic cuts, appears sufficient to keep prices elevated.
Technical Signals Supporting Upside
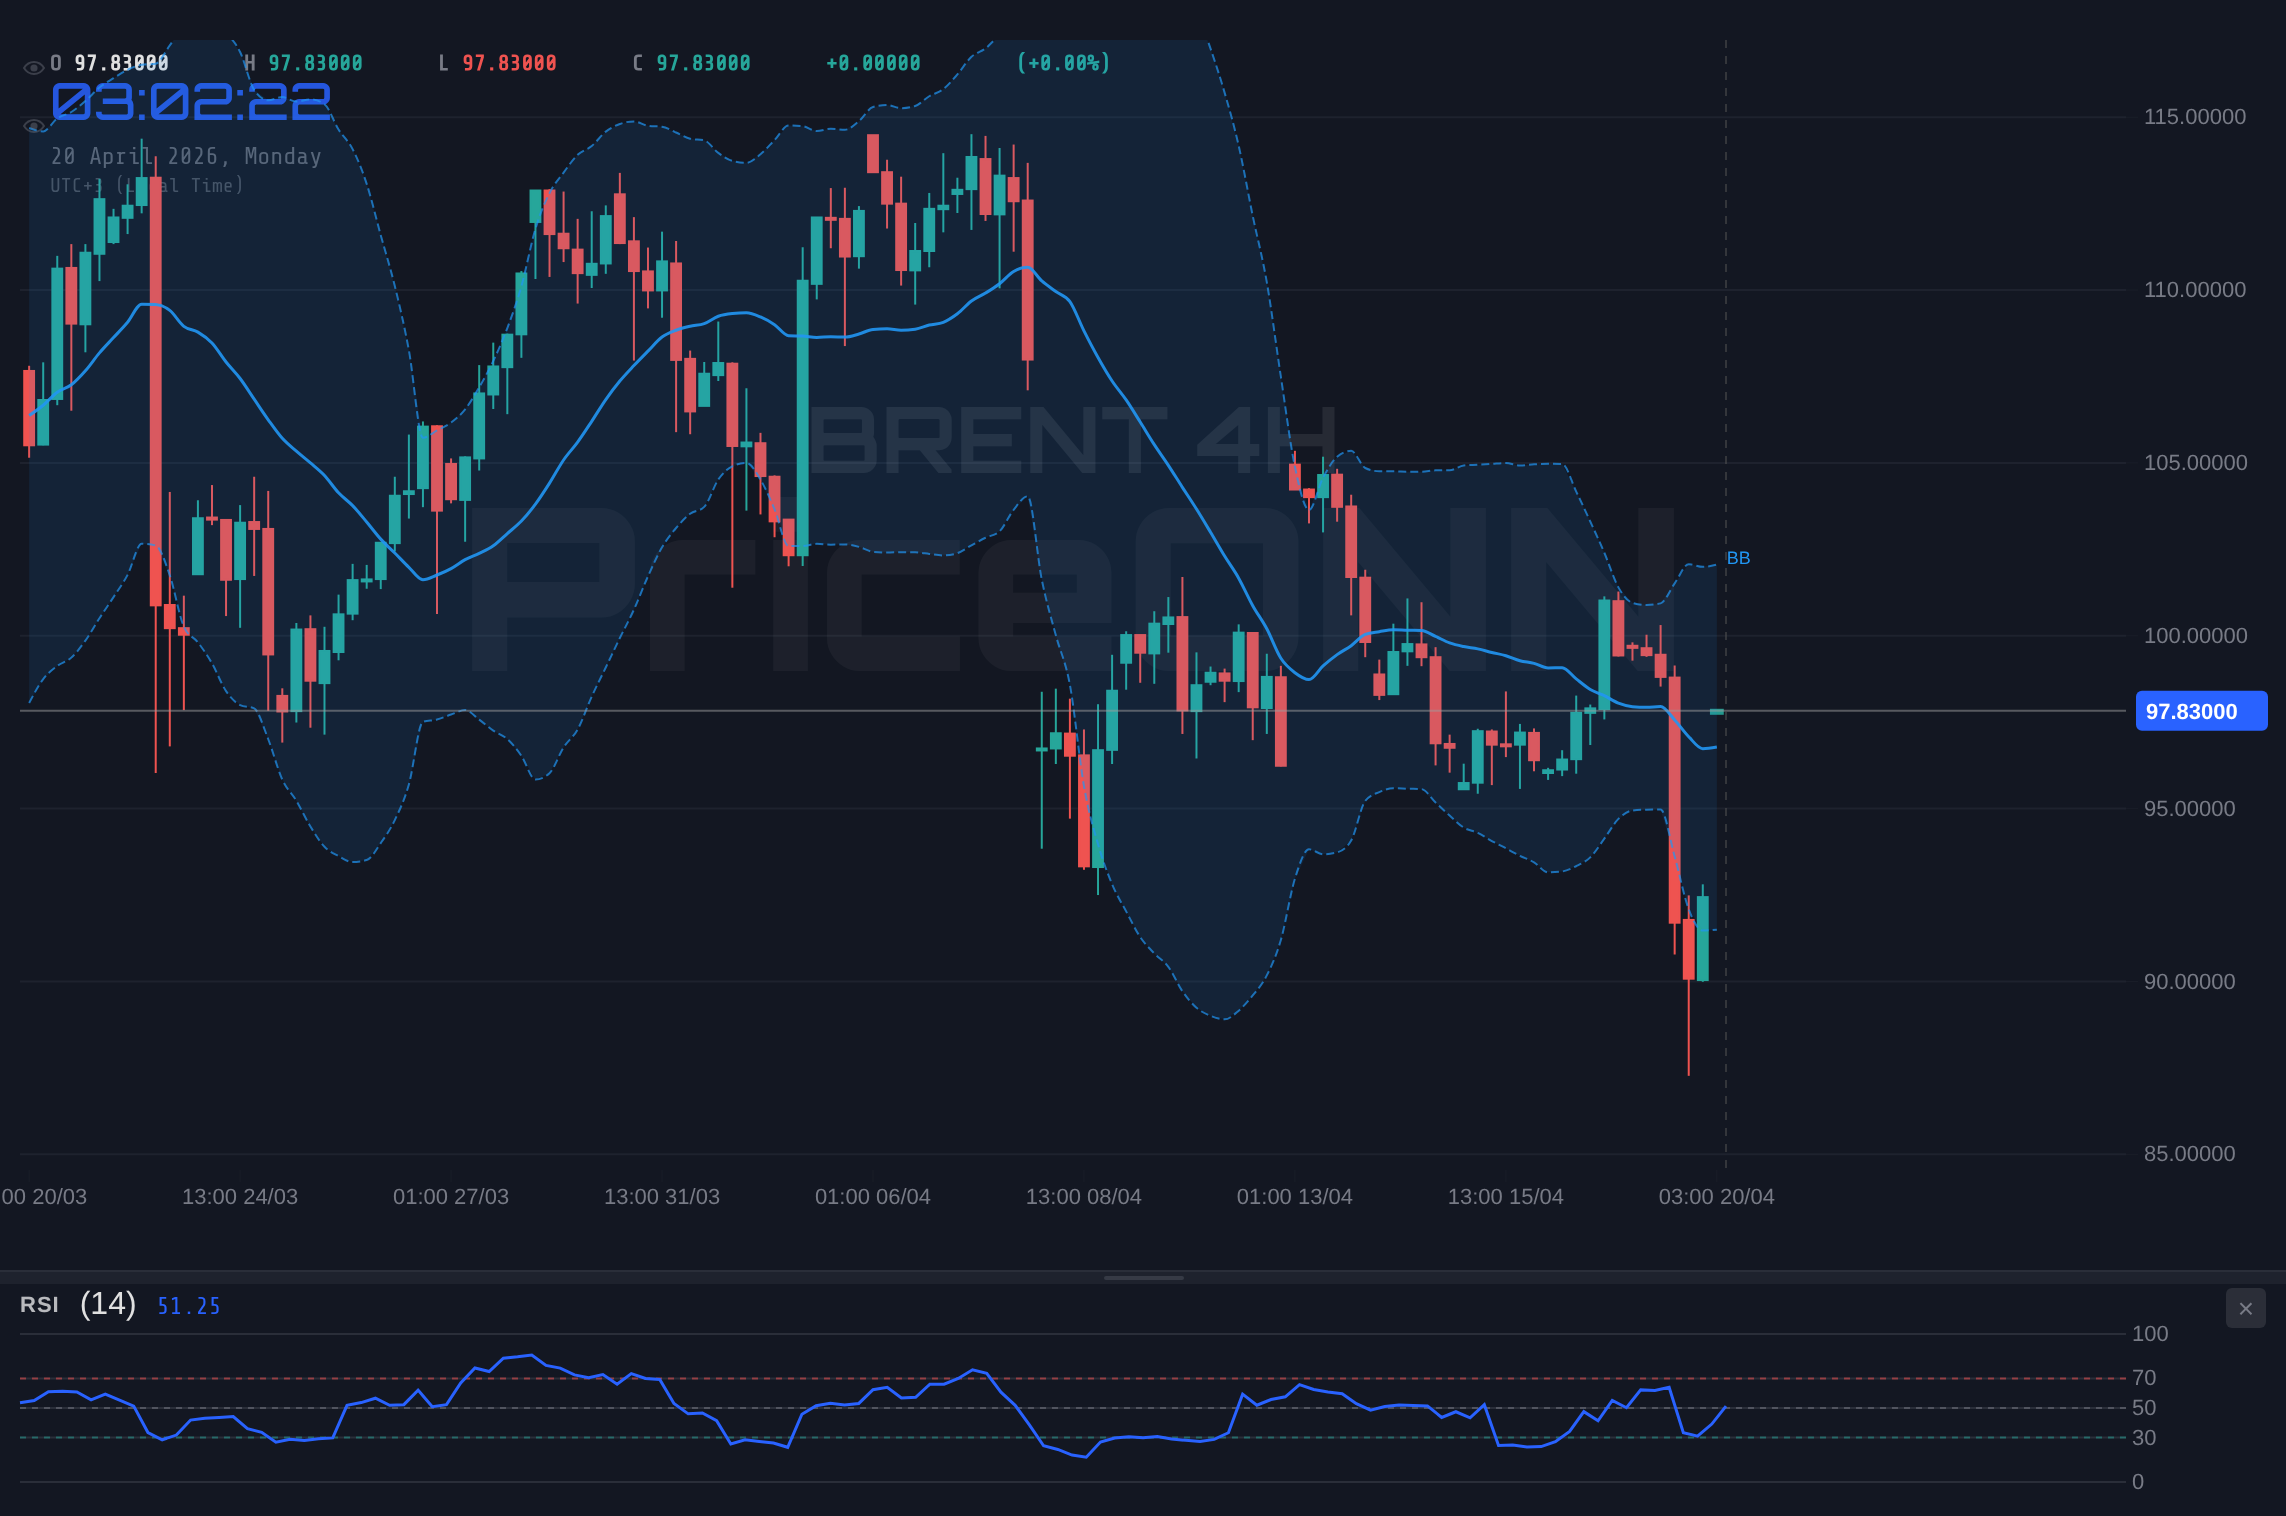
Looking at the technical indicators, the 1-hour chart for Brent presents a somewhat encouraging picture for the bulls. The RSI(14) stands at 57.53, comfortably within the neutral zone but leaning towards positive momentum, suggesting room for further upward movement before hitting overbought territory. The MACD, while showing positive momentum on the 1H chart, is a bit more nuanced when we look at other timeframes. The Stochastic Oscillator on the 1H chart, with %K at 64.24 and %D at 32.97, clearly indicates a bullish signal as %K is above %D and moving upwards, reinforcing the idea that buyers are currently in control. The ADX at 35.4 on the 1H timeframe also points to a strong uptrend, suggesting that the current price action is not merely a blip but part of a developing trend. The Bollinger Bands on the 1H chart are also positioned above the middle band, further supporting the bullish inclination in the short term. This confluence of short-term technical indicators provides a foundation for the argument that Brent could indeed push higher from current levels.
The Bears' Counterpoint: Why $97.81 Might Be a Ceiling
The Strait of Hormuz Factor: A Volatility Trigger
The recent news surrounding the Strait of Hormuz has injected a significant dose of uncertainty into the oil market. Reports suggest a rapid reversal from open passage to strictly controlled transit, which has historically been a potent catalyst for oil price spikes due to fears of supply disruptions. The Strait is a critical chokepoint, through which a substantial portion of the world's oil supply passes. Any perceived threat to this flow immediately raises red flags for traders and geopolitical analysts. While the immediate impact might be a surge in prices driven by fear and speculation, the bears argue that this could be a temporary 'fear premium.' If the actual supply flow is not significantly impacted, or if diplomatic de-escalation occurs swiftly, the price surge could be short-lived, leading to a sharp reversal as the market realizes the threat was overblown. The bears are watching closely to see if this geopolitical 'noise' translates into actual physical supply disruptions or if it's merely a market manipulation tactic to create short-term volatility.
Macroeconomic Headwinds and Demand Destruction Fears
On the demand side, the bears point to persistent macroeconomic headwinds that could undermine oil consumption. High inflation rates globally, even if showing signs of moderation in some regions, continue to erode purchasing power. This can lead to reduced consumer spending on discretionary items, including fuel for transportation. Central banks, grappling with persistent inflation, are maintaining tighter monetary policies, which can slow economic growth. The US Dollar Index (DXY) strength, currently at 98.18, further complicates the picture. A stronger dollar typically makes dollar-denominated commodities like oil more expensive for holders of other currencies, potentially dampening demand. On the 4H chart, the RSI is at 49.9, indicating a neutral-to-slightly-bearish sentiment, and the MACD histogram shows negative momentum, suggesting that selling pressure is building. The ADX on the 4H chart at 35.4 indicates a strong trend, but the bearish MACD signal implies this trend might be downwards. If economic growth falters significantly, or if inflation forces consumers to cut back drastically, the demand for oil could contract, creating downward pressure on prices despite supply constraints.
Technical Indicators Signaling Caution
While the 1-hour chart might offer some solace to the bulls, a broader look at the technical picture reveals several cautionary signals. The 4-hour chart for Brent presents a mixed bag. While the ADX at 35.4 suggests a strong trend, the MACD histogram is negative and below the signal line, indicating bearish momentum is building. The RSI(14) at 49.9 is hovering around the neutral line, suggesting indecision or a potential shift in momentum. The Stochastic Oscillator on the 4H chart, with %K at 34.68 and %D at 52.88, shows a bearish signal as %K has crossed below %D. Crucially, the Bollinger Bands on the 4H chart are positioned below the middle band, which can indicate a bearish trend or a period of consolidation after a decline. On the daily chart, the RSI is at 49.06, also indicating a lack of strong directional conviction, and the Stochastic Oscillator shows %K at 29.3 and %D at 24.76, suggesting a potential bearish crossover after being in oversold territory. The ADX on the daily chart at 34.16 indicates a strong trend, but the combination of bearish Stochastic and RSI readings raises concerns about the sustainability of any upside move. Bears would argue that these longer-term indicators suggest the current price near $97.81 might be a resistance zone, ripe for a pullback.
The Battle for $97.81: Key Levels and Scenarios
Support and Resistance Levels: The Battlefield
The technical data provides clear battle lines. Immediate support is seen at $96.41 (S1), followed by $93.40 (S2) and $90.96 (S3). These levels represent areas where buying interest has historically emerged or where a significant price floor could be established. Conversely, resistance looms at $101.86 (R1), $104.30 (R2), and $107.31 (R3). The $97.81 price point is currently sitting just below the 4H middle Bollinger Band, a key area that often acts as a pivot. A decisive break above this band, and subsequently the R1 resistance at $101.86, would lend significant credence to the bullish case. Conversely, a failure to hold above current levels and a subsequent break below the 1H support at $91.53 could signal a bearish move towards the $90.96 S3 level. The current price action is essentially a tug-of-war around these critical technical zones, with geopolitical news acting as a potential catalyst to break the stalemate.
Scenario 1: Bullish Breakout (60% Probability)
The bullish scenario hinges on a confluence of factors: sustained OPEC+ supply discipline, resilient global demand, and a de-escalation or manageable impact of the Strait of Hormuz situation. Technically, this would involve Brent decisively breaking through the $97.81 immediate pivot and establishing a strong foothold above the 4H middle Bollinger Band. Confirmation would come from a clear break above the $101.86 resistance level (R1). The RSI moving firmly into overbought territory (above 70) and the MACD histogram showing sustained positive momentum would support this outlook. The ADX remaining strong, ideally above 30, would indicate a trending market capable of pushing prices higher. If these conditions align, the next targets would be $104.30 (R2) and potentially $107.31 (R3) in the medium term. The key trigger for this scenario is sustained upward momentum and a clear break above the immediate resistance, suggesting that the market is pricing in continued supply tightness and overcoming short-term geopolitical fears.
Scenario 2: Bearish Reversal (30% Probability)
The bearish scenario gains traction if the geopolitical fears surrounding the Strait of Hormuz prove to be more than just noise, leading to actual supply fears or if macroeconomic headwinds significantly dampen demand expectations. Technically, this thesis would be invalidated if Brent holds above the $91.53 support level. A bearish confirmation would involve a decisive close below the $90.96 S3 support level. Indicators like the MACD histogram turning strongly negative on the 1H chart, coupled with the RSI falling below 40 and the Stochastic Oscillator showing bearish crossovers in the 4H or Daily charts, would support this view. The ADX remaining strong but trending downwards would indicate a weakening uptrend. If this scenario unfolds, the price could retest the $87.40 support level (S1 on the 4H chart) and potentially move towards the $84.73 S2 level. The trigger here would be a failure to hold key short-term supports and a decisive break below the psychological $90 level.
Scenario 3: Consolidation and Choppy Action (10% Probability)
A neutral or consolidation scenario is also plausible, especially if the geopolitical situation remains ambiguous and macroeconomic data provides mixed signals. In this case, Brent might trade sideways, oscillating between the established support and resistance levels. The price could hover around the current $97.81 mark, potentially testing the $91.53 support and $101.86 resistance multiple times without a clear breakout. This choppy action often occurs when the market is waiting for a significant catalyst – either a clear resolution to geopolitical tensions or a major economic data release. Technical indicators might show conflicting signals, such as a strong ADX suggesting a trend, but with RSI and MACD oscillating around their mid-levels, indicating a lack of sustained conviction. This scenario is characterized by lower volume and reduced volatility compared to a strong trend, presenting challenges for traders seeking clear directional trades.
The Verdict: Navigating the Uncertainty
The current technical setup for Brent oil, trading around $97.81, presents a fascinating dichotomy. The 1-hour chart, with its RSI at 57.53 and a bullish Stochastic signal, suggests immediate upward potential. However, the longer-term 4-hour and daily charts reveal a more cautious picture. The negative MACD momentum on the 4H, the bearish Stochastic crossover on the Daily, and the ADX readings indicating strong trends (but not necessarily in the direction of the bulls) suggest that upside may be capped. The Strait of Hormuz situation adds a layer of geopolitical risk that cannot be ignored; it's a potential wildcard that could trigger sharp moves in either direction. Given the conflicting signals and the geopolitical overhang, the 60% probability assigned to the bullish scenario is contingent on a clear technical breakout above $101.86 and a de-escalation or manageable impact from Hormuz tensions. Without these confirmations, the risk of a bearish reversal towards the $90.96 support level remains significant. Traders should exercise caution, manage risk diligently, and wait for clearer signals. Patience will be rewarded as the market digests these competing factors.
Frequently Asked Questions: BRENT Analysis
What happens if BRENT breaks decisively above $101.86 resistance?
A strong close above the $101.86 resistance level would validate the bullish scenario, suggesting sustained upward momentum. This could trigger a move towards the $104.30 (R2) and potentially the $107.31 (R3) targets, especially if OPEC+ supply discipline remains intact and geopolitical fears subside.
Should I buy BRENT at current levels around $97.81 given the mixed technical signals?
Buying at current levels carries risk due to conflicting technical signals and geopolitical uncertainty. A more prudent approach would be to wait for confirmation, such as a clear break above $101.86 or a retest of support near $91.53, aligning with a higher probability trade setup.
Is the RSI at 57.53 a buy signal for BRENT right now?
An RSI of 57.53 on the 1-hour chart suggests positive momentum but is not an extreme buy signal. It indicates buyers are active but not yet in overbought territory. Confirmation from other indicators like MACD and Stochastic, along with price action above key resistance, would be needed for a stronger buy signal.
How will the Strait of Hormuz situation affect BRENT prices this week?
The situation at the Strait of Hormuz introduces volatility and a potential risk premium. If it leads to actual supply concerns, prices could spike. However, if it's a temporary issue or de-escalates quickly, the impact might be short-lived, potentially leading to a reversal as the market focuses back on fundamentals like OPEC+ cuts and demand data.
Bearish Scenario: Hormuz Fears Intensify
30% ProbabilityNeutral Scenario: Sideways Consolidation
10% ProbabilityBullish Scenario: Supply Tightness Prevails
60% Probability| Indicator | Value | Signal | Interpretation |
|---|---|---|---|
| RSI (14) | 57.53 | Neutral | Suggests upward momentum on 1H, but leaning neutral on longer timeframes. |
| MACD Histogram | -0.12 | Bearish | Negative momentum on 4H chart indicates potential selling pressure. |
| Stochastic | K:34.68, D:52.88 | Bearish Crossover | Bearish signal on 4H chart after %K crossed below %D. |
| ADX | 35.4 | Strong Trend | Indicates a strong trend on 1H, but context from other indicators is key. |
| Bollinger Bands | Mid-Band Test | Watch | Price testing middle band on 1H, crucial pivot area. |
As we conclude this analysis, the market for Brent crude oil remains at a critical crossroads near $97.81. The interplay between geopolitical tensions, OPEC+ supply management, and macroeconomic demand signals creates a volatile environment. While the short-term technicals offer some bullish cues, the longer-term indicators and the potential for supply disruptions in the Strait of Hormuz warrant caution. The battle lines are clearly drawn around key support at $96.41 and resistance at $101.86. Successfully navigating this period will require a disciplined approach, a keen eye on developing news, and a robust risk management strategy. The market will likely provide opportunities for those who are patient and wait for clear, high-probability setups, whether they lean bullish or bearish.
Track markets in real-time
AI-powered analysis, technical indicators and real-time price data.
Join Our Telegram Channel
Breaking market news, AI analysis and trading signals instantly.
Join Channel