

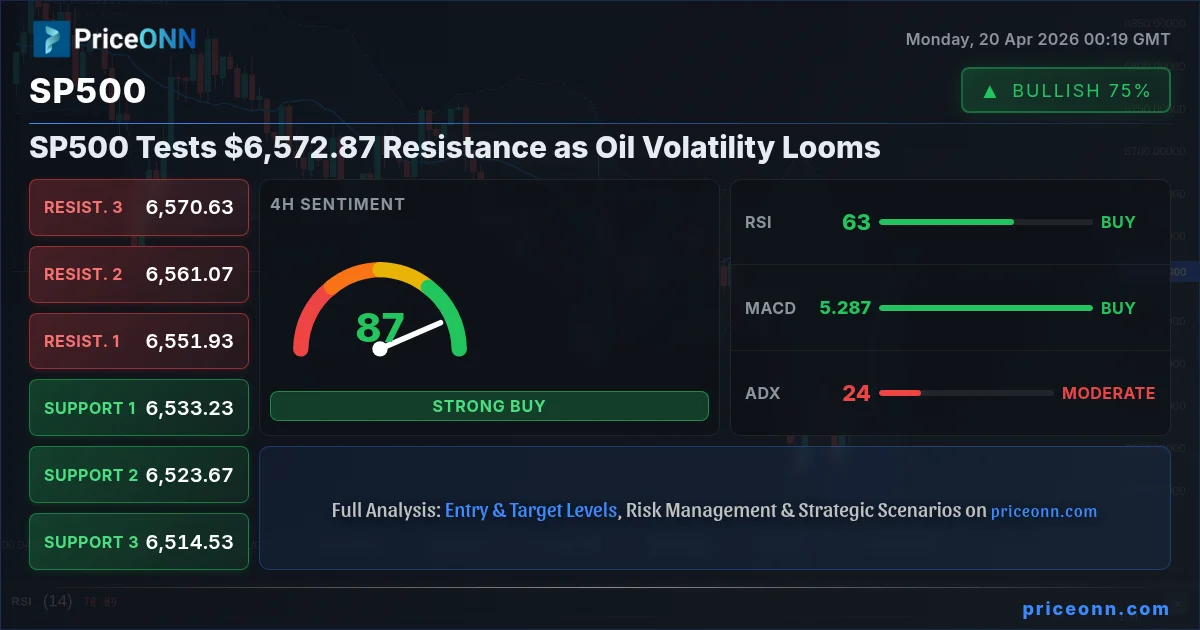
The S&P 500 (SP500) is currently hovering around the critical $6,572.87 level, a point of significant interest for traders and investors alike. This juncture comes as the broader market sentiment remains cautious, with underlying currents of volatility, particularly evident in the energy sector. Brent crude oil futures, trading at $97.22, are signaling potential price swings that could ripple through inflation expectations and risk appetite. This analysis dives into the multi-faceted forces shaping the SP500's path forward, exploring various scenarios and the key triggers that could dictate its next major move.
- With RSI at 67.36 on the 1H chart for SP500, overbought pressure is building, suggesting potential for a short-term pullback.
- Critical resistance for the SP500 is identified at $6,572.87, a level that has been tested multiple times this week.
- The ADX at 49.72 on the 1H chart indicates a strong uptrend, but conflicting signals from other indicators warrant caution.
- The correlation between DXY at 98.09 and SP500's performance is a key factor to monitor, with a rising dollar often pressuring equities.
The Bull's Roadmap: Navigating Towards New Highs
For the bulls, the path forward for the S&P 500 hinges on a decisive break above the current resistance zone. The 1-hour chart shows a strong uptrend with an ADX reading of 49.72, indicating robust trend strength. However, the RSI at 70.95 suggests the index is approaching overbought territory on this timeframe, implying that any upward momentum needs to be sustained by fresh buying pressure rather than exhaustion. A sustained push above $6,572.87, ideally with increasing volume, would be the first sign of bullish conviction. If this level is cleared, the next immediate upside target would be the $6,589.83 resistance, followed by a more significant push towards $6,605.07. Confirmation of this bullish thesis would require continued strength in correlated assets like the Nasdaq 100, which is showing strong upward momentum on the 4-hour chart (RSI 71.45, ADX 56.5), and a potential cooling off in the US Dollar Index (DXY), currently at 98.09.
The fundamental backdrop also plays a crucial role. Positive economic data releases, such as stronger-than-expected employment figures or inflation that remains within manageable bounds, could fuel further upside. Traders will be keenly watching upcoming US economic calendar events, particularly any data that could influence Federal Reserve policy expectations. A less hawkish stance from the Fed, or signs that inflation is moderating without stifling growth, could provide the catalyst needed for a sustained rally. The 4-hour chart shows the SP500 above its middle Bollinger Band, suggesting an upward bias, and the Stochastic indicator is showing a bullish crossover, though it is nearing overbought conditions. This suggests that while the trend is currently positive, the market is approaching a zone where caution is advised.
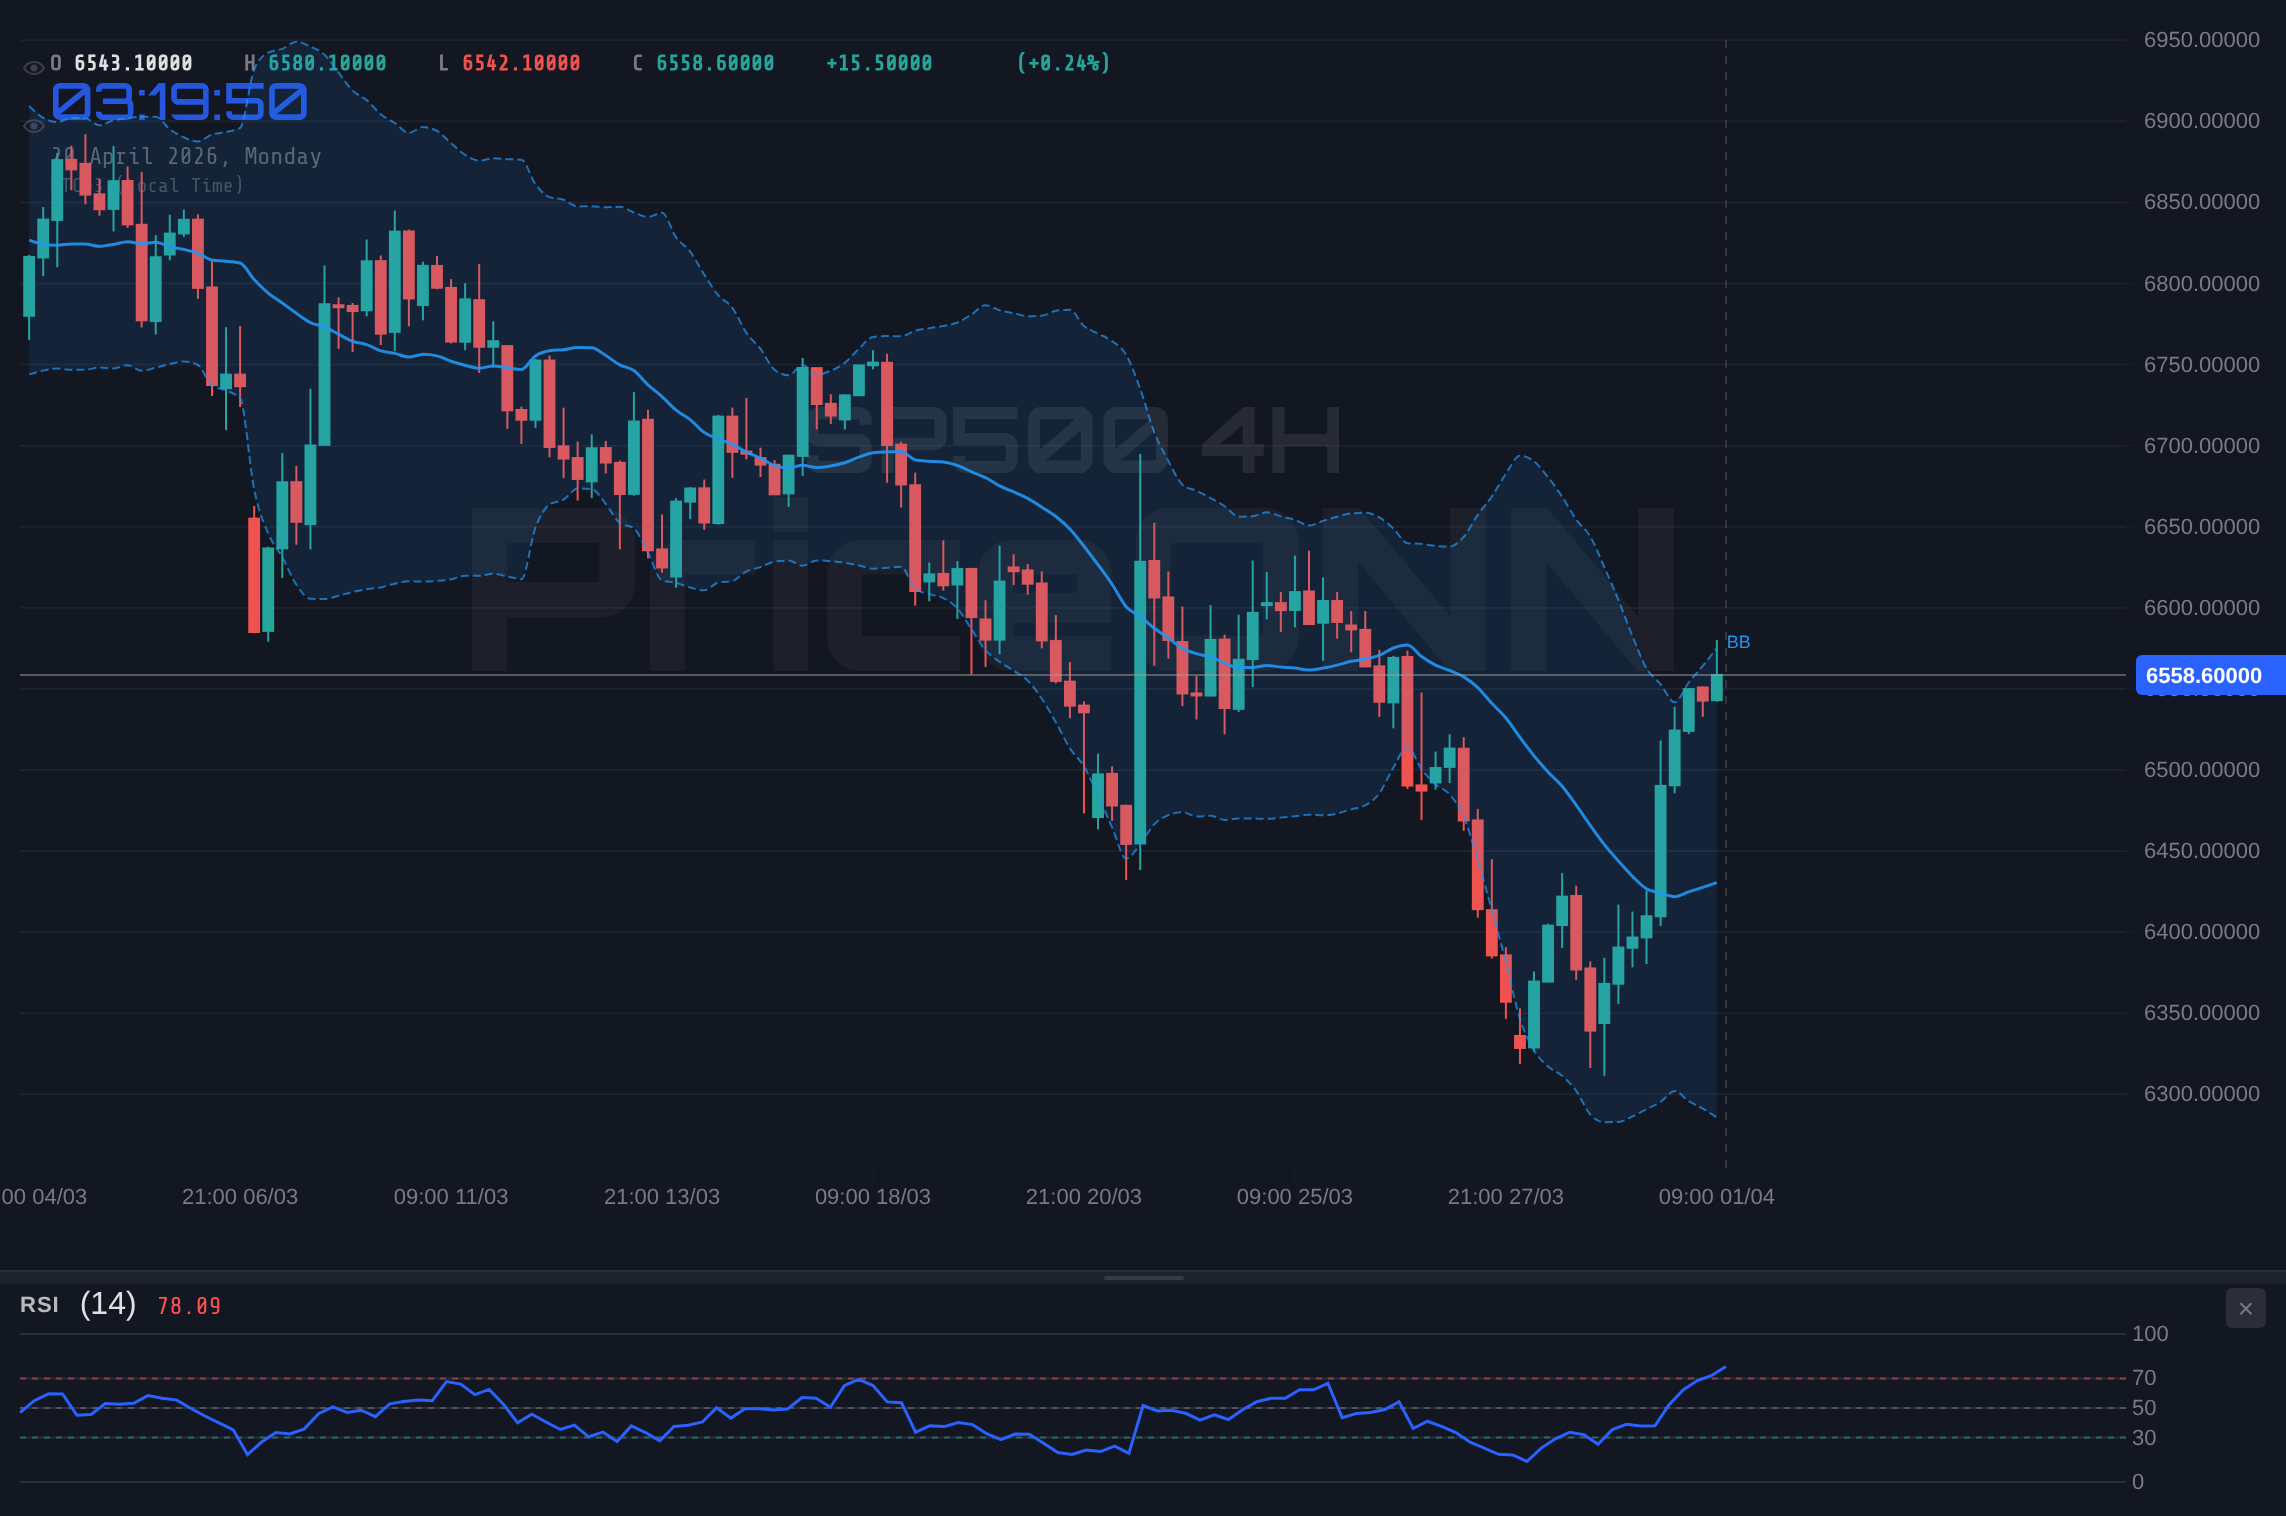
The SP500's price action on the daily chart presents a slightly more complex picture. While the 1-hour and 4-hour charts lean bullish, the daily ADX at 47.51 still indicates a strong downtrend from a longer-term perspective, despite the recent upward move. This divergence between short-term optimism and longer-term bearish signals highlights the choppiness and potential for reversals. For the bullish scenario to fully materialize and reverse the daily trend, a sustained close above the $6,605.07 resistance would be crucial, followed by a break of the $6,685.83 level. Such a move would likely be accompanied by a significant shift in market sentiment, potentially driven by a dovish surprise from the Federal Reserve or a de-escalation of geopolitical tensions that are currently weighing on oil prices.
Where Bears Take Control: The Downside Risks
Conversely, the bearish scenario for the S&P 500 remains a significant possibility, especially given the current resistance level and the volatile signals from other markets. The immediate trigger for a bearish turn would be a failure to break decisively above $6,572.87. If the index struggles to push higher and starts to retreat, the first line of defense would be the support at $6,568.73, followed by $6,547.63. A break below these levels, particularly the $6,547.63 mark, would signal a loss of bullish momentum and could open the door for a sharper decline. On the 1-hour chart, the RSI is already showing signs of weakness, and a break below its current level could accelerate selling pressure.
The influence of the US Dollar Index (DXY) and oil prices cannot be overstated. The DXY is currently at 98.09 and showing signs of upward momentum on the 1-hour chart, which historically puts pressure on US equities. If the dollar continues to strengthen, it could signal a risk-off sentiment that would likely drag the SP500 lower. Simultaneously, Brent crude oil is trading at $97.22, with its 1-hour chart showing a bullish signal despite a recent dip, and the 4-hour chart indicating a sell signal. Volatility in oil prices, driven by geopolitical events such as the situation in the Strait of Hormuz, can create uncertainty and impact inflation expectations, potentially leading to a more cautious stance from central banks and a sell-off in risk assets like stocks. A sustained rise in oil prices, coupled with a strengthening dollar, would be a potent cocktail for bearish pressure on the SP500.
From a technical standpoint, the daily chart still retains a bearish undertone, with an ADX of 47.51 suggesting a strong downtrend from a longer-term perspective. If the SP500 fails to break the $6,572.87 resistance and instead reverses, the next significant support levels to watch would be $6,377.47, followed by $6,230.63. The MACD on the daily chart is currently negative, reinforcing the idea that any short-term rallies could be met with selling pressure. The Stochastic indicator on the daily chart is showing a bullish signal, but this often occurs in downtrends as a temporary bounce before further declines. Confirmation of the bearish scenario would likely involve a close below the $6,547.63 support and a subsequent breakdown below the $6,526.53 level, signaling a more significant shift in market sentiment.
The Waiting Game: Caught in Consolidation
There's also a distinct possibility that the S&P 500 could enter a period of consolidation, trading within a defined range as market participants await clearer direction. This scenario often occurs when conflicting signals emerge from different timeframes or when major economic events are on the horizon. Currently, the SP500’s daily chart shows a neutral trend with a 50% power rating, despite strong intraday signals. The RSI on the daily chart is at 45.35, indicating neither extreme overbought nor oversold conditions, leaving room for price action in either direction. The MACD on the daily chart is negative, suggesting underlying weakness, but the Stochastic is showing a bullish signal, creating a tug-of-war.
In this neutral scenario, the index would likely trade between the immediate support at $6,547.63 and the resistance at $6,572.87. Prices might oscillate within this range, with minor rallies failing to reach new highs and minor dips finding temporary buyers. This consolidation could be driven by uncertainty surrounding upcoming economic data releases, such as inflation reports or employment figures, or by geopolitical developments that create a 'wait-and-see' attitude. The strong ADX readings on the 1-hour and daily charts (49.72 and 47.51 respectively) suggest that if a breakout does occur, it could be sharp, but the conflicting signals from RSI and Stochastic on the daily chart indicate that the market is currently undecided on the direction of that breakout.
The role of the US Dollar Index (DXY) and oil prices becomes even more critical in a consolidation phase. If the DXY remains range-bound around 98.09 and oil prices fluctuate without a clear directional trend, it could contribute to the SP500’s sideways movement. Traders might be hesitant to commit to large positions until these key macro indicators provide a clearer signal. This waiting game can be frustrating for short-term traders but can also present opportunities for those who can identify range-bound strategies or wait for the eventual breakout. The key levels to watch in this scenario remain the immediate support and resistance boundaries; a decisive move outside of this range would signal the end of the consolidation phase.
The Most Likely Scenario and Key Triggers
Considering the current technical landscape and the prevailing market conditions, the most probable scenario for the S&P 500 in the immediate short-term appears to be a cautious approach to the resistance level at $6,572.87, with a high probability of consolidation or a minor pullback before any decisive move. The conflicting signals across different timeframes and indicators suggest that the market is grappling with competing forces. The strong intraday uptrend is battling against daily chart bearish undertones and overbought conditions on the 1-hour RSI. Therefore, I assign a higher probability to a neutral to bearish lean in the very short term, perhaps a 60% chance of consolidation or a test and rejection of the $6,572.87 resistance, followed by a potential move lower towards $6,547.63. A sustained breakout above $6,572.87, while possible, seems less likely without stronger fundamental catalysts or a shift in DXY or oil price direction, giving it a 30% probability. A continued strong bullish move, breaking higher resistance levels, would be a lower probability event at 10% in the immediate outlook.
The fundamental drivers are key to shifting these probabilities. Upcoming economic data will be paramount. Any surprises in US inflation figures, employment reports, or manufacturing PMI data could easily sway sentiment. For instance, significantly weaker-than-expected data could trigger a sharp sell-off, validating the bearish outlook. Conversely, stronger data that doesn't ignite inflation fears could provide the fuel for a bullish breakout. Geopolitical developments, especially concerning oil supply and the Strait of Hormuz, also remain a wildcard. A sudden escalation could spook markets and lead to a flight to safety, benefiting the dollar and potentially pressuring stocks. Conversely, de-escalation could remove a layer of uncertainty and support risk assets.
The Federal Reserve's stance, as communicated through speeches by officials and the pricing in of future interest rate moves, will continue to be a primary driver. If market participants perceive a more dovish tone or a delayed timeline for potential rate hikes, it could embolden buyers. However, any indication that the Fed remains concerned about inflation could lead to renewed selling pressure. The interplay between these factors - technical levels, economic data, geopolitical risks, and central bank policy - will ultimately determine whether the SP500 consolidates, retreats, or pushes to new highs. Traders must remain vigilant, monitoring these key triggers closely.
What I'm Watching This Week
My focus this week will be on a few critical junctures. Firstly, the price action around the $6,572.87 resistance level on the SP500 is paramount. A clear rejection here would align with the bearish or consolidation scenarios. Secondly, I'll be closely monitoring the US Dollar Index (DXY), currently at 98.09. Any significant move above 98.10 could signal increased risk aversion, while a fall below 97.78 might offer some relief to equities. Finally, the direction of Brent crude oil prices, currently at $97.22, remains a key indicator for inflation expectations. A sustained move above $98 would raise concerns, while a drop back below $95 could ease some inflationary pressures.
The upcoming economic calendar, though light today on Monday, April 20th, 2026, will pick up steam. Traders should pay close attention to any high-impact USD data releases scheduled for later in the week. These releases have the potential to provide the directional clarity needed to break the current market indecision. Confirmation of the prevailing trend will likely come from follow-through price action after these events, especially if they lead to a decisive move beyond the current SP500 range.
Traders should look for confluence between technical signals and fundamental catalysts. For example, a break above $6,572.87 would be more convincing if accompanied by positive economic news and a softening DXY.
Bearish Scenario: Retreat from Resistance
60% ProbabilityNeutral Scenario: Range-Bound Trading
30% ProbabilityBullish Scenario: Breakout Confirmation
10% ProbabilityFrequently Asked Questions: SP500 Analysis
What happens if SP500 fails to break the $6,572.87 resistance level?
If the SP500 fails to decisively break above $6,572.87, a pullback is likely, targeting the support at $6,547.63. This scenario is given a 60% probability due to current overbought conditions on the 1-hour RSI and conflicting daily chart signals.
Should I buy SP500 at current levels around $6,572.87 given the RSI at 67.36?
Buying at current levels around $6,572.87 carries risk due to the RSI at 67.36 on the 1-hour chart signaling overbought conditions. A more prudent approach might be to wait for a confirmed breakout above resistance or a pullback to a key support level like $6,547.63.
Is the ADX at 49.72 a sell signal for SP500 right now?
An ADX of 49.72 on the 1-hour chart indicates a strong uptrend, not a sell signal itself. However, when combined with an RSI nearing overbought territory, it suggests that the current uptrend may be losing steam or could be due for a pause or reversal if other indicators turn bearish.
How will the upcoming US economic data affect SP500 this week, given DXY is at 98.09?
Upcoming US economic data, especially inflation and employment figures, could significantly impact the SP500 by influencing Federal Reserve policy expectations and the DXY's direction. Stronger-than-expected data might push the DXY higher above 98.10, potentially pressuring the SP500, while weaker data could support a bullish breakout if it signals a less hawkish Fed.
| Indicator | Value | Signal | Interpretation |
|---|---|---|---|
| RSI (14) (1H) | 67.36 | Neutral | Approaching overbought territory, potential for pullback |
| MACD (1H) | - | Bearish | Negative momentum, below signal line |
| Stochastic (1H) | K: 65.73, D: 73.5 | Bearish | %K |
| ADX (1H) | 49.72 | Bullish | Strong uptrend confirmed |
| RSI (14) (1D) | 45.35 | Neutral | Mid-range, no extreme signal |
| MACD (1D) | - | Bearish | Negative momentum, below signal line |
| Stochastic (1D) | K: 42.97, D: 29.88 | Bullish | %K > %D, potential bounce |
| ADX (1D) | 47.51 | Bearish | Strong downtrend confirmed |
Track markets in real-time
AI-powered analysis, technical indicators and real-time price data.
Join Our Telegram Channel
Breaking market news, AI analysis and trading signals instantly.
Join Channel