

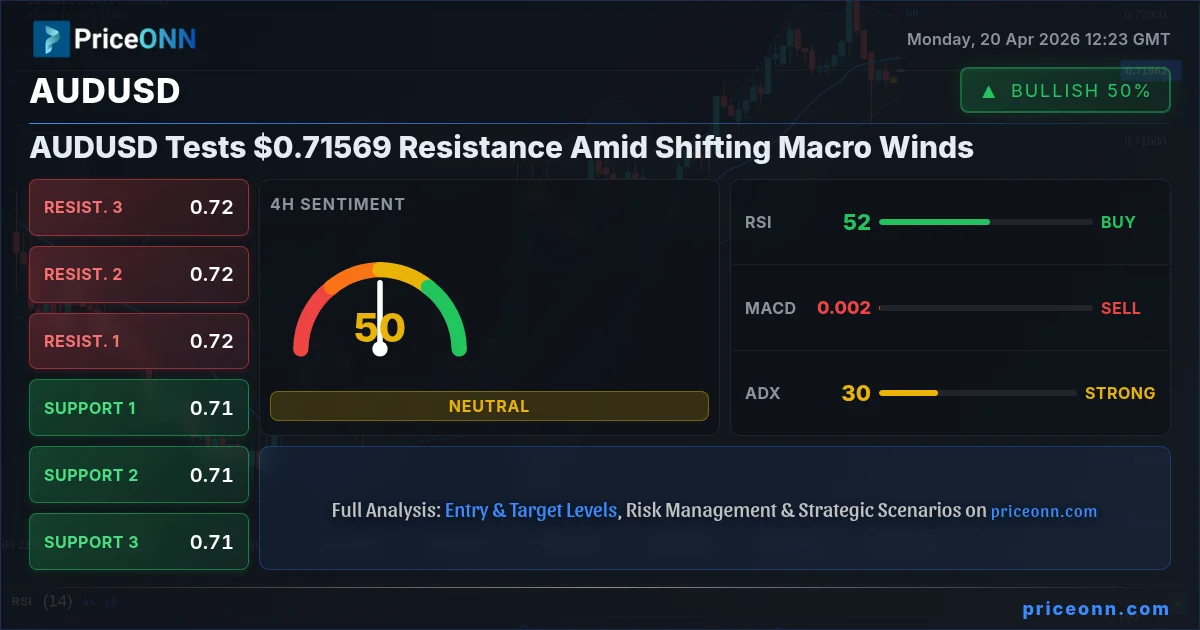
The Australian Dollar against the US Dollar, AUDUSD, is currently presenting a fascinating technical picture, trading precariously near the $0.71569 resistance level. This juncture is critical, not just for the pair itself, but as a barometer for broader market sentiment, particularly concerning the US Dollar's trajectory and the global economic outlook. With the Dollar Index (DXY) showing renewed strength and significant economic data on the horizon, the $0.71569 mark represents a key battleground where the fundamental narrative and technical price action are poised to collide.
- AUDUSD is trading near the $0.71569 resistance level, a critical point for trend determination.
- The Dollar Index (DXY) is at 97.99, showing renewed strength that typically pressures pairs like AUDUSD.
- On the 1H chart, RSI is at 51.1, indicating a neutral but slightly upward-biased momentum, while ADX at 20.59 suggests a weak trend.
- Upcoming US economic data releases, such as employment figures and inflation reports, will be crucial catalysts.
- Key support for AUDUSD is identified at $0.71518, with resistance looming at $0.71596 and $0.71637.
Navigating the Dollar's Strength: DXY's Influence
The US Dollar Index (DXY) is currently quoted at 97.99, exhibiting a notable uptick that directly impacts currency pairs like AUDUSD. Historically, a strengthening dollar often translates to headwinds for commodity-linked currencies such as the Australian Dollar. This correlation is primarily driven by the fact that commodities, including the raw materials Australia exports, are typically priced in US Dollars. When the dollar strengthens, these commodities become more expensive for holders of other currencies, potentially dampening demand and, consequently, the value of currencies like AUD. The DXY's current reading suggests that the greenback is finding some footing, which could translate into downward pressure on AUDUSD unless other factors intervene.
Looking at the DXY's technicals across different timeframes provides further context. On the 1-hour chart, the trend is showing a decrease in strength (89%), but the RSI at 56.57 remains in neutral territory with an upward inclination. The 4-hour chart shows a neutral trend (50% strength) with RSI at 51.31, also neutral with an upward bias. However, the daily chart paints a different picture, with a neutral trend (50% strength) but RSI at 42.18, indicating a downward bias. This mixed signal across timeframes suggests that while the dollar has seen some recent recovery, its sustained strength might face challenges. The ADX on the daily chart is at 26.24, indicating a strong downward trend, which, if it persists, could eventually weaken the dollar's grip on AUDUSD.
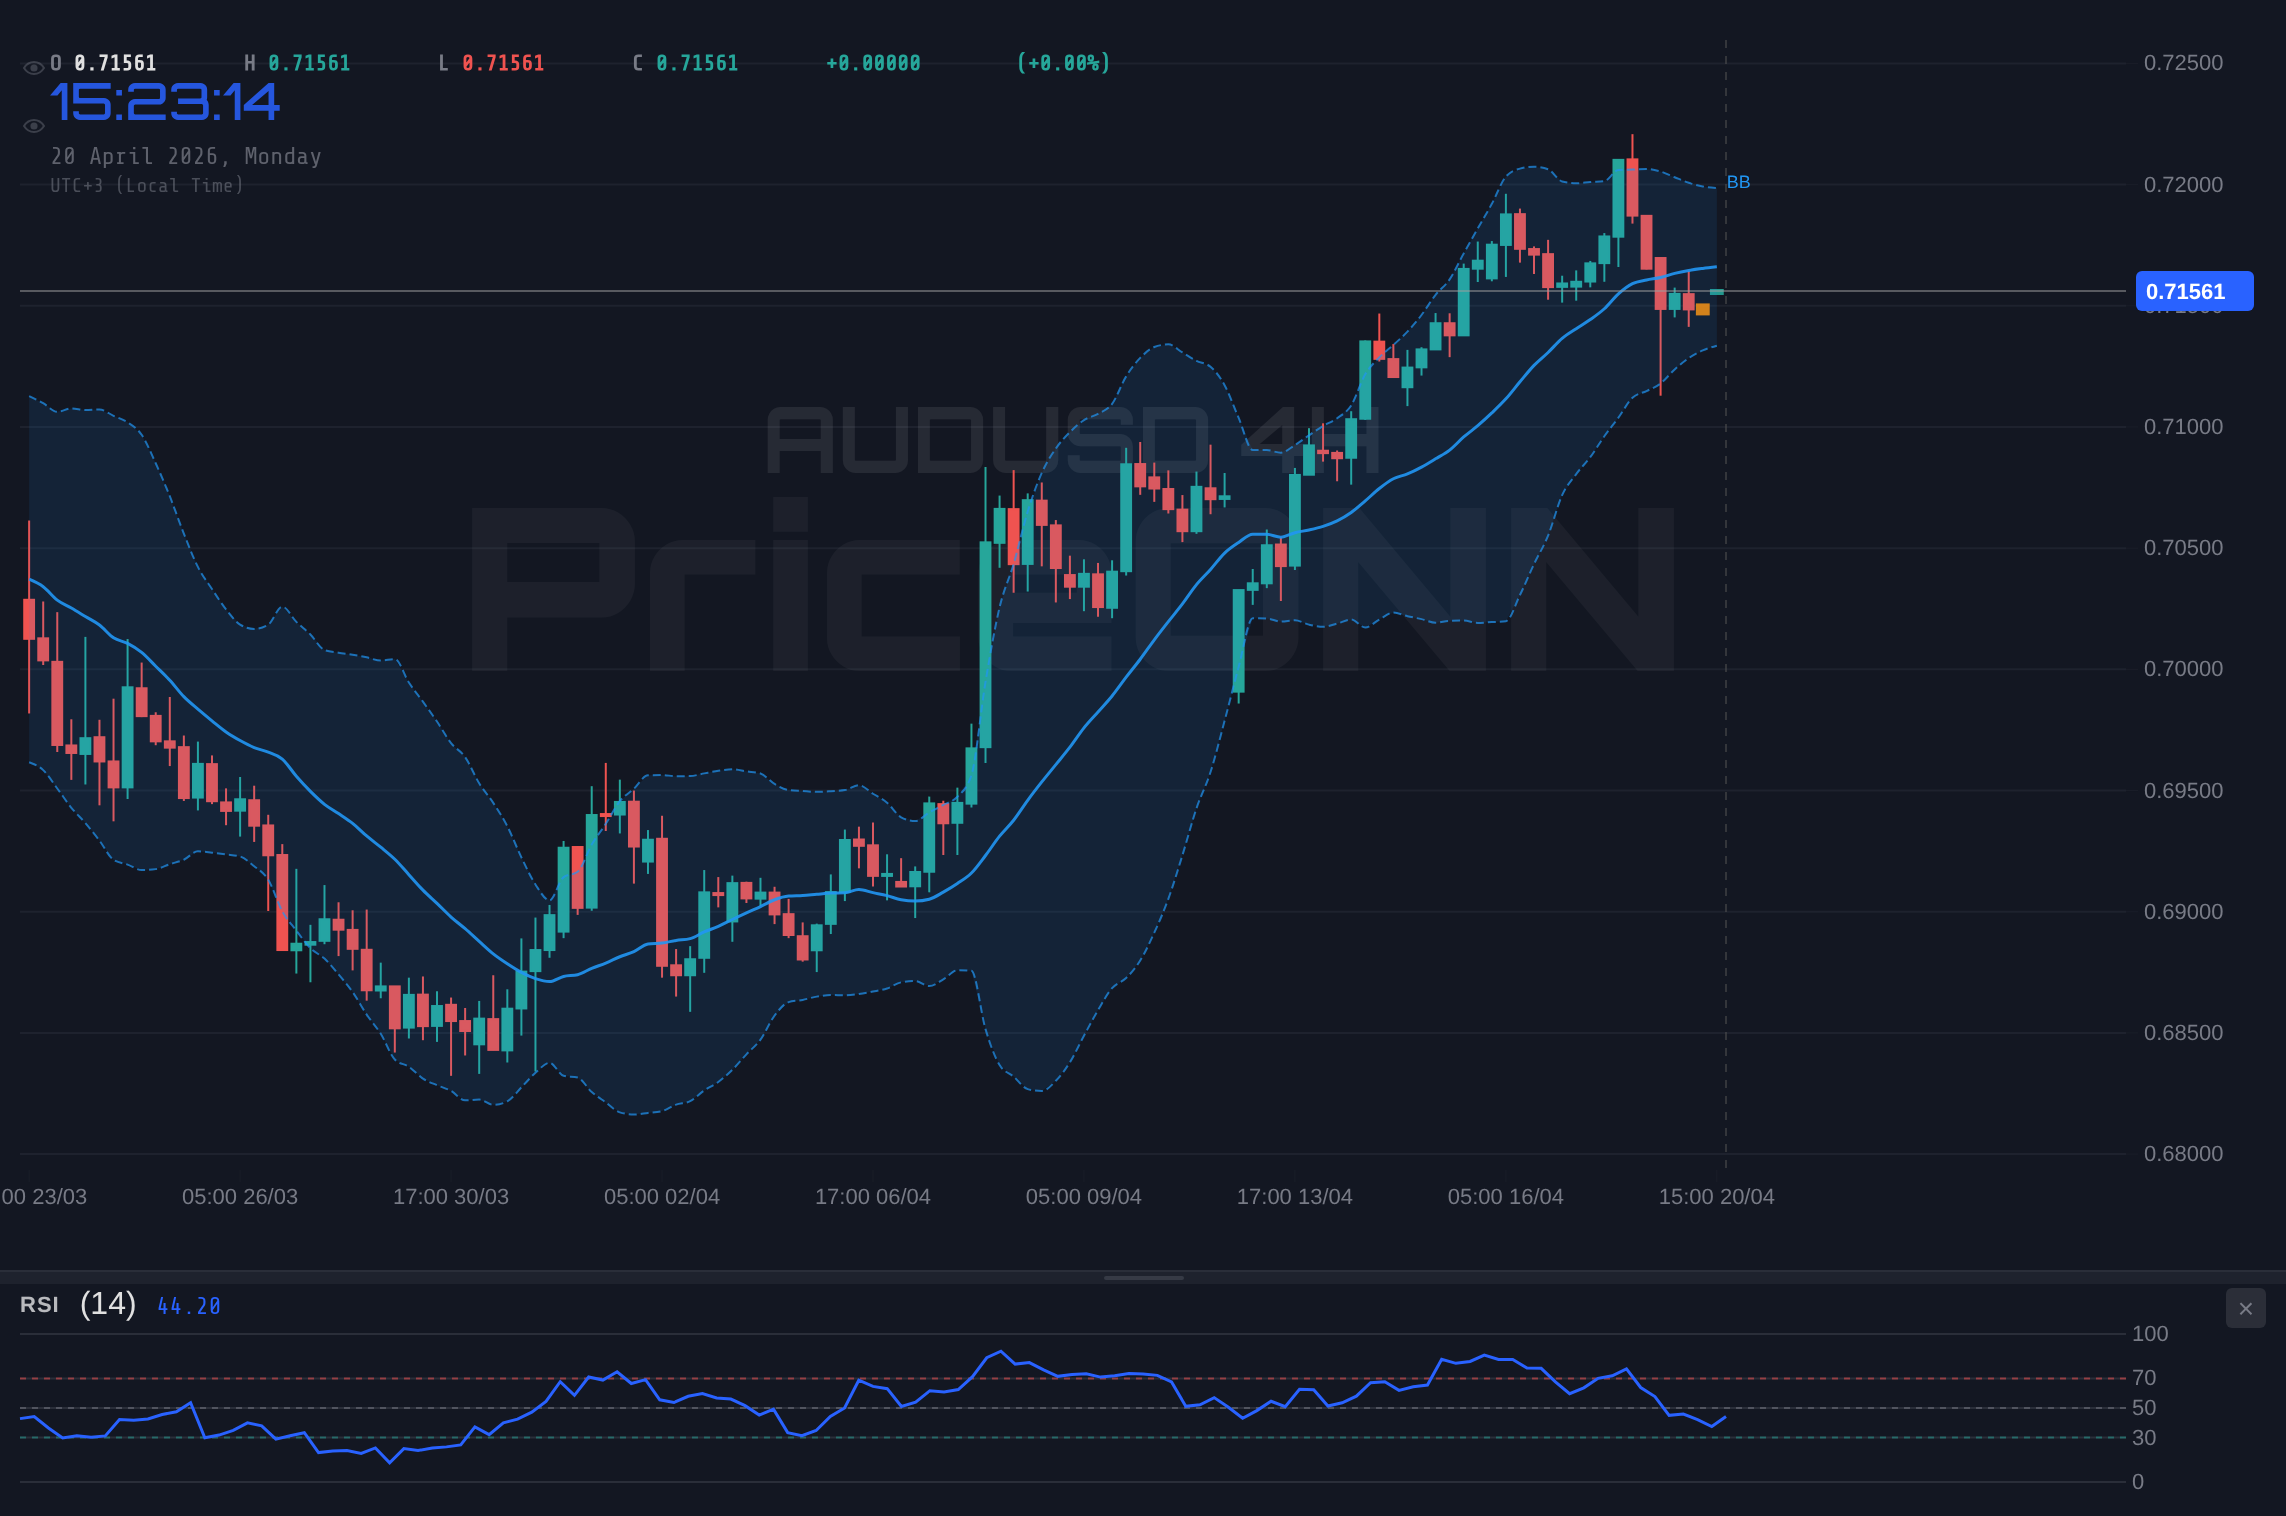
AUDUSD: Technicals at a Crossroads
The AUDUSD pair is currently hovering around the $0.71569 mark. On the 1-hour chart, the trend is neutral with a strength of 50%. The RSI(14) stands at 51.1, a reading that suggests a balanced market, neither overbought nor oversold, but with a slight lean towards upward momentum. This is supported by the MACD, which shows positive momentum with the MACD line above its signal line. The Stochastic Oscillator, with K=70.56 and D=66.01, further reinforces this bullish inclination, indicating that the bulls might be gaining a slight edge in the short term. However, the ADX at 20.59 suggests a weak trend, implying that any upward move might lack conviction and could be prone to reversal.
Shifting to the 4-hour timeframe, the trend is classified as bullish with a strength of 95%. This suggests a more established upward bias on this intermediate timeframe. The RSI(14) at 51.57 remains in the neutral zone, again with a slight upward bias. The MACD here, however, shows negative momentum, with the MACD line below its signal line, which contradicts the bullish trend signal. The Stochastic Oscillator (K=35.03, D=49.05) also presents a bearish signal, as %K is below %D. The ADX at 30.05 indicates a strong upward trend, which is at odds with the MACD and Stochastic signals. This divergence across indicators on the 4-hour chart highlights a market in consolidation, where the underlying bullish trend is present but facing short-term selling pressure or indecision.
The daily timeframe for AUDUSD presents a neutral trend with 50% strength. The RSI(14) is at 62.96, moving into the upper neutral territory, suggesting a potential for further upside but also nearing conditions where selling pressure could emerge. The MACD shows positive momentum, aligned with the upward bias. The Stochastic Oscillator, however, is showing overbought conditions with K=81.56 and D=90.91, indicating that the pair might be due for a pullback or consolidation. The ADX at 20.18 suggests a moderately strong upward trend, but the Stochastic's overbought signal warrants caution. This daily picture suggests that while the longer-term trend might be supported, the immediate path upwards could be bumpy, with potential for profit-taking or sideways movement.
Fundamental Drivers: Economic Data on the Horizon
The upcoming economic calendar is packed with high-impact events that could significantly sway the AUDUSD pair. For the US, several key data releases are scheduled. While the provided data does not list specific dates for all events, it indicates upcoming releases for employment figures (forecasted at 1.4 and 1.3, previous at 0.6 and 0.5) and industrial/manufacturing data (forecasted at 50.1 and 52.5, previous at 49.8 and 52.3). These figures will provide crucial insights into the health of the US economy. Stronger-than-expected employment and manufacturing data would likely bolster the US Dollar, potentially pushing AUDUSD lower towards its support levels. Conversely, weaker data could signal economic slowdown, prompting dollar weakness and offering a reprieve for AUDUSD.
For Australia, while specific high-impact events are not detailed in the provided calendar snippet beyond the general mention of 8 events, any data related to inflation, employment, or trade balance would be critical. Given Australia's reliance on commodity exports, trade balance figures are particularly important. A positive surprise in Australian economic data, such as a widening trade surplus or robust employment growth, could provide a much-needed boost to the AUD, potentially helping it break through the current resistance levels. The interplay between US economic strength and Australian resilience will be a key theme to watch in the coming days.
Correlation Analysis: Equities and Oil
Beyond the direct influence of the DXY, the performance of major equity indices and oil prices also provides valuable context for AUDUSD. The SP500 is currently trading at 6572.87, showing a significant daily gain of 0.74%. This suggests a generally positive risk appetite in the market, which can be supportive of the Australian Dollar, often seen as a risk-on asset. However, the Nasdaq 100 is showing a slight daily decline of 0.45% to 26562.39, indicating a mixed sentiment in the tech sector, which could temper the overall risk-on mood. If the equity markets were to turn significantly lower, it would likely increase demand for safe-haven assets, potentially benefiting the USD and pressuring AUDUSD.
Oil prices present a dual influence. Brent crude is at $95.89, up 3.73%, while WTI is at $89.77, up 3.99%. The surge in oil prices, likely driven by geopolitical tensions as suggested by recent news (e.g., Strait of Hormuz concerns and Middle East flare-ups), has implications for both inflation and commodity currencies. Higher oil prices can contribute to inflationary pressures, potentially leading central banks to adopt tighter monetary policies, which could strengthen their respective currencies. For Australia, as a major commodity exporter, rising oil prices can be supportive of the AUD. However, the simultaneous strength of the USD complicates this picture, as the dollar's appreciation often overshadows commodity price gains for pairs like AUDUSD.
Scenario Planning: What Lies Ahead for AUDUSD?
Considering the technical indicators, the prevailing DXY strength, and the upcoming economic data, several scenarios are plausible for AUDUSD. The immediate resistance at $0.71596 and $0.71637 presents a significant hurdle. A sustained break above these levels, particularly on strong Australian economic news or weaker US data, could open the door for further upside, targeting the $0.72067 daily resistance. On the flip side, failure to break higher, coupled with continued dollar strength or disappointing Australian data, could see AUDUSD retreat towards the 1-hour support at $0.71518 and potentially the 4-hour support at $0.71476. The daily support at $0.71380 would be a key level to watch in a more bearish scenario.
Bearish Scenario: Dollar Dominance Reigns
65% ProbabilityConsolidation Phase: Data Dependency Looms
25% ProbabilityBullish Rebound: Australian Strength Emerges
10% ProbabilityThe Road Ahead: Key Levels and Investor Focus
For traders and investors monitoring AUDUSD, the immediate focus remains on the $0.71569 price point and the surrounding resistance zone. The 1-hour chart shows resistance at $0.71596, $0.71637, and $0.71722. A decisive move above these levels would require significant fundamental catalysts, likely involving a weakening US Dollar or surprisingly strong Australian economic data. On the downside, support is found at $0.71518, $0.71476, and $0.71380. A break below these levels would signal a potential continuation of the bearish trend, especially if US economic indicators continue to outperform.
The interplay between the US Dollar Index (DXY) at 97.99 and the commodity markets will be crucial. While oil prices have surged, potentially benefiting the AUD, the dollar's strength remains a dominant factor. Investors should pay close attention to upcoming US economic data, particularly employment figures and manufacturing indices, as these will likely dictate the short-term direction. The technical picture on AUDUSD, with its mixed signals across timeframes, suggests a market awaiting a clear directional driver. The ADX values across different timeframes (1H: 20.59, 4H: 30.05, 1D: 20.18) indicate fluctuating trend strength, emphasizing the need for patience and confirmation before committing to a trade.
Frequently Asked Questions: AUDUSD Analysis
What happens if AUDUSD breaks above the $0.71596 resistance level?
A break above the $0.71596 resistance, particularly if confirmed by strong Australian economic data or weakening US Dollar Index (DXY) at 97.99, could propel AUDUSD towards the next daily resistance level at $0.72067. This bullish scenario hinges on sustained buying pressure and favorable macroeconomic shifts.
Should I buy AUDUSD at current levels near $0.71569 given the neutral RSI (51.1) and strong DXY?
Buying AUDUSD at $0.71569 requires careful risk management. While the 1H RSI at 51.1 shows slight upward bias, the strong DXY at 97.99 presents headwinds. A high-probability entry would likely require a confirmed breakout above resistance or a significant shift in US Dollar sentiment, making current levels speculative for aggressive buyers.
Is the Stochastic Oscillator's overbought reading on the daily chart (K=81.56) a sell signal for AUDUSD?
The daily Stochastic Oscillator showing K=81.56 does suggest overbought conditions, historically signaling potential pullbacks or consolidation for AUDUSD. However, in a trending market, these levels can persist. Confirmation from other indicators like RSI and price action near key resistance at $0.71596 is crucial before interpreting it as a definitive sell signal.
How will upcoming US employment data affect AUDUSD if it comes in stronger than the forecast of 1.4?
If US Non-Farm Payrolls data significantly beats the forecast of 1.4 (e.g., prints above 200K), it would likely strengthen the US Dollar (DXY) and put considerable downward pressure on AUDUSD. This could lead to a retest of support levels around $0.71476 or even lower, as the market prices in a more hawkish stance from the Federal Reserve.
Final Thoughts and Risk Management
The AUDUSD pair is at a critical juncture, caught between the persistent strength of the US Dollar and the potential for commodity-driven gains, all while key economic data looms. The technical indicators present a mixed picture, with short-term bullish signals battling against longer-term headwinds and overbought conditions on the daily chart. The DXY at 97.99 remains a significant factor, and upcoming US economic releases will be pivotal in determining whether AUDUSD can overcome the resistance at $0.71569 or if it will retreat towards its support levels. For astute traders, patience and a robust risk management strategy are paramount. Waiting for clear confirmation through decisive price action and aligning trades with the dominant fundamental narrative will be key to navigating this uncertain market environment.
Track markets in real-time
AI-powered analysis, technical indicators and real-time price data.
Join Our Telegram Channel
Breaking market news, AI analysis and trading signals instantly.
Join Channel