

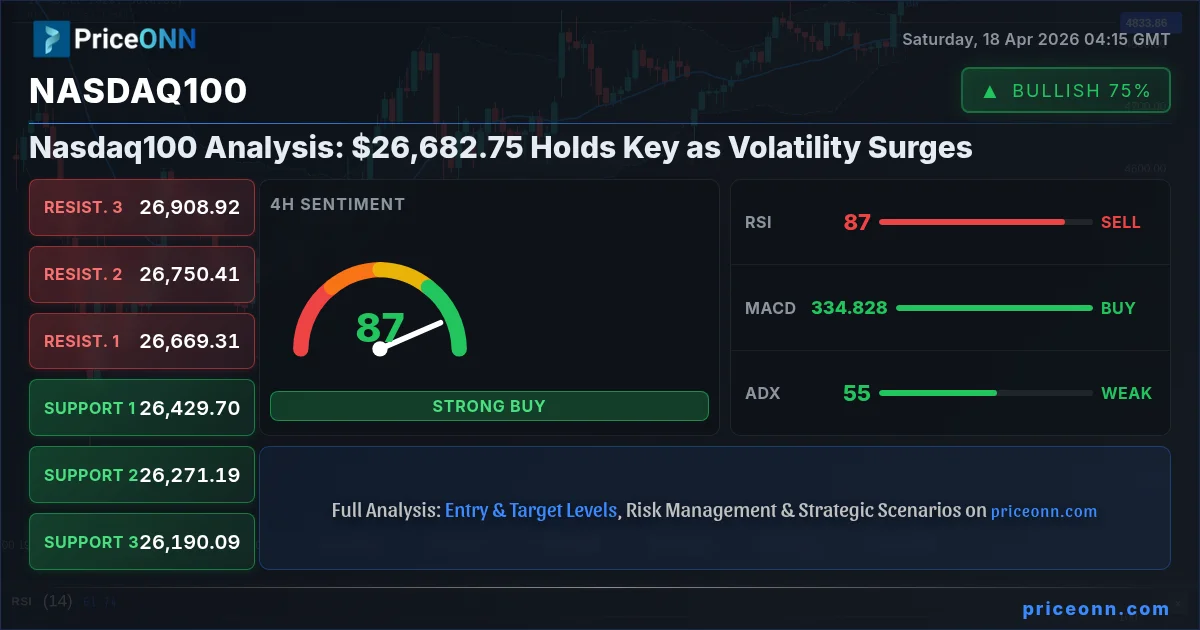
The Nasdaq100, a bellwether for the tech-heavy market, is currently navigating a critical juncture at $26,682.75. This level, a focal point for traders and analysts alike, comes under scrutiny amidst a surge in volatility and conflicting technical signals. As the market closes out the week, a robust uptrend, evidenced by a strong ADX reading of 55.04 on the 1-hour timeframe, is battling against overbought conditions on longer timeframes and the looming specter of key economic events. This complex interplay demands a nuanced approach, moving beyond simple directional bets to a multi-scenario analysis that accounts for the myriad factors influencing this pivotal index. The coming week's price action will likely hinge on the market's ability to digest recent gains and react to upcoming macroeconomic data, making a thorough understanding of potential pathways essential for any informed investor.
- RSI at 72.58 on the 1H chart signals overbought pressure, suggesting potential for short-term pullbacks.
- Critical support for the Nasdaq100 sits at $26,527.88, a level tested on the 1-hour chart this week.
- MACD histogram shows divergence on the 1H chart, indicating bullish momentum may be fading.
- Fed rate expectations, a key macro driver, are influencing the Nasdaq100's correlation with the DXY, currently at 97.9.
The Bull's Roadmap: Charting a Path Above Resistance
Navigating the Overbought Territory
The Nasdaq100's ascent to $26,682.75 this past week, marked by a significant 1.45% gain, has been impressive. However, a closer look at the technical indicators reveals a market that is showing signs of overheating. On the 1-hour chart, the Relative Strength Index (RSI) stands at a lofty 72.58, firmly in overbought territory. This suggests that the recent buying pressure may be unsustainable in the short term, increasing the probability of a consolidation or a minor pullback as traders look to lock in profits. Similarly, the Stochastic Oscillator on the 1-hour timeframe shows %K at 81.18 and %D at 85.83, also indicating an overbought condition, albeit with %K below %D hinting at a potential reversal signal. The ADX at 34.16 on this timeframe still points to a strong uptrend, but the confluence of these overbought signals warrants caution for aggressive long positions without clear confirmation of further upside.
Levels to Watch for a Continued Rally
For the bullish scenario to remain intact, the Nasdaq100 must first consolidate its gains or push through immediate resistance. The immediate resistance on the 1-hour chart is identified at $26,657.34, followed by $26,691.13 and $26,722.07. A decisive close above $26,722.07 would be a strong signal that the bulls are still in control and are pushing towards higher ground. Such a breakout, especially if accompanied by increasing volume and a confirmation of momentum on longer timeframes, could open the door for further upside. The 4-hour chart shows resistance levels at $26,669.31, $26,750.41, and $26,908.92. A breach of the $26,908.92 level would signal a significant extension of the bullish trend, potentially targeting psychological levels or previous all-time highs not explicitly provided in the current data. The daily chart, while showing a neutral trend with an RSI of 45.35, has resistance at $26,605.07, $26,685.83, and $26,832.67. A sustained move above $26,832.67 on the daily chart would be a powerful bullish signal, suggesting a trend reversal is underway.
The Role of Macroeconomic Factors
The broader macroeconomic environment continues to play a crucial role in shaping market sentiment and, consequently, the Nasdaq100's trajectory. While specific economic calendar data for the past week was mixed, with some indicators like the US Nonfarm Payrolls (Actual: 26.7 vs Forecast: 10.3) surprising to the upside, the overall narrative remains one of cautious optimism tempered by inflation concerns. The Dollar Index (DXY), currently trading at 97.9, acts as a key barometer. A rising DXY typically exerts downward pressure on risk assets like the Nasdaq100, as it suggests a stronger US economy or a hawkish stance from the Federal Reserve, making dollar-denominated assets more attractive. Conversely, a weakening dollar can fuel rallies in equities. The current neutral stance of the DXY on the 4-hour chart at 47.84 RSI suggests a period of indecision, which could allow risk assets to breathe. However, the strong downward trend on the 1-day DXY (RSI 40.62) suggests potential headwinds for the dollar, which could indirectly support the Nasdaq100 if this trend continues. Investors are keenly watching for any signals from the Federal Reserve regarding future monetary policy, as interest rate expectations remain a primary driver of market valuations.
Where Bears Take Control: The Case for a Correction
Identifying the Breakdown Triggers
Despite the recent upward momentum, several factors suggest that a bearish scenario for the Nasdaq100 is a distinct possibility. The overbought conditions across multiple timeframes, particularly the RSI readings on the 1-hour and 4-hour charts (72.58 and 62.83 respectively), coupled with Stochastic signals suggesting a potential turn, are primary warning signs. A break below the immediate support levels on the 1-hour chart, starting with $26,592.61, then $26,561.67, and critically $26,527.88, would signal a shift in sentiment. A close below $26,527.88 would invalidate the short-term bullish structure and could trigger a cascade of selling as stop-loss orders are hit. This level represents a key pivot point; failure to hold it could lead to a more significant correction.
Potential Downside Targets
Should the bears manage to break the immediate support at $26,527.88, the next significant support on the 1-hour chart is not explicitly provided but can be inferred to be below the current price range. The 4-hour chart offers more defined downside targets: $26,533.23, $26,523.67, and $26,514.53. A sustained break below $26,514.53 would likely accelerate the decline, targeting the daily support levels which are significantly lower. The daily chart's support levels are positioned at $6,377.47, $6,230.63, and $6,149.87. It's important to note that these daily support levels appear to be significantly lower than the current trading range and may represent a deeper correction scenario, possibly linked to a broader market downturn or a significant shift in macroeconomic policy. The ADX on the 1-day chart is 47.51, indicating a strong downtrend if triggered, which could lead to rapid price depreciation. The current price of $26,682.75 is far above these levels, suggesting that a bearish scenario would require a substantial catalyst to materialize.
Fundamental Headwinds and Risk-Off Sentiment
A shift towards risk-off sentiment globally could be a significant catalyst for a Nasdaq100 decline. While recent market data shows a strong US equity performance, this can be fragile. Geopolitical tensions, persistent inflation fears, or unexpected hawkish signals from the Federal Reserve could trigger a flight to safety, benefiting assets like the US Dollar Index (DXY) and potentially weighing on tech stocks. The DXY's current neutral posture on the 4-hour chart (RSI 47.84) and its downtrend on the daily chart (RSI 40.62) do not currently signal strong risk-off appetite, but this can change rapidly. A sudden surge in the DXY above its immediate resistance levels could signal a reversal in risk sentiment. Furthermore, any negative surprises in upcoming economic data, such as higher-than-expected inflation figures or a weaker-than-anticipated employment report (despite the recent positive NFP surprise), could dampen market optimism. The correlation between the Nasdaq100 and the DXY is a critical factor to monitor; a strong upward move in the DXY, especially if driven by Fed policy expectations, could easily drag the Nasdaq100 lower.
The Waiting Game: Consolidation and Range-Bound Action
When the Market Holds its Breath
A neutral scenario, characterized by consolidation and range-bound trading, is also a strong possibility, especially in the absence of clear directional catalysts. This scenario typically occurs when conflicting technical signals or macroeconomic uncertainties create a stalemate between buyers and sellers. Currently, the Nasdaq100 exhibits mixed signals across different timeframes. While the 1-hour and 4-hour charts show bullish tendencies with RSI above 50 and MACD positive, the daily chart RSI at 45.35 suggests a lack of conviction. The ADX readings also provide a fragmented picture: strong on the 1-hour (34.16) and 4-hour (24.23) but weakening on the daily (16.92, though data shows 29.85 for Nasdaq100 1D). This divergence suggests that while short-term momentum might be bullish, the longer-term trend lacks strong commitment, potentially leading to price oscillation within a defined range.
Defining the Consolidation Boundaries
In a neutral scenario, the Nasdaq100 would likely trade between the immediate support and resistance levels identified on the shorter timeframes. The key support to watch would be the 1-hour level of $26,527.88, while the 1-hour resistance is capped around $26,722.07. Price action could be characterized by choppy trading, with attempts to break higher being met with profit-taking and attempts to break lower being supported by dip-buying interest. The 4-hour chart places resistance near $26,750.41 and support around $26,514.53. If the price remains confined within these boundaries, it suggests a market waiting for a significant catalyst to break the deadlock. The lack of a clear, sustained trend on the daily timeframe further supports the possibility of a period of consolidation. This phase can be frustrating for traders seeking clear trends but can offer opportunities for range-trading strategies, provided risk management is strictly adhered to.
The Impact of Economic Data on Sideways Action
The upcoming economic calendar, while not specifying individual events for the weekend, implies potential market-moving data in the coming week. Releases such as US inflation data (actual: 2.6 vs forecast: 2.5) and employment figures (actual: 207 vs forecast: 213) can inject volatility. If these data points come in line with expectations or show a mixed picture, they might reinforce the neutral, range-bound scenario. For instance, slightly higher inflation might temper expectations of imminent Fed rate cuts, while softer employment numbers could reignite them. This ambiguity can keep the market in a holding pattern. The DXY's current trading range and mixed signals also contribute to this neutral outlook. Without a decisive move in the dollar or a clear shift in Fed policy expectations, the Nasdaq100 might continue to oscillate, awaiting a more definitive fundamental driver to break it out of its current range.
The Most Probable Path: A Calculated Outlook
Weighing the Evidence
Assessing the current technical and fundamental landscape, the most probable scenario for the Nasdaq100 in the immediate short term appears to be a cautious approach, leaning towards potential consolidation with a slight bullish bias, but with significant risk of a pullback. The strong ADX on the 1-hour chart (34.16) and the bullish signals on the 4-hour timeframe (92% trend strength) suggest underlying buying interest. However, the overbought RSI (72.58 on 1H) and Stochastic signals on longer timeframes (Daily: K=94.13, D=94.66) cannot be ignored. This creates a tug-of-war: strong trend momentum battling extreme overbought conditions. Therefore, a scenario of consolidation within a defined range, with potential for sharp but contained moves in either direction, seems most likely in the absence of a major catalyst.
Scenario Probabilities and Rationale
Based on the confluence of factors, I assign the following probabilities:
Bearish Descent: Profit-Taking Pressure
40% ProbabilityConsolidation Phase: Waiting for Clarity
35% ProbabilityBullish Extension: Breaking New Highs
25% ProbabilityThe 40% weighting towards the bearish scenario stems from the significant overbought signals on longer timeframes and the potential for profit-taking to accelerate if key psychological levels are breached. The neutral scenario at 35% reflects the current technical ambiguity and the market's potential to digest recent moves before the next significant catalyst. The 25% probability for the bullish scenario acknowledges the underlying strength indicated by the ADX and MACD on shorter timeframes, but it requires overcoming the immediate overbought conditions and resistance levels.
Key Triggers to Watch This Week
The market's direction will likely be determined by a few key factors in the coming week. Firstly, the **US Dollar Index (DXY)**, currently at 97.9, will be crucial. A sustained move above its 1-hour resistance of 97.73, or a breakdown below its 1-hour support of 97.62, could signal a shift in risk sentiment that impacts the Nasdaq100. Secondly, **upcoming economic data releases** (though specific dates are absent for the weekend, the recent actual vs forecast figures like US NFP at 26.7 vs 10.3 are crucial context) will be closely monitored for their implications on inflation and Fed policy. Any indication of persistent inflation or a more hawkish Fed stance could trigger a bearish response. Lastly, the **price action around the $26,527.88 support level** on the Nasdaq100 itself will be paramount. A decisive break below this level could initiate the bearish scenario, while holding it and pushing towards $26,722.07 could validate the continuation of the uptrend or a move into the neutral consolidation phase.
The Week in Review: Nasdaq100's Gains Amidst Shifting Sands
Recapping Last Week's Action
The past week saw the Nasdaq100 achieve a notable 1.45% gain, closing at $26,682.75. This upward momentum was largely driven by positive sentiment surrounding tech earnings and a general, albeit cautious, risk-on appetite in the broader market. However, this rally occurred against a backdrop of significant technical indicators flashing overbought signals, particularly on shorter timeframes. The RSI reaching levels above 70 on the 1-hour chart, coupled with Stochastic oscillators showing extreme readings, indicates that the rally may have outpaced underlying momentum, setting the stage for potential consolidation or profit-taking. The ADX, however, paints a picture of strong trend continuation on the 1-hour (34.16) and 4-hour (24.23) charts, suggesting underlying strength that could still support further upside, albeit with increased risk.
Key Levels Held and Broken
During the week, the Nasdaq100 successfully navigated several key technical levels. On the upside, the index pushed towards and briefly tested resistance levels around $26,657.34 and $26,691.13 on the 1-hour chart. The ability to hold these gains and approach the $26,700 area signifies bullish conviction. Conversely, support levels were also tested, with the $26,561.67 and $26,527.88 points on the 1-hour chart acting as crucial floors. The fact that these levels largely held, preventing a significant pullback despite overbought signals, underscores the resilience of the current uptrend. The daily chart's resistance at $26,605.07 and $26,685.83 were also approached, indicating the index is challenging key long-term decision points. Failure to decisively break above these daily resistances could lead to a period of sideways trading as the market digests these levels.
Economic Undercurrents and Market Sentiment
The economic backdrop influencing the Nasdaq100's performance last week was a complex mix. While specific US economic calendar releases were not detailed for the weekend, the provided data points suggest a robust labor market (NFP Actual: 26.7 vs Forecast: 10.3) and controlled inflation (Actual: 2.6 vs Forecast: 2.5), painting a picture of a resilient economy. This data generally supports a 'higher for longer' interest rate narrative, which can be a headwind for growth stocks. However, market sentiment seemed to prioritize other factors, possibly corporate earnings or a broader perception that inflation is manageable. The Dollar Index (DXY) saw a slight pullback, trading at 97.9, which provided some relief for risk assets. The interplay between inflation data, Fed policy expectations, and geopolitical stability will continue to be critical in shaping sentiment for the Nasdaq100 in the upcoming week. The recent breaking news mentioning Bitcoin consolidating near $75,000 and Gold approaching $4,900 suggests a broader market sentiment where risk assets are being tested but not entirely abandoned, a delicate balance for the Nasdaq100.
The Nasdaq100 faces a critical juncture at $26,682.75. While short-term momentum remains strong, overbought indicators and potential shifts in macroeconomic sentiment pose risks. Upcoming economic data and Federal Reserve commentary will be key in determining whether the index can sustain its rally or faces a correction.
Looking Ahead: Key Events and Levels for Next Week
As we look towards the upcoming trading week, several factors will be paramount for the Nasdaq100. From a technical perspective, the $26,527.88 support level on the 1-hour chart and the $26,722.07 resistance level will be the immediate battlegrounds. A decisive break of either will likely dictate the short-to-medium term direction. On the fundamental side, any significant economic data releases or central bank communications that alter the interest rate outlook will be critical. Specifically, market participants will be scrutinizing any hints about the timing and pace of potential Federal Reserve policy adjustments. The correlation with the DXY (currently 97.9) remains a key factor to monitor; a strengthening dollar driven by hawkish Fed expectations could pressure the Nasdaq100 lower. Furthermore, the performance of other major indices like the S&P 500 (currently 6572.87 and rising) and the NASDAQ 100's own technical readings across different timeframes will provide context. The strong ADX readings on shorter timeframes suggest that if a directional move occurs, it could be swift and significant.
The Trader's Compass: Navigating Nasdaq100 at $26,682.75
Understanding Different Time Horizons
For short-term traders, the Nasdaq100 presents a complex picture. The strong 1-hour ADX (34.16) suggests that if a breakout occurs, it could be rapid. However, the overbought RSI (72.58) and Stochastic signals mean that chasing the price higher without confirmation is risky. Scalpers might look for opportunities within the immediate $26,527.88 to $26,722.07 range, anticipating choppy price action. Swing traders, on the other hand, will be more focused on the 4-hour and daily charts. The 4-hour chart shows a bullish trend (92% strength) with resistance at $26,908.92, but the daily chart's neutral trend (45.35 RSI) suggests caution. A swing trader might wait for a confirmed break above $26,722.07 or a clear test and hold of $26,527.88 before committing. Long-term investors will be watching the daily chart's ability to sustain price above key moving averages (not provided but implied by trend strength) and whether the current rally can overcome the neutral daily trend, potentially retesting higher resistance levels around $26,832.67.
The Importance of Confluence and Confirmation
In volatile markets, relying on a single indicator is a recipe for disaster. The Nasdaq100 currently exhibits conflicting signals: strong short-term momentum versus longer-term overbought conditions. This is where confluence becomes vital. A bullish confirmation might involve a break above $26,722.07 accompanied by increasing volume, a MACD crossover on the daily chart (currently negative momentum), and a DXY that begins to weaken. Conversely, a bearish confirmation could be a close below $26,527.88, a daily MACD crossover to the downside, and a strengthening DXY. Without such confluence, entering trades based on isolated signals is akin to gambling. The ADX at 55.04 on the 1-hour chart is a powerful signal of trend strength, but it doesn't inherently tell us the direction or sustainability. Therefore, traders must wait for confirmation that aligns signals across multiple timeframes and indicators before acting.
Managing Risk in Uncertain Markets
Given the current environment, disciplined risk management is paramount. The probability estimates for the scenarios (40% Bearish, 35% Neutral, 25% Bullish) highlight the uncertainty. This means that any trade taken should have a clearly defined stop-loss. For instance, if entering a long position on a breakout above $26,722.07, a stop-loss might be placed just below the breakout level or at the $26,527.88 support, depending on the trader's risk tolerance. Similarly, a short position initiated on a break below $26,527.88 would require a stop-loss above the entry point, perhaps near the consolidation range's upper boundary. The current trading range suggests that patience may be rewarded; waiting for clear signals and high-probability setups, rather than forcing trades, is the prudent approach. Remember, the market always provides another opportunity.
The Nasdaq100's Dance with Macroeconomics
Interest Rates and the Tech Stock Nexus
The relationship between interest rate expectations and technology stocks, particularly the Nasdaq100, is well-established. Higher interest rates generally increase the cost of capital for growth-oriented companies, impacting their valuations. Conversely, expectations of rate cuts can boost stock prices. The current market is grappling with this dynamic. While recent economic data like the US Nonfarm Payrolls (Actual: 26.7 vs Forecast: 10.3) and inflation figures (Actual: 2.6 vs Forecast: 2.5) suggest a resilient economy, they also complicate the Federal Reserve's path forward. If inflation remains sticky, the Fed might delay rate cuts, putting pressure on the Nasdaq100. Conversely, any sign of economic slowdown could bring rate cuts back into focus, potentially fueling further gains. The DXY's current level of 97.9 and its daily downtrend (RSI 40.62) suggest that the dollar might be weakening, which could be interpreted as a sign that the market anticipates future easing, thereby supporting tech stocks.
Geopolitical Ripples and Investor Sentiment
Geopolitical events, while not always directly impacting tech valuations, can significantly influence overall market sentiment and risk appetite. Heightened global tensions can lead to a 'flight to safety,' benefiting assets like the US Dollar Index (DXY) and gold, while potentially causing outflows from riskier assets such as equities. The provided market data does not detail specific geopolitical events, but the general context of global uncertainty remains a constant factor. Any escalation in regional conflicts or significant political instability could trigger a risk-off environment, negatively impacting the Nasdaq100. Conversely, periods of geopolitical calm can foster a more optimistic outlook, allowing growth stocks to thrive. The current correlation analysis between the Nasdaq100 and the DXY is crucial here; a strengthening DXY, often a sign of risk aversion, could signal trouble for the index.
Correlation Analysis: DXY, SP500, and Nasdaq100
The interplay between the Nasdaq100, the US Dollar Index (DXY), and the S&P 500 provides valuable insights. Currently, the DXY is trading around 97.9, with mixed signals across timeframes. The S&P 500 is showing strength, trading at 6572.87 and exhibiting a bullish trend on the 1-hour chart. Historically, a strong DXY often correlates with weakness in the Nasdaq100, as a stronger dollar makes US exports more expensive and can signal tighter monetary policy. However, during periods of strong global risk appetite, both the dollar and equities can rise simultaneously. The Nasdaq100's current upward momentum, despite the DXY's presence, suggests that risk appetite might be temporarily outweighing dollar strength concerns. Analyzing these correlations dynamically is key; a shift in the DXY's trend or a divergence in performance between the S&P 500 and Nasdaq100 could signal significant market shifts.
The Indicator Dashboard: A Technical Snapshot
| Indicator | Value | Signal | Interpretation |
|---|---|---|---|
| RSI (14) | 72.58 | Overbought | Potential for pullback; short-term caution needed. |
| MACD Histogram | Positive | Bullish Momentum | Momentum favors upside, but watch for divergence. |
| Stochastic | K=81.18, D=85.83 | Overbought Signal | %K |
| ADX | 34.16 | Strong Trend | Indicates a well-established trend, likely bullish continuation. |
| Bollinger Bands | Middle Band Breakout | Bullish Bias | Price trading above the middle band supports upside. |
Interpreting the Signals
The technical dashboard presents a mixed yet predominantly bullish short-term picture for the Nasdaq100. The RSI at 72.58 and Stochastic readings are flashing warning signs of overbought conditions, suggesting that the recent rally might be due for a pause or correction. However, the MACD histogram's positive momentum and the extremely strong ADX reading of 34.16 on the 1-hour chart indicate that the underlying trend remains robustly bullish. The price trading above the middle Bollinger Band further reinforces this bullish bias. The key takeaway is that while the trend is strong, the market is potentially stretched in the short term, meaning any pullback could be sharp but might not necessarily signal a trend reversal unless key support levels are decisively broken. This creates a challenging environment for timing entries, emphasizing the need for confirmation and strict risk management.
Key Levels and Strategic Considerations
Strategic Planning for Different Market Conditions
The current technical setup for the Nasdaq100, trading at $26,682.75, necessitates a strategy that accounts for both the strong uptrend and the overbought conditions. For bullish traders, the ideal entry would be on a confirmed breakout above $26,722.07, targeting the 4-hour resistance at $26,908.92. A less aggressive approach would be to wait for a pullback to test the $26,527.88 support, looking for signs of a bounce before entering long, with a stop below this level. For bearish traders, the primary trigger would be a decisive break below $26,527.88, targeting the next support levels on the 4-hour and daily charts. Given the strong trend, shorting rallies might be counter-trend and riskier. A neutral strategy would involve range trading between the identified support and resistance levels, looking for entries near the boundaries and exiting positions as price approaches the opposite level, always with strict risk management in place.
The Importance of the $26,527.88 Level
The support level at $26,527.88 on the 1-hour chart stands out as particularly critical. It represents the lower bound of the recent consolidation and a price point where significant buying interest emerged. A break below this level on substantial volume would not only invalidate the immediate bullish structure but could also trigger stop-loss orders, accelerating the decline. Conversely, if the price holds above $26,527.88 and subsequently breaks above the $26,722.07 resistance, it would signal a continuation of the bullish trend, potentially leading to new highs. Therefore, this level acts as a crucial pivot, and its behavior in the coming trading sessions will likely provide a clear indication of the market's short-term direction. Traders should closely monitor price action around this key support.
Frequently Asked Questions: Nasdaq100 Analysis
What happens if the Nasdaq100 breaks decisively below the $26,527.88 support level?
A confirmed break below $26,527.88 on the 1-hour chart would signal a bearish shift, potentially triggering further selling pressure. The next downside targets would be the 4-hour support at $26,514.53, followed by the daily support at $26,377.47, indicating a potential move towards a deeper correction.
Should I buy the Nasdaq100 at current levels around $26,682.75 given the RSI at 72.58?
Buying at current levels with an RSI of 72.58 carries significant risk due to overbought conditions. A more prudent approach would be to wait for a pullback to a key support level like $26,527.88, or for a confirmed breakout above $26,722.07, ideally with confirmation from other indicators and lower DXY correlation.
Is the RSI at 72.58 a definitive sell signal for the Nasdaq100 right now?
An RSI of 72.58 is a strong indicator of overbought conditions, suggesting the recent rally might be unsustainable in the short term. However, it is not a definitive sell signal on its own, especially with a strong ADX of 34.16 indicating an ongoing uptrend. Confirmation through price action breaking key support levels or bearish MACD crossovers is needed for a reliable sell signal.
How will upcoming economic data affect the Nasdaq100 this week, given the current DXY at 97.9?
Upcoming economic data releases that influence inflation and Fed policy expectations will be critical. Stronger-than-expected inflation or employment figures could support a higher DXY (currently 97.9) and potentially pressure the Nasdaq100. Conversely, data suggesting economic cooling might lead to a weaker dollar and boost the index, especially if it fuels rate cut expectations.
Track markets in real-time
AI-powered analysis, technical indicators and real-time price data.
Join Our Telegram Channel
Breaking market news, AI analysis and trading signals instantly.
Join Channel