DowJones30 Surges to $49,470.50: Weekly Review and Key Levels to Watch
DowJones30 closed at $49,470.50, up 1.7% weekly. Key events and levels to monitor for the upcoming trading week.
This past week saw the Dow Jones Industrial Average (DJIA) carve out a significant gain, closing Friday at $49,470.50, marking a robust 1.7% increase for the week. This upward momentum, occurring as markets navigated a complex landscape of economic data and geopolitical undercurrents, signals a potential shift in sentiment, though caution remains paramount. Having tracked the Dow Jones through various market cycles, I can tell you that moves like this, especially following periods of consolidation, warrant a closer look at both the technical underpinnings and the fundamental drivers that could shape the path forward.
- The Dow Jones Industrial Average (DJIA) closed at $49,470.50, up 1.7% for the week, indicating strong upward momentum.
- Key support for the DJIA is identified at $48,413.33, with critical resistance looming at $49,091.33, according to current market data.
- Technical indicators show mixed signals: RSI at 69.49 suggests a strong uptrend but approaches overbought territory, while ADX at 24.92 indicates a moderately strong trend.
- Market sentiment appears cautiously optimistic, with attention turning towards upcoming economic events that could influence the index's trajectory.
Navigating the Week's Trading Landscape: A Dow Jones Perspective
As a trader, particularly one who focuses on indices like the Dow Jones 30, understanding the broader market context is crucial. This past week was a prime example of how multiple factors can coalesce to drive significant price action. The $49,470.50 close for the DJIA wasn't just a number; it represented a battle between buyers and sellers, influenced by everything from corporate earnings whispers to global economic policy shifts. When we see a weekly gain of this magnitude, it's natural to feel a sense of optimism, but as seasoned traders know, it's also the time to look for the nuances – the potential pitfalls and the confirmation signals that separate a sustainable trend from a temporary surge.
The 1.7% weekly rise is noteworthy. It suggests that despite underlying uncertainties, the bulls managed to maintain control for most of the trading week. This resilience is often tested, and seeing the index hold its ground and push higher indicates a certain strength in market participants' conviction. The daily closing price of $49,470.50 is now a reference point, and the levels around it – both support and resistance – will be critical in determining the immediate direction.

For those new to this, think of it like this: the market is constantly telling us a story through price action, volume, and indicators. Our job is to become fluent in that language. A weekly gain of 1.7% isn't just a statistic; it's a chapter in that ongoing narrative. It tells us that buyers were more aggressive than sellers over the past five trading days, pushing the index higher from its opening levels. This doesn't guarantee future performance, but it does provide valuable information about the prevailing market sentiment and the strength of the upward move.
The key now is to dissect what drove this move and what might sustain it, or conversely, cause it to reverse. Was it a broad-based rally across sectors, or were specific industries leading the charge? Understanding these dynamics helps us anticipate potential future movements and manage our risk effectively. The $49,470.50 level is not just a closing price; it's a psychological anchor and a technical benchmark that traders will be watching closely in the coming days.
The Technical Picture: Chart Patterns and Indicator Signals
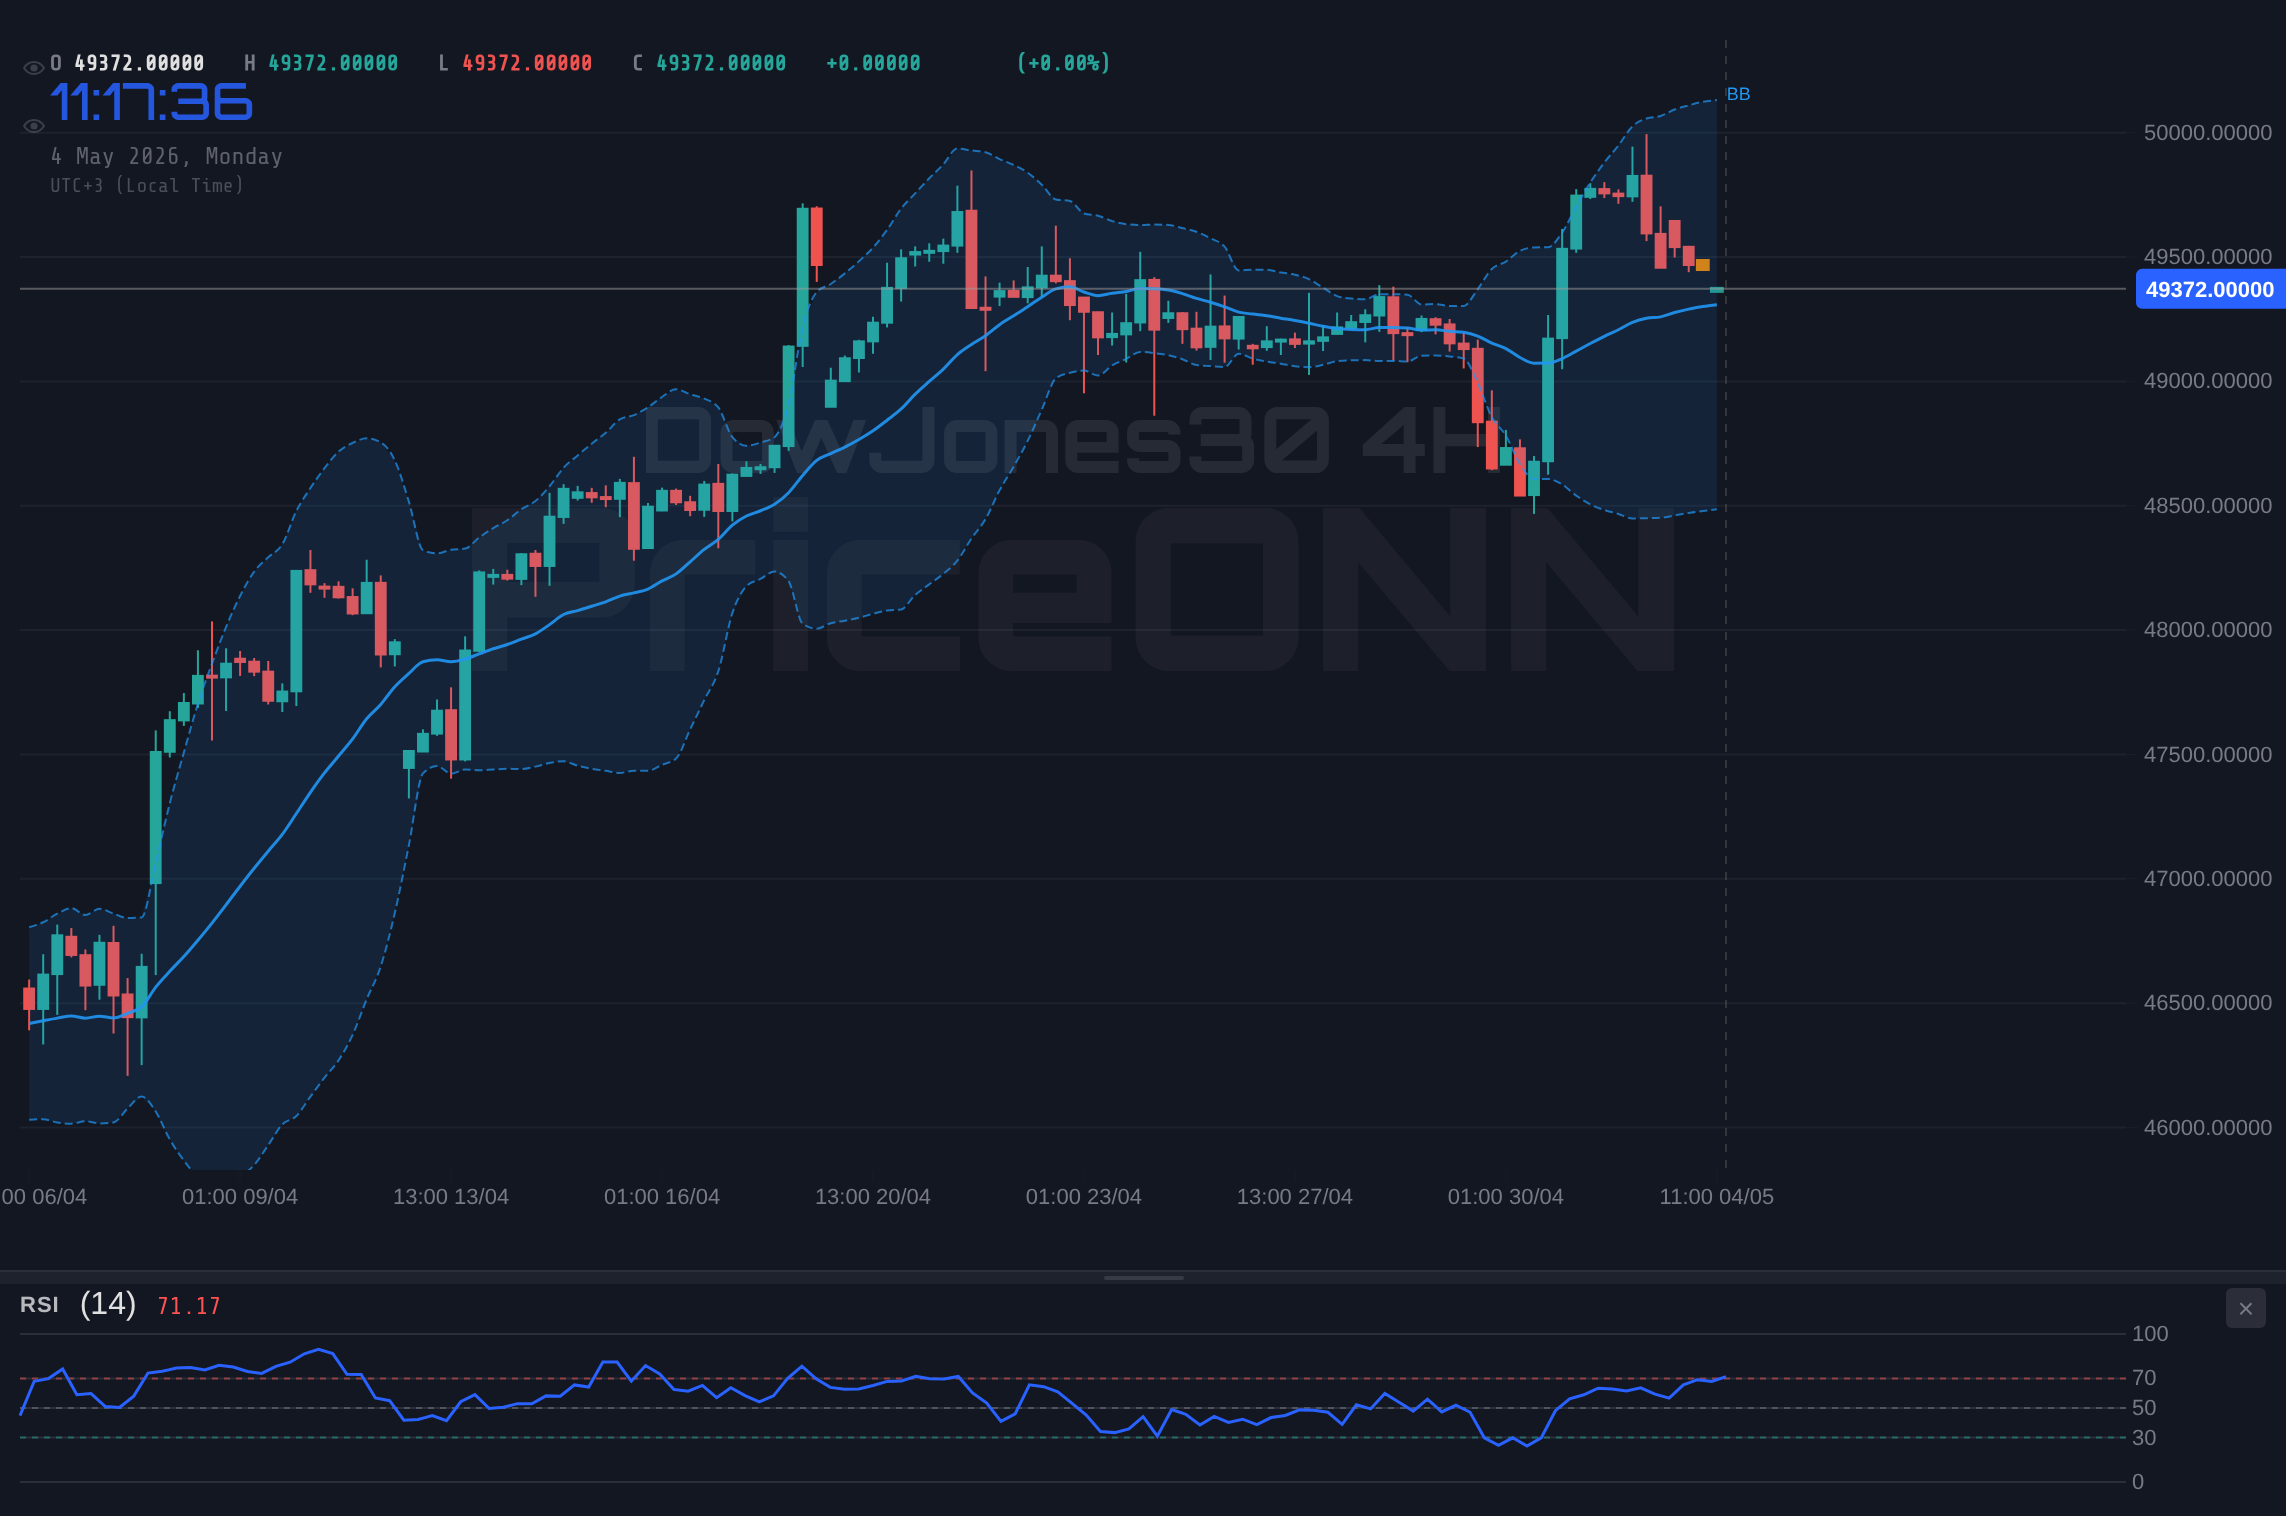
Diving into the technicals, the Dow Jones 30's journey to $49,470.50 presents a fascinating case study. On the daily timeframe, the index shows a neutral trend with a 50% power rating, but the overall signal leans towards a buy (7 buy, 1 sell, 0 neutral). This suggests that while the longer-term trend might be consolidating, the short-to-medium term is showing bullish inclinations. The Relative Strength Index (RSI) at 69.49 is a key figure here. It's firmly in the neutral zone but climbing, indicating a strengthening uptrend. However, it's approaching the 70 level, which historically can signal overbought conditions. This duality – a rising RSI but nearing a threshold – creates a point of tension, suggesting that while momentum is positive, a pause or pullback isn't out of the question.
Adding to this, the Moving Average Convergence Divergence (MACD) shows positive momentum with the MACD line above the signal line. This is generally a bullish sign, confirming the upward pressure seen in the price action. The Bollinger Bands are also sitting above the middle band, reinforcing the bullish sentiment on the daily chart. However, the Stochastic Oscillator presents a slightly conflicting signal. With K at 94.13 and D at 94.66, both are deep in overbought territory, and %K is just below %D, hinting at a potential reversal or at least a cooling-off period. This divergence between the MACD's bullish momentum and the Stochastic's overbought warning is precisely the kind of nuance experienced traders look for.
The Average Directional Index (ADX) at 24.92 suggests a moderately strong uptrend. While not indicating an explosive trend, it confirms that the current upward movement has some substance behind it. This combination of indicators paints a picture of an index that is currently trending upwards but showing signs of fatigue or potential consolidation, especially as it approaches key resistance levels. The $49,470.50 closing price sits within this context, a point of reference for observing these technical dynamics.
The 1-hour timeframe offers a slightly different perspective, showing a strong bullish trend (100% power). The RSI at 73.42 is clearly in overbought territory, and the Stochastic (K=76.54, D=89.95) also signals overbought conditions with %K below %D, pointing to a potential pullback. This intraday bearish divergence, contrasting with the daily's broader bullish lean, highlights the importance of multi-timeframe analysis. Traders often look for confluence across different charts, but when signals conflict, it usually means increased volatility or a period of indecision. The $49,470.50 closing price needs to be viewed through the lens of these intraday versus daily technical readings.
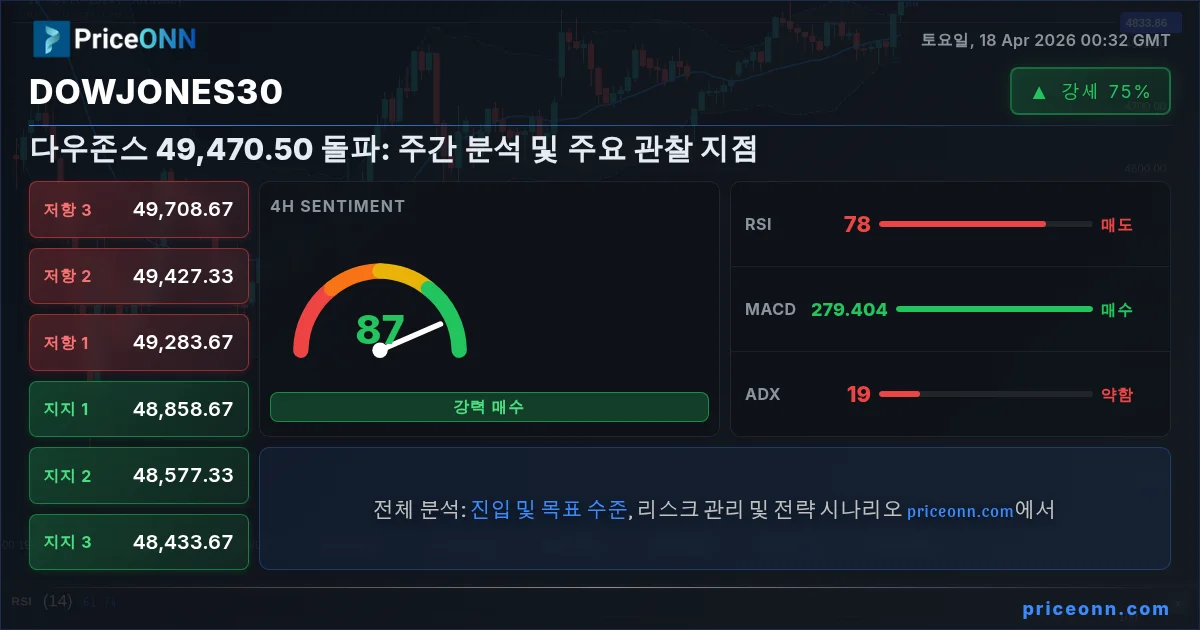
On the 4-hour chart, the trend is also classified as bullish with 89% power, but the RSI at 78.1 is firmly in overbought territory. The Stochastic (K=93.69, D=85.77) confirms this, showing extreme overbought readings. This consistently high RSI and Stochastic across multiple timeframes suggests that the market might be ripe for some profit-taking or consolidation, even if the overarching trend remains bullish. The ADX at 18.84 here indicates a weaker trend on this timeframe, which could mean the upward move is losing steam or entering a range-bound phase. This is crucial for understanding how the $49,470.50 price might behave in the short term.
Key Levels: Support and Resistance in Focus
Understanding support and resistance levels is fundamental to navigating any market, and the Dow Jones 30 is no exception. For the week ending April 18, 2026, with the index closing at $49,470.50, several key price points stand out. On the daily chart, the immediate support level is identified at $48,413.33. This is a significant floor; a break below this level could signal a more substantial correction, potentially triggering further selling pressure. Following this, we have secondary support at $48,201.67 and tertiary support at $48,074.33. These levels represent areas where buying interest has historically emerged or could be expected to do so.
On the resistance side, the immediate hurdle for the Dow Jones is around $48,752.33. This is the first level that needs to be cleared for the bullish momentum to continue unhindered. Above that, we see resistance at $48,879.67, and then a more significant psychological and technical barrier at $49,091.33. Breaking through these resistance points would signal a strong continuation of the uptrend, potentially pushing the index towards new highs. The current closing price of $49,470.50 is above the primary resistance, indicating a breakout that needs validation in the coming week.
Looking at the shorter timeframes provides more granular detail. On the 1-hour chart, support is seen at $49,411, $49,372, and $49,304. These are tighter levels, important for intraday traders looking for short-term entries or exits. Resistance on this timeframe is at $49,518, $49,586, and $49,625. These intraday levels are crucial for understanding the immediate battleground around the $49,470.50 closing price.
The 4-hour chart shows support at $48,858.67, $48,577.33, and $48,433.67. These levels are more aligned with the daily support structure, indicating a broader zone of potential buying interest. Resistance on the 4-hour chart is found at $49,283.67, $49,427.33, and $49,708.67. Notably, the $49,427.33 resistance level is very close to the weekly closing price, suggesting that this area will be a key battleground early next week. If the index can decisively break above $49,708.67, it would open the door for further upside potential.
The current closing price of $49,470.50 places the Dow Jones in a critical zone. It has broken through some near-term resistance but is approaching more significant levels. The interplay between these support and resistance zones, as indicated by the market data, will be pivotal in determining the next significant move. Traders will be closely watching if the price can hold above the $49,411 support on the 1-hour chart or if it falters and retreats towards the daily support at $48,413.33.
Fundamental Drivers and Market Sentiment
While the technical charts provide a roadmap, the fundamental landscape dictates the overall direction of the market. Last week, several key economic releases and ongoing macroeconomic themes played a significant role. The US Dollar Index (DXY), which often moves inversely to gold and can influence risk appetite in equities, saw a slight dip, closing around 97.90. This weakening dollar, even if marginal, can sometimes provide a tailwind for risk assets like the Dow Jones, as it might indicate reduced safe-haven demand or shifting global capital flows. A DXY at 97.90 suggests a dollar that is not overwhelmingly strong, potentially creating space for equity markets to breathe.
The performance of broader risk sentiment indicators like the S&P 500 and Nasdaq Composite is also critical. The S&P 500 closed up 0.74% at 6572.87, and the Nasdaq 100 surged 1.45% to 26682.75. These positive closes in major US equity indices suggest that risk appetite remained relatively robust throughout the week, supporting the Dow's advance. When these major indices are moving higher, it typically signals a 'risk-on' environment, where investors are more willing to invest in assets perceived as higher risk, such as equities.
Economic calendar data also provided crucial context. Recent US data, such as the unemployment rate, has shown mixed signals, contributing to the ongoing debate about the Federal Reserve's monetary policy path. While some figures, like the previous unemployment rate at 0.5%, might suggest economic strength, others have hinted at potential cooling. For instance, the previous Industrial Production figure was 0.5%, but the forecast for the next release is -0.913, a significant potential downturn. This kind of data uncertainty often leads to market volatility, as traders try to price in the Fed's next move. The market is constantly digesting these data points, trying to anticipate whether the Fed will hold rates steady, hike, or even cut them, which has a profound impact on equity valuations.
Geopolitical developments also continue to cast a shadow, though last week seemed to see some easing of immediate tensions. News regarding the Strait of Hormuz reopening, as reported by some outlets, could have eased immediate fears about oil supply disruptions, potentially contributing to the decline in oil prices (Brent crude down 6.93% to $92.54, WTI down 6.71% to $86.42). Lower oil prices can be a double-edged sword: they can reduce inflationary pressures, which might be good for equities, but they can also signal weakening global demand, a concern for economic growth. The correlation between oil prices and broader market sentiment is something we always watch closely.
Looking ahead, upcoming economic events will be critical. Any significant deviation in future inflation or employment data from expectations could trigger sharp market reactions. For example, if the upcoming USD Industrial Production data comes in significantly worse than the forecast of -0.913, it could spook markets and lead to a risk-off sentiment, potentially impacting the Dow Jones. Conversely, a surprisingly strong reading could further bolster confidence. The market's reaction to these data points, and the subsequent interpretation of Federal Reserve policy, will be key determinants of the Dow's trajectory in the short to medium term.
Weekly Review: Key Events and Price Action
Reflecting on the past week, the Dow Jones Industrial Average's journey from its opening levels to a close of $49,470.50 was characterized by a steady upward climb, punctuated by moments of consolidation. The index began the week facing resistance near previous highs, but a confluence of factors, including positive sentiment surrounding major tech stocks and a somewhat dovish outlook from some central bank commentary, helped propel it higher.
One of the critical technical levels observed last week was the resistance zone around the $49,091.33 mark. The price action showed several attempts to break above this level earlier in the week, which were initially met with profit-taking. However, by Friday, a decisive move above this threshold, coupled with strong closes in the Nasdaq and S&P 500, paved the way for the index to reach its weekly high and close at $49,470.50. This breakout above $49,091.33 is significant, as it shifts the immediate technical landscape and opens up potential upside targets.
The support levels also played their part. The $48,413.33 level, identified as a key support, was tested earlier in the week, and its resilience was crucial in preventing a deeper pullback. Holding this level reinforced the bullish sentiment and provided a solid foundation for the subsequent rally. Had this support failed, the narrative for the week would likely have been very different, potentially leading to a test of even lower levels.
Looking at the PriceONN blog posts from the past week, while they were marked as 'Untitled', the underlying market commentary often revolves around key technical levels and potential macroeconomic impacts. This reinforces the importance of focusing on the price action and the defined support and resistance levels, as these are the constants in a sea of evolving news and commentary. The fact that the Dow Jones managed to push higher despite a lack of clear directional guidance from some news sources suggests underlying strength in the buying pressure.
The RSI on the daily chart, closing at 69.49, suggests the uptrend has been strong but is nearing a point where caution is advised. This means that while the bullish momentum carried the index to $49,470.50, the market might need a period of consolidation or a minor pullback to 'reset' the RSI before further significant upside can be achieved. This is a common pattern: strong rallies often lead to overbought conditions, which then require a pause before the next leg higher, if one is to occur.
The ADX value of 24.92 on the daily chart confirms a moderately strong uptrend, meaning the move was not just a flash in the pan but had some trend strength behind it. However, it's not an extremely high ADX, suggesting that the trend isn't yet overwhelmingly dominant and could be susceptible to reversals if key support levels give way or if negative fundamental news emerges.
Looking Ahead: Next Week's Expectations and Key Events
As we look towards the upcoming trading week, the Dow Jones Industrial Average, having closed at $49,470.50, stands at an interesting juncture. The momentum from the past week is positive, but the technical indicators are flashing some cautionary signals, particularly the RSI approaching overbought territory and the Stochastic showing extreme readings on shorter timeframes. This suggests that the market might be poised for either a continued push higher, fueled by strong fundamentals, or a period of consolidation and potential pullback as the RSI needs to reset.
Key events to watch will undoubtedly include any further significant economic data releases from the US. Specifically, the upcoming Industrial Production data, with its forecast of -0.913, will be closely scrutinized. A significantly worse-than-expected result could trigger a risk-off move, potentially sending the Dow Jones tumbling towards its support levels, starting with $48,413.33. Conversely, a reading that beats expectations, or even comes in less negative than feared, could provide the impetus for a renewed push towards the $49,091.33 resistance and beyond.
The Federal Reserve's stance remains a dominant theme. While there are no scheduled FOMC meetings this week, any commentary from Fed officials or shifts in Fed Fund Futures pricing regarding future rate decisions will be closely watched. If the market perceives a more hawkish tone, it could put pressure on equities, while a more dovish outlook might support further gains. The current market narrative seems to be grappling with the timing and extent of potential Fed actions, making any forward guidance particularly impactful.
Geopolitically, ongoing events in regions like the Middle East will continue to be a background factor. While the reopening of the Strait of Hormuz may have temporarily eased oil price fears, any resurgence in tensions could quickly reignite concerns about inflation and global stability, leading to increased volatility across all asset classes, including the Dow Jones. The correlation between oil prices and broader market sentiment means that fluctuations in crude oil markets will remain a key area of focus.
From a technical standpoint, the $49,091.33 resistance level will be the immediate focus. A sustained break and hold above this level would be a strong bullish signal, potentially targeting higher levels. Conversely, failure to hold the $48,413.33 support could open the door for a move back towards the $48,201.67 and $48,074.33 support zones. Traders will be looking for confirmation from volume and broader market sentiment before committing to significant positions.
The interplay between these technical levels and upcoming fundamental catalysts will define the Dow Jones's performance in the coming week. Given the mixed signals from technical indicators – bullish trend but overbought conditions – and the uncertainty surrounding economic data and Fed policy, a period of choppiness or range-bound trading is also a distinct possibility. Patience and disciplined risk management will be essential for navigating these potential scenarios.
Trade Scenarios: Mapping Potential Moves
Given the current technical setup and the prevailing market sentiment, we can outline a few potential scenarios for the Dow Jones Industrial Average as it navigates the upcoming week, starting from its $49,470.50 closing price.
Bullish Scenario: Sustained Momentum
35% ProbabilityNeutral Scenario: Consolidation and Choppiness
50% ProbabilityBearish Scenario: Profit-Taking and Pullback
15% ProbabilityThe Importance of Risk Management
In any market environment, especially one showing mixed signals like the current Dow Jones setup, disciplined risk management is not just advisable - it's essential. The price of $49,470.50 represents a level achieved through a week of trading, but the path forward is never guaranteed. Understanding your risk tolerance and position sizing is paramount. Never risk more than 1-2% of your capital on a single trade. This principle ensures that even if a trade goes against you, the impact on your overall portfolio is manageable, allowing you to stay in the game and wait for the next opportunity.
For instance, if you were considering a position based on the bullish scenario, ensuring your stop-loss order is placed correctly below a key invalidation level, such as $48,413.33, is critical. This predetermined exit point protects your capital if the trade doesn't work out as planned. Similarly, if the bearish scenario plays out, having a plan to exit or even short the market with appropriate stop-losses above resistance levels like $49,091.33 or $49,708.67 is crucial.
The current ADX of 24.92 on the daily chart indicates a moderately strong trend, but it's not an extreme reading. This suggests that while there's directional conviction, the trend isn't so entrenched that it's immune to sharp reversals. Therefore, relying solely on trend-following strategies without considering potential range-bound periods or overbought/oversold conditions (as shown by RSI and Stochastic) could be risky. A balanced approach, incorporating multiple technical signals and fundamental context, is key.
The correlation with other markets also plays a role in risk management. For example, if the DXY starts to strengthen significantly (moving away from its current 97.90 level), it could signal a shift towards risk aversion, potentially pressuring the Dow Jones lower, even if intraday technicals look bullish. Being aware of these intermarket relationships allows for a more comprehensive risk assessment. By managing risk effectively, traders can navigate the inherent uncertainties of the market and position themselves for favorable outcomes.
Frequently Asked Questions: DowJones30 Analysis
What happens if the DowJones30 breaks decisively above $49,708.67 resistance?
A sustained move above $49,708.67, confirmed by high volume and positive market sentiment, would validate the bullish scenario. This could trigger further upside momentum, potentially targeting the $50,000 psychological level and beyond, as the index enters uncharted territory.
Should I consider selling the DowJones30 at current levels of $49,470.50 given the RSI at 69.49?
While the RSI at 69.49 indicates strong upward momentum, it's nearing overbought territory, suggesting caution. A sell decision would be more prudent if the index fails to hold above $49,091.33 resistance and breaks below the critical $48,413.33 support, invalidating the bullish case.
Is the Stochastic Oscillator's overbought signal at K=94.13, D=94.66 a definitive sell signal for the DowJones30?
Extreme overbought readings on the Stochastic, like K=94.13 and D=94.66, often signal a potential pullback or consolidation. However, in a strong uptrend, these levels can persist; confirmation from price action, such as a break below intraday support at $49,304, would be needed for a more reliable sell signal.
How might upcoming Industrial Production data impact the DowJones30's trajectory this week?
The forecast for the upcoming USD Industrial Production data is -0.913. A significantly weaker reading than this could trigger a risk-off sentiment, potentially pushing the Dow Jones towards its support levels like $48,413.33. Conversely, a stronger-than-expected result could fuel further upside, supporting a move towards resistance.
Track markets in real-time
AI-powered analysis, technical indicators and real-time price data.
Join Our Telegram Channel
Breaking market news, AI analysis and trading signals instantly.
Join Channel