

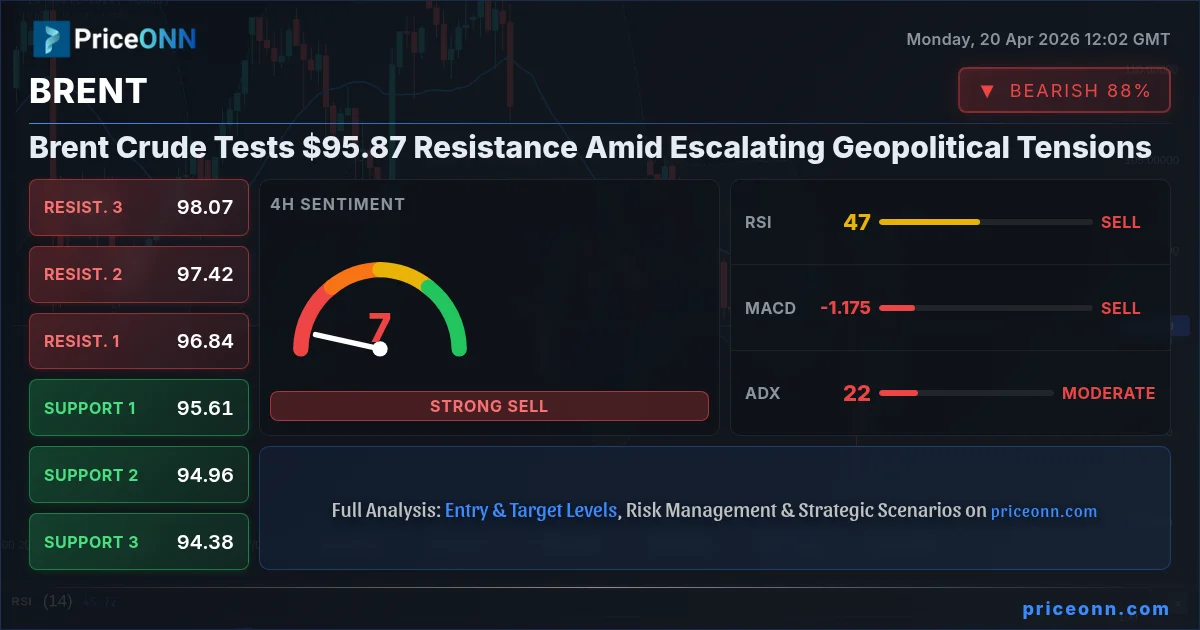
Brent crude oil is once again in the spotlight, currently trading just shy of the significant $96 mark at $95.87. This surge, a notable 3.71% increase on the day, is primarily fueled by escalating geopolitical tensions in the Middle East and renewed fears of supply disruptions. As traders eye the $97.40 resistance level, the market is grappling with a complex interplay of supply-side anxieties, demand outlooks, and broader macroeconomic signals. This analysis delves into the intricate factors driving Brent's current trajectory, exploring technical indicators, fundamental drivers, and the critical geopolitical landscape shaping the energy market.
- Brent crude is trading at $95.87, up 3.71% amid Middle East tensions.
- Key resistance at $97.40 and $96.35 are being tested; support lies at $95.30.
- Geopolitical risks are the primary driver, overshadowing demand concerns for now.
- ADX at 21.86 suggests a moderate trend, while RSI at 51.28 indicates neutral momentum with a slight upward bias.
The energy market is experiencing a palpable sense of urgency, with Brent crude at the forefront of a significant price rally. The current price of $95.87 is not merely a number; it represents a market reacting to palpable supply-side threats. The aggressive 3.71% daily gain, translating to $3.43 per barrel, underscores the market's sensitivity to developments in critical oil-producing regions. This upward momentum is testing the resolve of resistance levels, with $96.35 and $97.40 serving as immediate hurdles. Below, support is holding firm around $95.30, a level that has provided a floor for earlier price action.
The narrative driving this price action is undeniably geopolitical. Reports of escalating tensions in the Middle East, specifically concerning potential disruptions around vital shipping lanes like the Strait of Hormuz, have sent shockwaves through the oil complex. While specific details remain fluid, the mere threat of supply chain interruptions is enough to trigger a risk premium in oil prices. This fear often overshadows more nuanced fundamental factors like global demand, at least in the short term. The market's reaction highlights a persistent vulnerability in crude oil pricing, where geopolitical instability can rapidly alter the supply-demand balance, even without confirmed physical disruptions.
Navigating the Geopolitical Storm: Supply Fears Take Center Stage
The immediate catalyst for Brent's upward leap appears to be the heightened geopolitical temperature in the Middle East. While the specific news flow can be volatile, the underlying narrative revolves around the potential for conflict escalation and its direct impact on oil production and transit. Historically, any perceived threat to the Strait of Hormuz, through which a significant portion of global oil supply passes, triggers immediate price spikes. Traders and investors are pricing in a higher probability of supply disruptions, leading to a 'risk-on' sentiment specifically for oil assets. This is a classic example of how geopolitical events can inject volatility into commodity markets, often creating opportunities for swift price movements.
This situation is compounded by the general state of global energy inventories. While specific inventory data is not provided for this immediate moment, it's crucial to remember that global stockpiles have been a key factor in price sensitivity. If inventories are already at lower-than-average levels, any supply-side shock will have a more pronounced impact. Conversely, robust inventories can act as a buffer, mitigating the price reaction to geopolitical events. The current upward price action suggests that either inventories are not sufficient to absorb potential shocks, or the market is prioritizing the *risk* of disruption over the current physical supply balance.
Furthermore, the actions and rhetoric of major oil producers, particularly OPEC+ members, continue to play a crucial role. While the immediate driver is geopolitical, the underlying supply picture is still heavily influenced by OPEC+ production decisions. Saudi Arabia's commitment to voluntary cuts and Russia's participation in production adjustments remain key factors supporting the market. Any perceived wavering in OPEC+ discipline, or conversely, a signal of further coordinated action to manage supply, could significantly amplify or dampen the current bullish sentiment. The market is constantly balancing the immediate geopolitical risks against the longer-term supply management strategies of major oil blocs.
Technical Indicators Paint a Mixed, Yet Developing, Picture
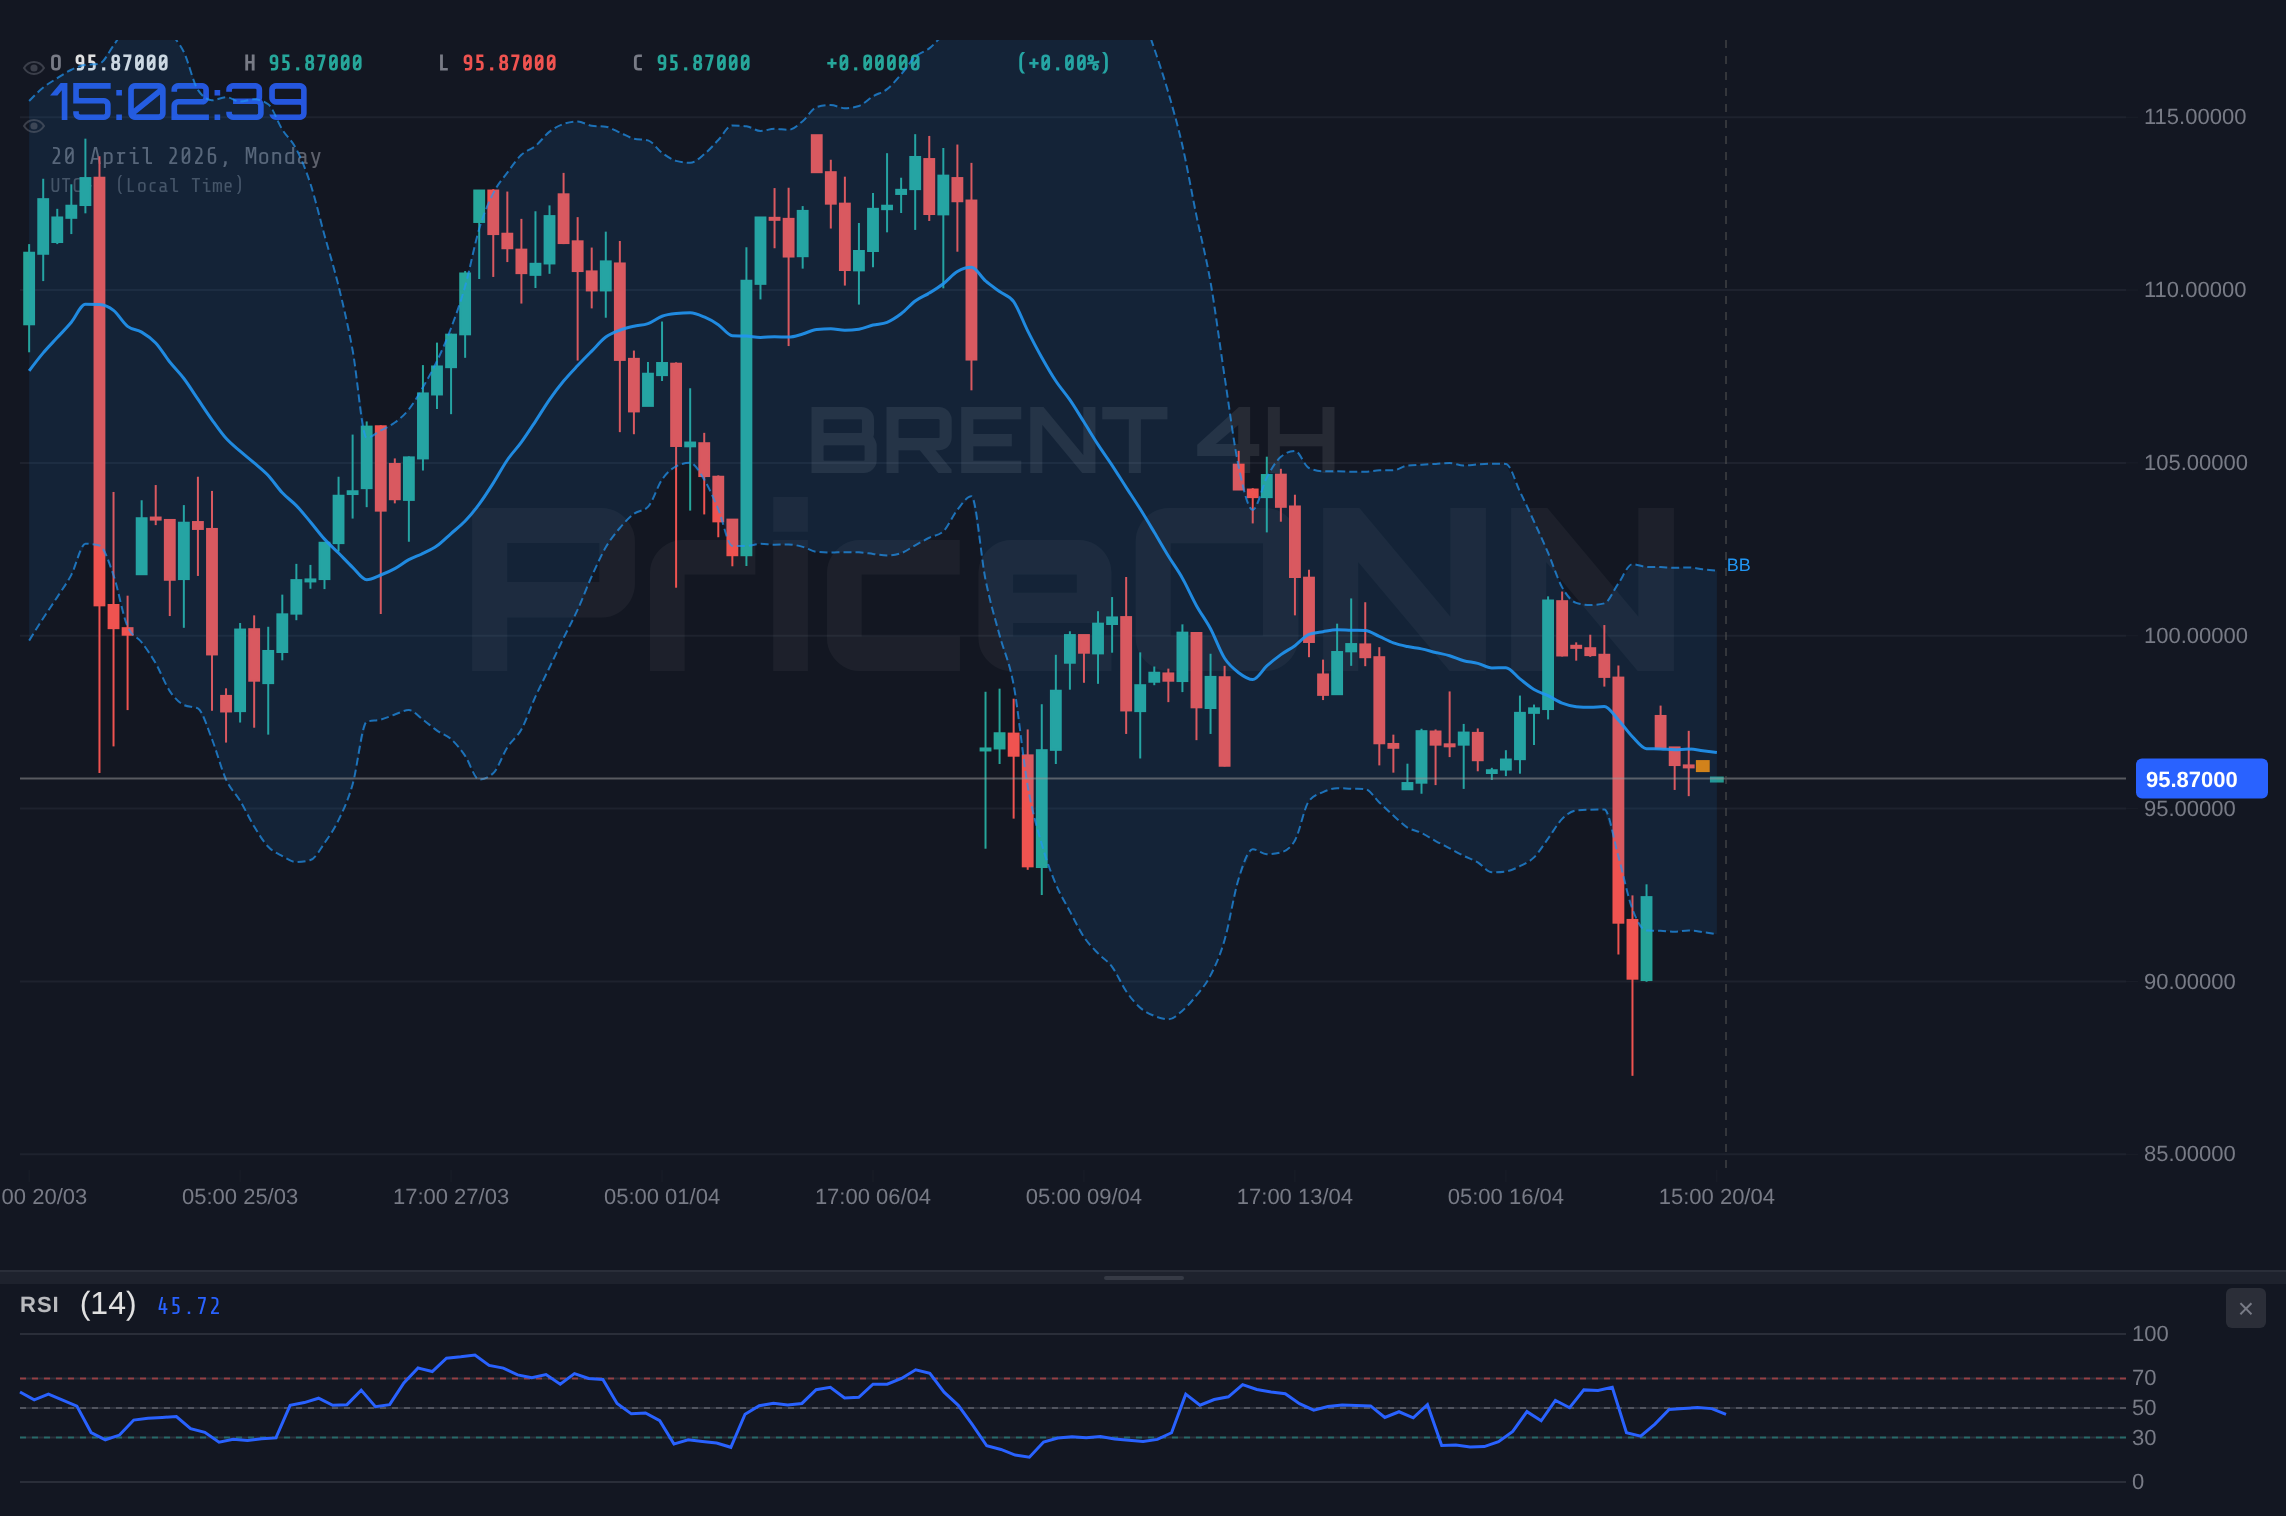
On the technical front, Brent crude presents a dynamic, albeit somewhat conflicting, picture across different timeframes. The 1-hour chart shows a neutral trend with moderate strength (ADX: 21.48), suggesting that while momentum is present, the trend has not fully committed. The RSI(14) at 51.99 hovers in the neutral zone, hinting at a slight upward bias, while the Stochastic indicator (%K > %D) signals a potential for further upside. However, the MACD remains in negative momentum territory, indicating that recent buying pressure might be facing headwinds. The Bollinger Bands are trading below the middle band, reinforcing a cautious outlook on the shorter timeframe.
Shifting to the 4-hour timeframe, the trend strength significantly increases to 89% and is characterized as 'Uplifting'. The RSI(14) at 52.03 continues to signal a neutral-to-upward bias. However, here we see a divergence in signals: the Stochastic indicator is showing a 'down' signal (%K
The daily chart offers a more bearish technical perspective, despite the intraday surge. The trend is classified as 'Downtrend' with strong conviction (86%). The RSI(14) at 52.34 is in the neutral zone with an upward tendency, but the MACD is positive and above its signal line, suggesting underlying bullish momentum building on this longer timeframe. The Bollinger Bands are trading above the middle band, indicating a potential for further upside. However, the Stochastic indicator is showing a 'down' signal (%K
Intermarket Correlations: DXY and Equities Weigh In
Understanding Brent's price action requires examining its correlation with other key markets. The Dollar Index (DXY), currently trading at 97.94 and showing a slight increase, plays a crucial role. Typically, a stronger dollar exerts downward pressure on oil prices, as oil is priced in dollars. A rising DXY can make oil more expensive for holders of other currencies, potentially dampening demand. However, in the current geopolitical-driven rally, this correlation might be temporarily weakened. If the Middle East tensions escalate significantly, safe-haven flows could boost both the dollar and oil prices simultaneously, creating an unusual market dynamic.
Equity markets, represented by the SP500 and Nasdaq, also provide valuable context. The SP500 is showing a strong upward move (0.74%), and the Nasdaq is down slightly (-0.48%). This divergence suggests a mixed risk appetite. A strong rally in equities generally correlates with increased demand for riskier assets, including oil, as it signals economic confidence. Conversely, a significant pullback in equities could signal a 'risk-off' environment, where investors flee to safety, potentially hurting oil prices. The current mixed signals from equities add another layer of complexity, indicating that investors are not fully committing to a single risk sentiment yet.
The interplay between oil prices and inflation expectations is also critical. Higher oil prices directly contribute to inflation, and central banks are keenly watching this relationship. If oil prices continue to climb significantly, it could force central banks, particularly the Federal Reserve, to adopt a more hawkish stance on interest rates. This, in turn, could strengthen the dollar and potentially dampen economic growth, creating headwinds for oil demand in the medium to long term. The current price action suggests that the immediate geopolitical fear premium is outweighing these longer-term inflation and interest rate concerns, but this balance could shift rapidly.
Trade Scenarios: Navigating the $95.87 Crossroads
Bearish Scenario: Supply Fears Subside, Demand Dominates
35% ProbabilityNeutral Scenario: Consolidation Amidst Uncertainty
30% ProbabilityBullish Scenario: Geopolitical Premium Persists
35% ProbabilityThe current technical indicators on the 1-hour chart show a 'Buy' signal (6 buys, 2 sells), while the 4-hour chart is neutral (4 buys, 4 sells), and the daily chart leans towards 'Buy' (6 buys, 2 sells). This overall technical confluence, particularly the strong intraday upward momentum and the daily chart's potential, supports the bullish scenario. However, the conflicting signals on the 4-hour chart and the moderate ADX reading (21.86) suggest that the trend is not yet fully established. Traders should remain vigilant for confirmation, especially a decisive break above key resistance levels or a clear de-escalation of geopolitical tensions.
Upcoming economic data releases, particularly those related to inflation and central bank policy, could introduce significant volatility. Traders should monitor these events closely as they may override geopolitical factors in shaping market sentiment.
The Road Ahead: Volatility Remains the Name of the Game
Looking ahead, Brent crude oil is poised to remain highly sensitive to geopolitical developments in the Middle East. The current price of $95.87 reflects a market pricing in a significant risk premium, and any further escalation could propel prices towards the $97.40 resistance and potentially challenge higher levels. Conversely, a de-escalation of tensions, coupled with any signs of weakening global demand or increased non-OPEC supply, could lead to a pullback, testing support levels around $95.30 and $94.25.
The technical picture, while showing some bullish signs on shorter timeframes, remains somewhat mixed, especially when viewed on the daily chart. The ADX at 21.86 suggests a trend that is gaining moderate strength, but the RSI at 51.28 indicates that the market is not yet in extreme territory. This suggests that while the current upward momentum is notable, it requires further confirmation to signal a sustained rally. Traders should watch for decisive closes above resistance or clear breakdowns below support to guide their positions.
Frequently Asked Questions: BRENT Analysis
What happens if BRENT breaks decisively above the $97.40 resistance level?
A sustained break above $97.40, especially if accompanied by further geopolitical escalation or strong OPEC+ signals, would likely open the door for prices to target the $98.07 level and potentially higher. This would indicate the market is fully pricing in supply risks.
Should I buy BRENT at current levels of $95.87 given the mixed technical signals?
Buying at $95.87 carries risk due to the mixed technical picture and potential for geopolitical de-escalation. A more prudent approach might be to wait for confirmation: either a break above $97.40 with strong momentum, or a pullback to support around $95.30 with signs of bottoming.
Is the RSI at 51.28 a sell signal for BRENT right now?
An RSI of 51.28 is in the neutral zone and shows a slight upward bias, not a sell signal. It indicates that the market is balanced, with neither buyers nor sellers having a clear upper hand at this precise moment. Confirmation from other indicators or price action is needed.
How will upcoming US inflation data affect BRENT this week?
Higher-than-expected inflation data could lead to hawkish central bank expectations, strengthening the dollar and potentially pressuring oil prices. Conversely, lower inflation might support risk appetite and ease rate hike fears, indirectly benefiting oil. The market's reaction will depend on how the data aligns with current expectations.
| Indicator | Value | Signal | Interpretation |
|---|---|---|---|
| RSI (14) | 51.28 | Neutral | Slight upward bias, not overbought or oversold |
| MACD Histogram | - | Negative Momentum | Suggests selling pressure may be present |
| Stochastic (%K/%D) | 36.98 / 55.15 | Downtrend Signal | %K below %D indicates potential weakness |
| ADX | 18.19 | Weak Trend | Trend lacks strong conviction, range-bound potential |
| Bollinger Bands | Below Middle | Bearish Bias | Price trading below the central moving average |
Track markets in real-time
AI-powered analysis, technical indicators and real-time price data.
Join Our Telegram Channel
Breaking market news, AI analysis and trading signals instantly.
Join Channel