

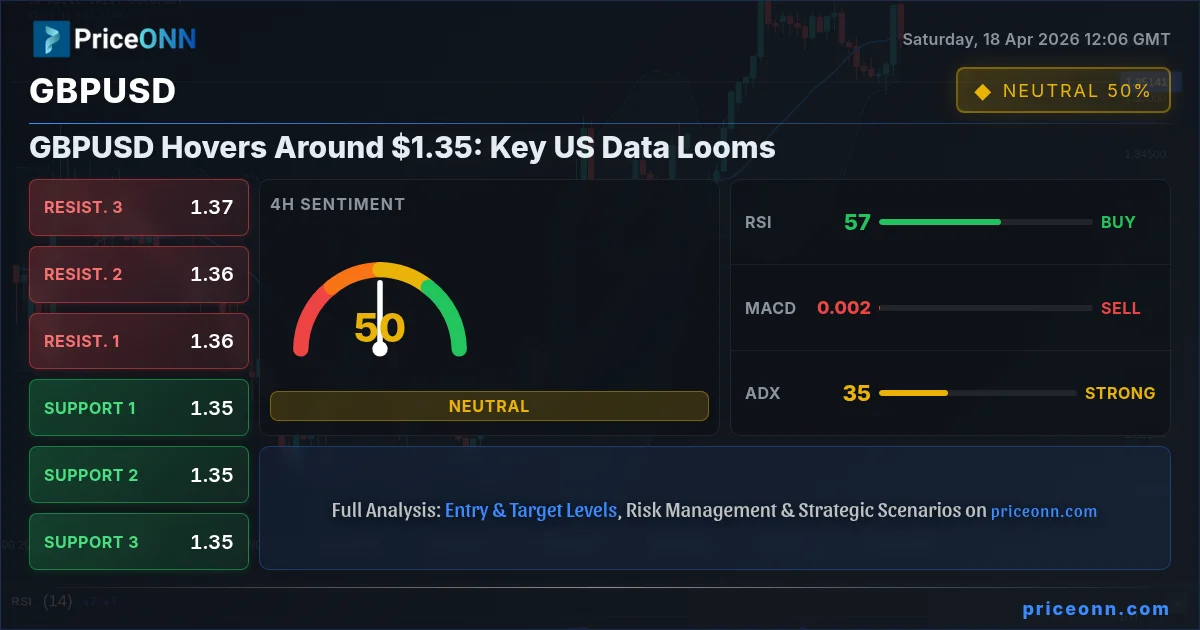
The British Pound to US Dollar (GBPUSD) exchange rate navigated a relatively flat week, consolidating around the critical psychological and technical level of $1.35. As the dust settles from last week's market activity, all eyes are now firmly fixed on the upcoming economic calendar, particularly a suite of high-impact US data releases that could inject significant volatility into the pair. Traders are grappling with conflicting technical signals, a strong underlying trend indicated by the ADX, yet divergence across oscillators, creating a tense standoff between bullish and bearish camps. This report delves into the technical landscape, fundamental drivers, and potential scenarios shaping the GBPUSD's trajectory as we head into a pivotal data-driven week.
- GBPUSD is consolidating around $1.35, with the 1-hour RSI at 38.74 indicating bearish pressure.
- Key support for GBPUSD is identified at $1.3503, while resistance is seen at $1.3571.
- The ADX at 34.77 on the 1-hour chart suggests a strong trend is in play, though signals conflict.
- Upcoming US Retail Sales and Inflation data are key catalysts for the next significant move in GBPUSD.
The Tug-of-War at $1.35: Bulls vs. Bears Square Off
Navigating Choppy Waters: A Week of Consolidation
Last week proved to be a period of consolidation for the GBPUSD, a familiar pattern when significant economic events loom. The pair oscillated within a tight range, failing to establish a decisive directional bias. While there were brief attempts to push higher, particularly following the release of stronger-than-expected UK GDP data on Tuesday, these rallies were met with selling pressure, capping gains. Conversely, downside attempts were cushioned by support levels that, for now, appear to be holding firm. This lack of clear direction is often a precursor to a significant price move, as markets digest incoming information and position themselves ahead of key data points. The $1.35 handle, a confluence of psychological importance and technical significance, has become the battleground where bulls and bears are locked in a strategic stalemate. The price action observed over the past few days - ranging between $1.35035 and $1.35978 - underscores this indecision, with neither side able to gain a sustained advantage.
From a technical standpoint, the multi-timeframe analysis paints a somewhat mixed picture. On the 1-hour chart, the Relative Strength Index (RSI) hovers at 41.85, firmly in bearish territory and suggesting that momentum is favouring sellers in the very short term. The Moving Average Convergence Divergence (MACD) shows momentum is balancing, but remains below its signal line, reinforcing the short-term bearish sentiment. Bollinger Bands on this timeframe are trading above the middle band, hinting at a potential upward bias, yet Stochastic Oscillator readings (%K at 21.26, %D at 50.46) clearly signal a bearish trend, with the %K line below the %D line. This confluence of short-term bearish indicators on the 1H chart suggests that any immediate upside may face headwinds.
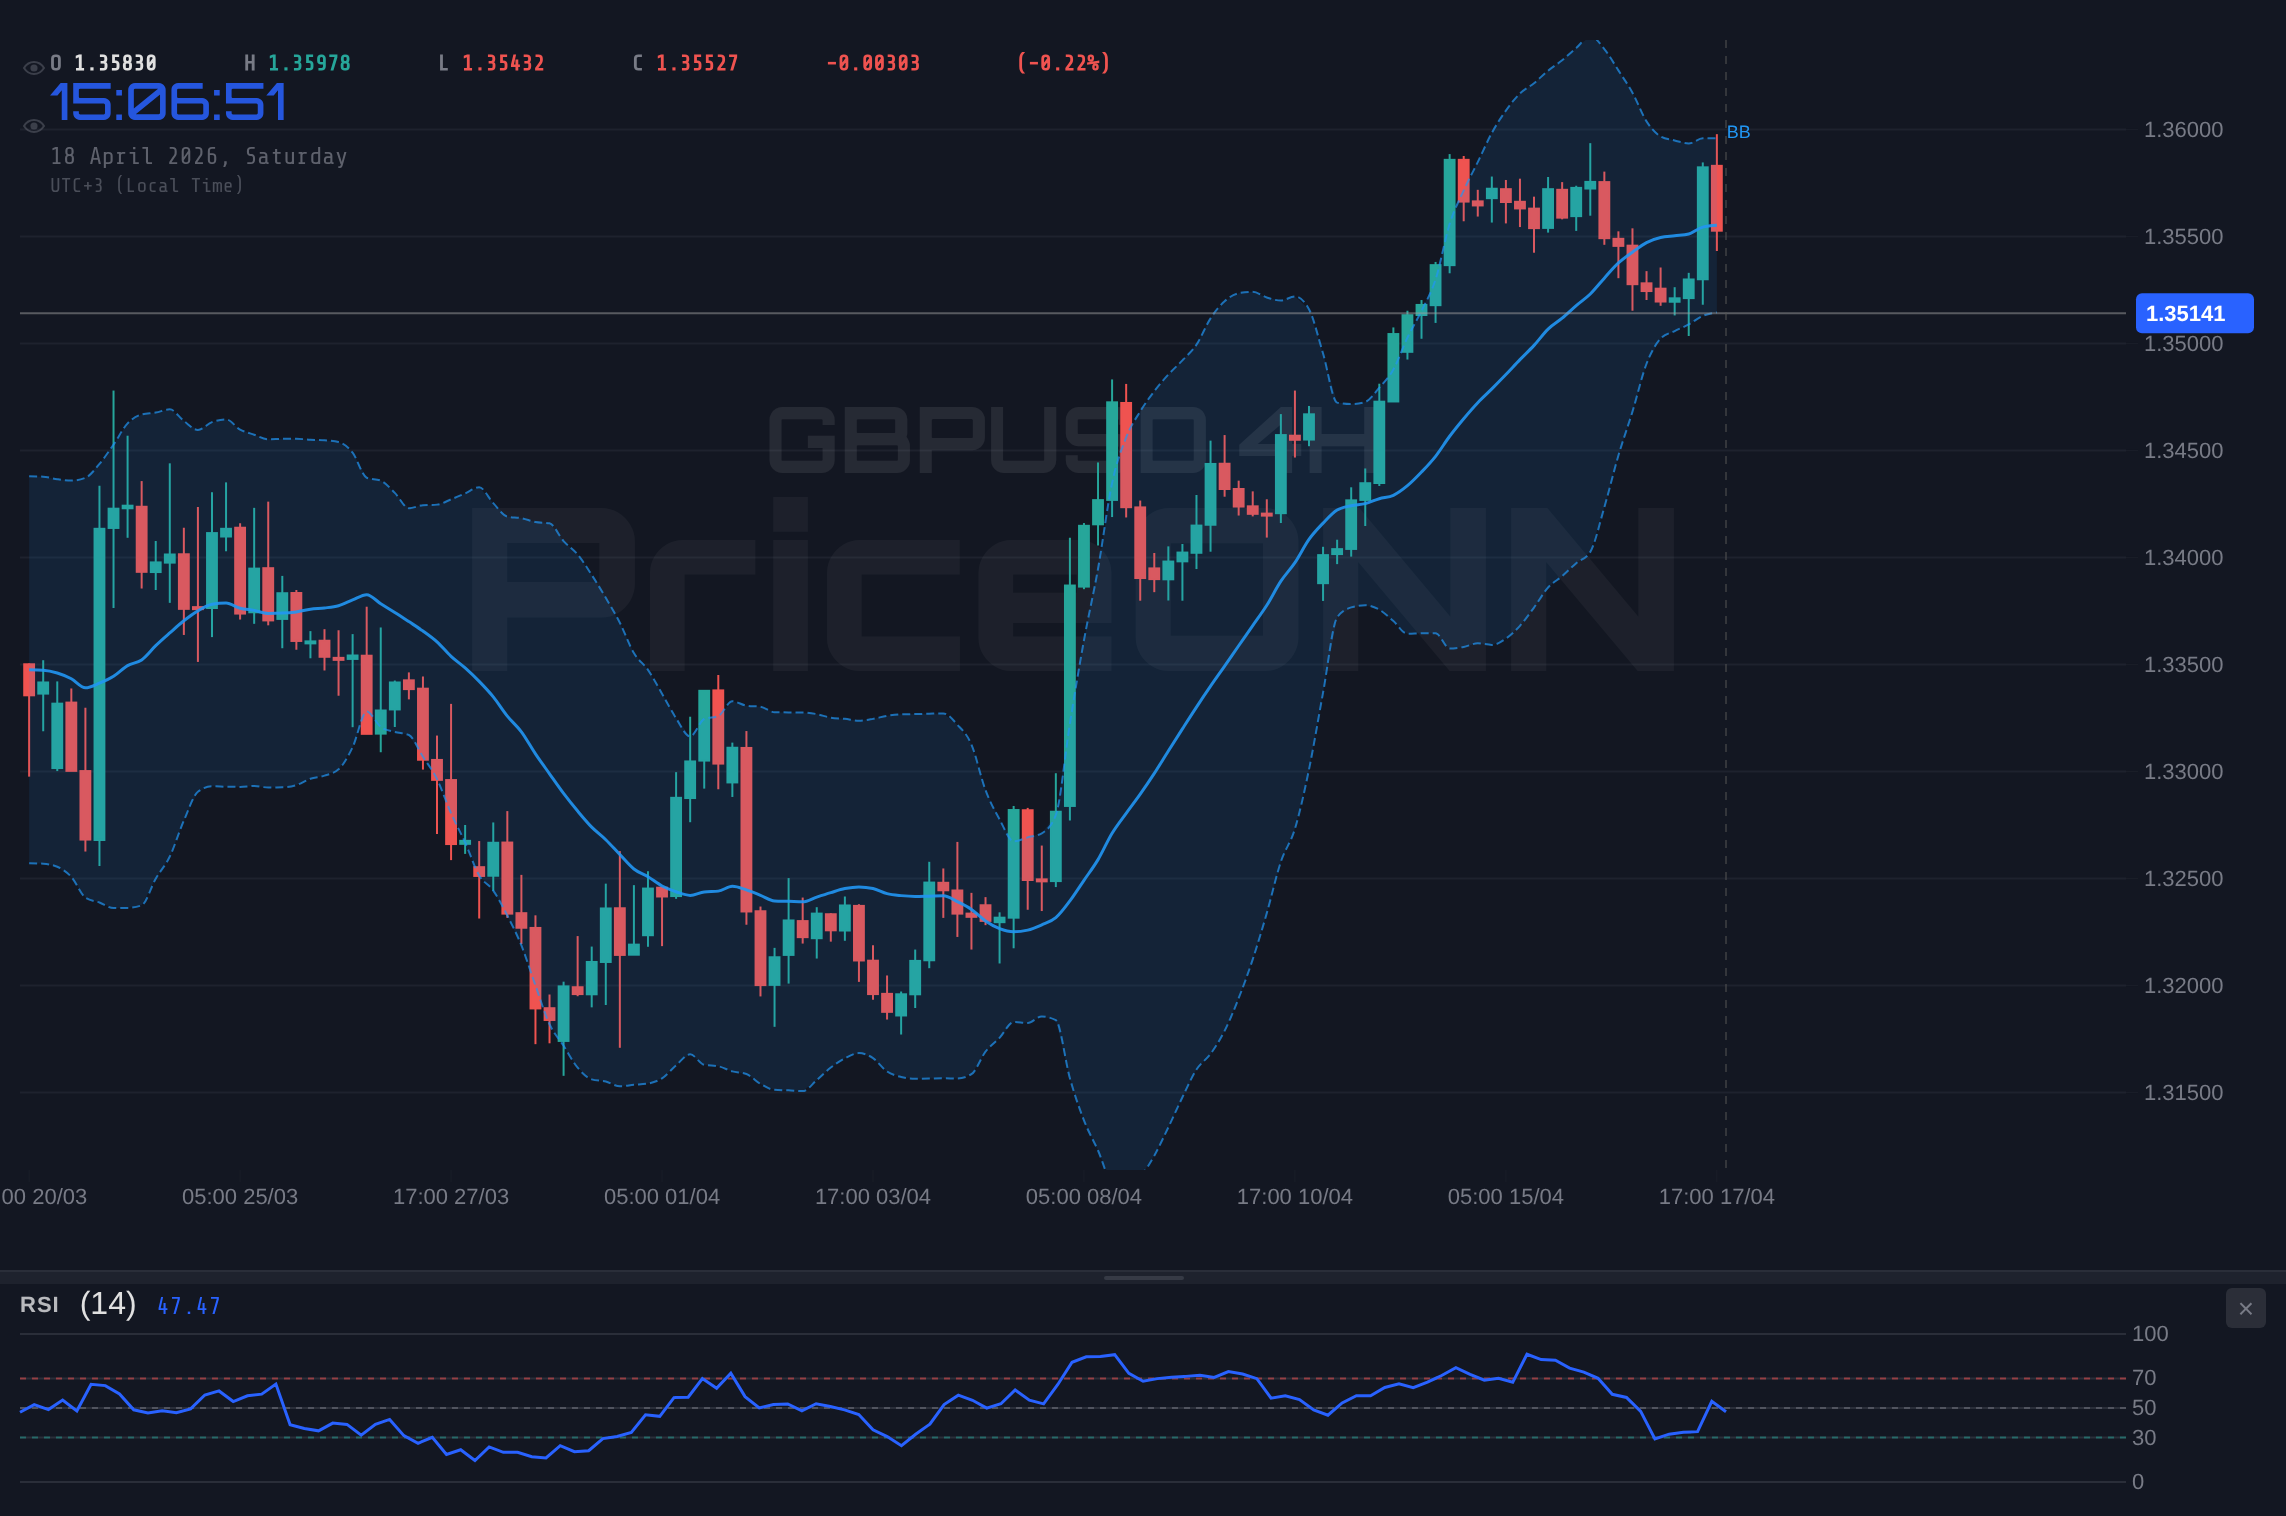
However, broadening the view to the 4-hour and daily charts reveals a more nuanced, and perhaps more significant, story. The 4-hour chart shows the RSI at 57, indicating a more neutral to slightly bullish leaning, and the Stochastic Oscillator (%K at 56.31, %D at 25.12) is showing a bullish signal with %K above %D. While the MACD on this timeframe remains negative, the Average Directional Index (ADX) across both the 1-hour and 4-hour charts presents a compelling narrative. The 1-hour ADX stands at 18.18, indicating a weak trend, but the 4-hour ADX jumps to a robust 34.77, signalling a strong trend is developing or already in place. This divergence in ADX readings across timeframes highlights a key market tension: is the short-term choppiness masking a stronger underlying directional move, or is the market simply consolidating before a potential trend reversal? The daily chart’s RSI at 58.46 and Stochastic Oscillator in the overbought zone (%K: 84.86, %D: 90.46) further complicate the picture, suggesting that while the longer-term trend may have some underlying strength, the immediate price action is showing signs of exhaustion or is poised for a pullback.
The Bull Case: Sterling's Resilience and Data Optimism
The bullish argument for GBPUSD rests on several pillars, primarily centered around the surprising resilience of the UK economy and the potential for positive surprises in upcoming US data. Last week's UK GDP figures, which showed a stronger-than-anticipated expansion, provided a significant boost to Sterling. The data indicated that the British economy is navigating inflationary pressures and geopolitical uncertainties more effectively than many analysts predicted. This economic robustness bolsters the case for the Bank of England potentially maintaining a more cautious approach to interest rate cuts compared to other major central banks, thus offering support to the Pound. The fact that GBPUSD managed to hold above key support levels despite broader market choppiness further attests to this underlying Sterling strength.
Furthermore, the bullish thesis is supported by the technical picture on longer timeframes. The daily chart, despite some overbought readings on the Stochastic Oscillator, shows the RSI at 58.46, comfortably within neutral territory and exhibiting an upward trend. The MACD is positive and above its signal line, suggesting that underlying bullish momentum is present on the daily timeframe. While the 1-hour chart shows bearish signals, the strength of the trend indicated by the 4-hour ADX (34.77) implies that this might be a temporary retracement rather than a reversal. If the upcoming US data, particularly Retail Sales and inflation figures, come in softer than expected, it could lead to a reassessment of the US Federal Reserve's monetary policy path. A Fed perceived as potentially pivoting towards easing sooner could weaken the US Dollar across the board, providing a direct tailwind for GBPUSD.
The historical correlation between Sterling and US economic data also plays a role. While a strong US economy often supports the Dollar, a scenario where US data significantly underperforms expectations could trigger a broad USD sell-off. In such an environment, pairs like GBPUSD, which have shown resilience, could be beneficiaries. The current positioning, with the pair consolidating near $1.35, could be seen as a launchpad for a move higher if the US economic narrative shifts. The bullish scenario hinges on the UK economy continuing its steady, albeit modest, growth and the US economy showing signs of faltering, prompting a re-pricing of Fed rate cut expectations. The bulls are looking for a decisive break above the immediate resistance at $1.3571, ideally supported by weaker US data, to target higher levels.
The Bear Case: US Dollar Strength and Inflationary Headwinds
Conversely, the bearish argument for GBPUSD is anchored by the potential for US economic data to remain resilient, thereby reinforcing the US Dollar and putting renewed pressure on Sterling. Despite the recent dip in oil prices, the narrative around inflation remains a significant concern. If the upcoming US Retail Sales and inflation figures, such as CPI, come in hotter than anticipated, it could solidify expectations for the Federal Reserve to maintain its hawkish stance for longer. This would likely translate into a stronger US Dollar, as higher interest rates make USD-denominated assets more attractive. The DXY, currently trading around 97.9, could find renewed strength, exerting downward pressure on GBPUSD.
Technically, the bearish case draws strength from the short-term indicators. The 1-hour RSI at 41.85 and the Stochastic Oscillator's bearish signal (%K
Moreover, concerns about the UK's own economic outlook cannot be entirely dismissed. While recent GDP data was positive, underlying inflationary pressures within the UK economy remain a challenge. A sticky inflation environment could force the Bank of England into a difficult balancing act, potentially hindering its ability to support Sterling through aggressive monetary policy. If US data surprises to the upside, it could reinforce the narrative of divergent economic performance, with the US economy showing more robust growth and inflation control compared to the UK. This would likely lead to a retest of the lower support levels, with a break below $1.3503 potentially opening the door to further declines. The bears are watching the $1.3503 support level closely; a decisive break here would invalidate the short-term bullish setup and confirm the bearish bias.
Technical Levels and Scenarios: Charting the Path Forward
The current technical setup for GBPUSD presents a fascinating interplay of conflicting signals across different timeframes, making precise forecasting challenging. However, by examining key support and resistance levels, alongside indicator readings, we can construct plausible scenarios for the coming week.
Bearish Scenario: Dollar Strength Dominates
55% ProbabilityNeutral Scenario: Range-Bound Consolidation Continues
30% ProbabilityBullish Scenario: US Data Disappoints
15% ProbabilityKey Levels to Watch
The immediate focus remains on the $1.3503 to $1.3571 range. A break below the lower bound ($1.3503) would be a significant bearish signal, potentially triggering a move towards the 4-hour support at $1.3472 and then the daily support at $1.3417. On the upside, a decisive close above $1.3571, particularly if fueled by weaker US data, could open the path towards the 4-hour resistance at $1.3605 and potentially higher daily resistance levels.
The daily Stochastic Oscillator, currently showing %K at 84.86 and %D at 90.46, is in overbought territory, suggesting that even if a bullish move occurs, it might face significant profit-taking pressure. This reinforces the idea that a sustained rally would require strong fundamental catalysts. The ADX reading of 34.77 on the 4-hour chart, however, is a strong signal of an existing trend. If this trend is indeed bullish, a break above resistance could be the start of a more significant upward move, while a break below support would confirm a bearish trend continuation. The conflict between the short-term bearish indicators and the longer-term trend strength suggested by the ADX is the core tension in the market right now.
The Importance of US Data: Retail Sales and Inflation
This week's economic calendar is heavily weighted towards US data, making it the primary driver for GBPUSD in the short term. The upcoming US Retail Sales report is crucial. A strong reading would suggest consumer resilience, potentially bolstering the case for the Federal Reserve to maintain its tight monetary policy. Conversely, a weak report could signal a slowdown in the world's largest economy, prompting markets to price in earlier or more aggressive Fed rate cuts, which would likely weaken the US Dollar. Given the current context, where oil prices have surged and gas prices have seen a significant increase of 26% according to recent reports, consumer spending patterns will be under intense scrutiny. The market will be looking for actual figures versus forecasts to gauge the true health of the US consumer.
Similarly, the US inflation data, likely CPI (Consumer Price Index), will be critical. Persistent inflation could force the Fed's hand, while signs of cooling price pressures might offer the central bank more flexibility. The market's reaction will depend heavily on how these figures align with or deviate from expectations. For instance, if US inflation comes in significantly above the forecast of 2.1% (as seen in the provided economic calendar data, though specific figures are sparse for this event), it could strengthen the USD. Conversely, a softer inflation print could lead to a reversal in the Dollar's fortunes. The interplay between these two data points will be crucial in determining whether the Federal Reserve leans more hawkish or dovish in its upcoming policy decisions, directly impacting the GBPUSD pair.
The recent surge in oil prices, mentioned in market news and impacting gasoline costs, adds another layer of complexity. Higher energy costs can fuel inflation but also dampen consumer spending. The market will be dissecting how these factors balance out in the upcoming US data. The Bank of England's own stance also comes into play. Recent UK GDP data showed a 0.5% increase, beating forecasts of 0.1%, and inflation data came in at 2.6%, slightly above the 2.5% forecast. While these figures suggest a resilient UK economy, they also present a challenge for the BoE in balancing inflation concerns with growth support. The market will be weighing the relative strength and inflation outlooks of the US and UK economies.
Correlation Analysis: DXY and Equities
The Dollar Index (DXY), currently trading around 97.9, remains a key barometer for GBPUSD's direction. A strengthening DXY typically exerts downward pressure on GBPUSD, as the US Dollar gains value against a basket of major currencies. Conversely, a weakening DXY can provide a tailwind for Sterling. Last week saw the DXY experiencing some fluctuations, reflecting the broader market uncertainty ahead of the US data. The 1-hour DXY shows a bullish signal with RSI at 56.83 and Stochastic giving a buy signal, while the 4-hour and daily charts show bearish trends with RSI below 50 and bearish ADX readings. This conflicting picture in the DXY mirrors the indecision seen in GBPUSD, suggesting that the dollar itself is at a critical juncture.
If the upcoming US data supports a 'higher for longer' Fed narrative, we could see the DXY resume its uptrend, potentially pushing GBPUSD lower. Support levels for the DXY are seen around 97.32 on the 4-hour chart, while resistance lies near 97.72. A break above this resistance could signal renewed Dollar strength. On the other hand, disappointing US data could see the DXY fall, potentially testing lower support levels and offering relief to GBPUSD. The correlation between GBPUSD and US equities, such as the S&P 500 (currently trading at 6572.87) and Nasdaq 100 (at 26682.75), also provides context. Both indices have shown strong upward momentum, indicating a generally positive risk appetite. However, the 1-hour RSI readings for both are in overbought territory (S&P 500 at 70.95, Nasdaq at 72.58), suggesting potential for a short-term pullback in equities. A significant risk-off move in equities, coupled with a strengthening DXY, would present a strong bearish case for GBPUSD.
Trading Strategies and Risk Management
Given the current market environment, characterized by conflicting technical signals and a heavy reliance on upcoming US data, a cautious approach to trading GBPUSD is warranted. The tight consolidation around $1.35 suggests that traders should look for clear directional signals before committing significant capital.
For those looking to enter a position, confirmation is paramount. A bullish trade might be considered on a confirmed break above $1.3571, especially if accompanied by weaker-than-expected US data and a falling DXY. In this scenario, targets could be set towards $1.3605 and then $1.3623. Stop-losses should be placed below the $1.3503 support level to invalidate the bullish thesis.
Conversely, a bearish trade could be initiated on a clear break and sustained close below $1.3503, particularly if US data comes in strong and the DXY strengthens. Initial targets would be the 4-hour support at $1.3472, followed by the daily support at $1.3417. Stop-losses would be placed above the $1.3571 resistance level. The neutral scenario involves range trading, looking for opportunities near the boundaries of $1.3503 and $1.3571, with tight stop-losses to manage risk in this choppy environment.
The ADX reading on the 4-hour chart at 34.77 signifies a strong trend, which suggests that once a direction is established, the move could be significant. However, the conflicting signals from other indicators, particularly on the shorter timeframes, mean that confirmation is crucial. Traders should pay close attention to volume during any potential breakouts, as high volume would lend more credibility to the move. The overall sentiment appears to be one of cautious anticipation, with the market waiting for a definitive catalyst to break the current deadlock.
Frequently Asked Questions: GBPUSD Analysis
What happens if GBPUSD breaks below the $1.3503 support level this week?
A sustained break below $1.3503 would invalidate short-term bullish hopes and likely trigger a move towards the 4-hour support at $1.3472. This scenario becomes more probable if US economic data surprises to the upside, strengthening the US Dollar and increasing bearish pressure on GBPUSD.
Should I consider a bullish trade if GBPUSD breaks above $1.3571, given the RSI is at 58.46?
A break above $1.3571, especially if driven by weaker-than-expected US data and a falling DXY, could offer a bullish opportunity. While the daily RSI at 58.46 is not yet overbought, the daily Stochastic Oscillator is showing bearish divergence, suggesting caution. A confirmed breakout with strong volume above $1.3571, targeting $1.3605, would be a more convincing bullish signal.
Is the ADX at 34.77 on the 4-hour chart a strong buy signal for GBPUSD?
An ADX reading of 34.77 indicates a strong trend, but it doesn't specify the direction. While it suggests that the market is likely to move decisively once a direction is established, it needs to be interpreted alongside other indicators. The conflicting signals from shorter timeframes mean that this strong trend reading should be treated with caution until other indicators align or provide confirmation.
How will upcoming US Retail Sales and Inflation data affect GBPUSD around the $1.35 level?
Stronger-than-expected US data could lead to a DXY rally and push GBPUSD below $1.3503, potentially targeting $1.3472. Conversely, weaker data might weaken the Dollar, supporting a move above $1.3571 for GBPUSD, with targets around $1.3605. The market's reaction will depend on the magnitude of the data's deviation from forecasts.
Track markets in real-time
AI-powered analysis, technical indicators and real-time price data.
Join Our Telegram Channel
Breaking market news, AI analysis and trading signals instantly.
Join Channel