

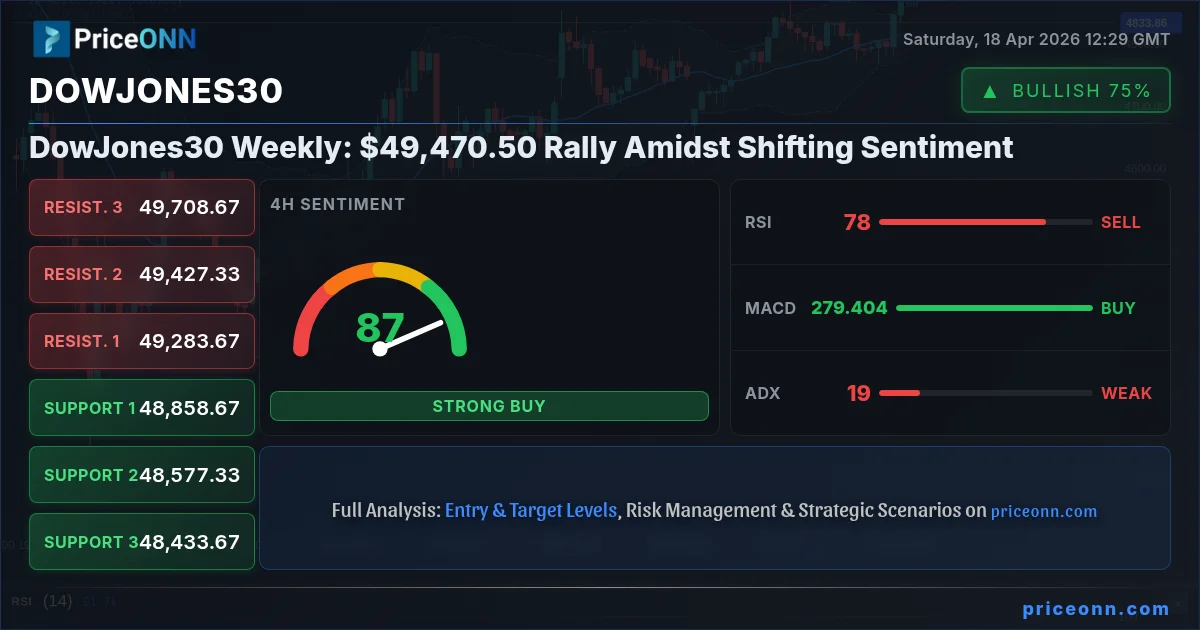
The Dow Jones Industrial Average concluded the trading week on a strong note, closing at $49,470.50 and marking a significant 1.74% gain, or 845.5 points, for the period. This upward momentum occurred within a volatile week, with the index navigating a range between 48,617 and 49,716. As we step into a new trading week, the question on many investors' minds is whether this rally is sustainable or if further choppiness lies ahead. Understanding the interplay of technical indicators, macroeconomic undercurrents, and evolving market sentiment will be crucial for navigating the upcoming sessions. This analysis delves into the technical landscape of the Dow Jones, correlated market movements, and anticipates key developments that could shape its trajectory.
- The Dow Jones closed at $49,470.50, with RSI at 69.49 on the daily chart signaling strong upward momentum but approaching overbought territory.
- Critical resistance is identified at $49,708.67, while key support lies at $48,413.33, levels that will be crucial for trend confirmation.
- The MACD histogram shows positive momentum, suggesting bulls are currently in control, but Stochastic levels in the overbought zone indicate potential for profit-taking.
- The correlation with the Dollar Index (DXY), currently at 97.9, and broader equity market sentiment will be key drivers influencing the Dow Jones's next move.
Navigating the Week: A Rally Fueled by Mixed Signals
The Technical Landscape of the Dow Jones
The past week saw the Dow Jones Industrial Average demonstrate robust resilience, culminating in a solid weekly gain. This advance, however, was not without its internal contradictions, as evidenced by the technical indicators. On the 1-day timeframe, the index closed at $49,470.50, with the Relative Strength Index (RSI) standing at 69.49. This level, while indicating a strong bullish trend, hovers near the threshold that often precedes a market pullback or consolidation phase. Traders are closely watching this zone, as a sustained move above 70 on the RSI can sometimes signal an overheated market, ripe for profit-taking. The Moving Average Convergence Divergence (MACD) histogram, however, presented a more bullish picture, showing positive momentum with the MACD line above its signal line. This suggests that the underlying buying pressure is still present. The Stochastic Oscillator, meanwhile, is flashing a caution signal. With %K at 94.13 and %D at 94.66, both are deep in overbought territory, and the %K line is just beginning to dip below the %D line. This divergence often precedes a short-term reversal or at least a pause in the rally.
The ADX, a measure of trend strength, is at 24.92 on the daily chart. This indicates a moderately strong trend, supporting the idea that the current move has some legs, but it's not an overwhelmingly strong trend that would preclude pullbacks. The Bollinger Bands on the daily chart show the price trading above the middle band, aligning with the bullish sentiment, but the upper band is being tested, suggesting potential resistance. On the 4-hour timeframe, the picture is slightly more nuanced. The ADX at 18.84 suggests a weaker trend compared to the daily, hinting at potential choppiness or a less committed market direction in the shorter term. Yet, the 4-hour RSI at 78.1 is even more firmly in overbought territory, raising the stakes for a correction. The Stochastic readings here are also extremely high, with %K at 93.69 and %D at 85.77, reinforcing the overbought condition. The Dow Jones's ability to maintain its upward trajectory will likely depend on its capacity to digest these mixed signals, particularly the divergence between the MACD's positive momentum and the Stochastic's overbought warning.
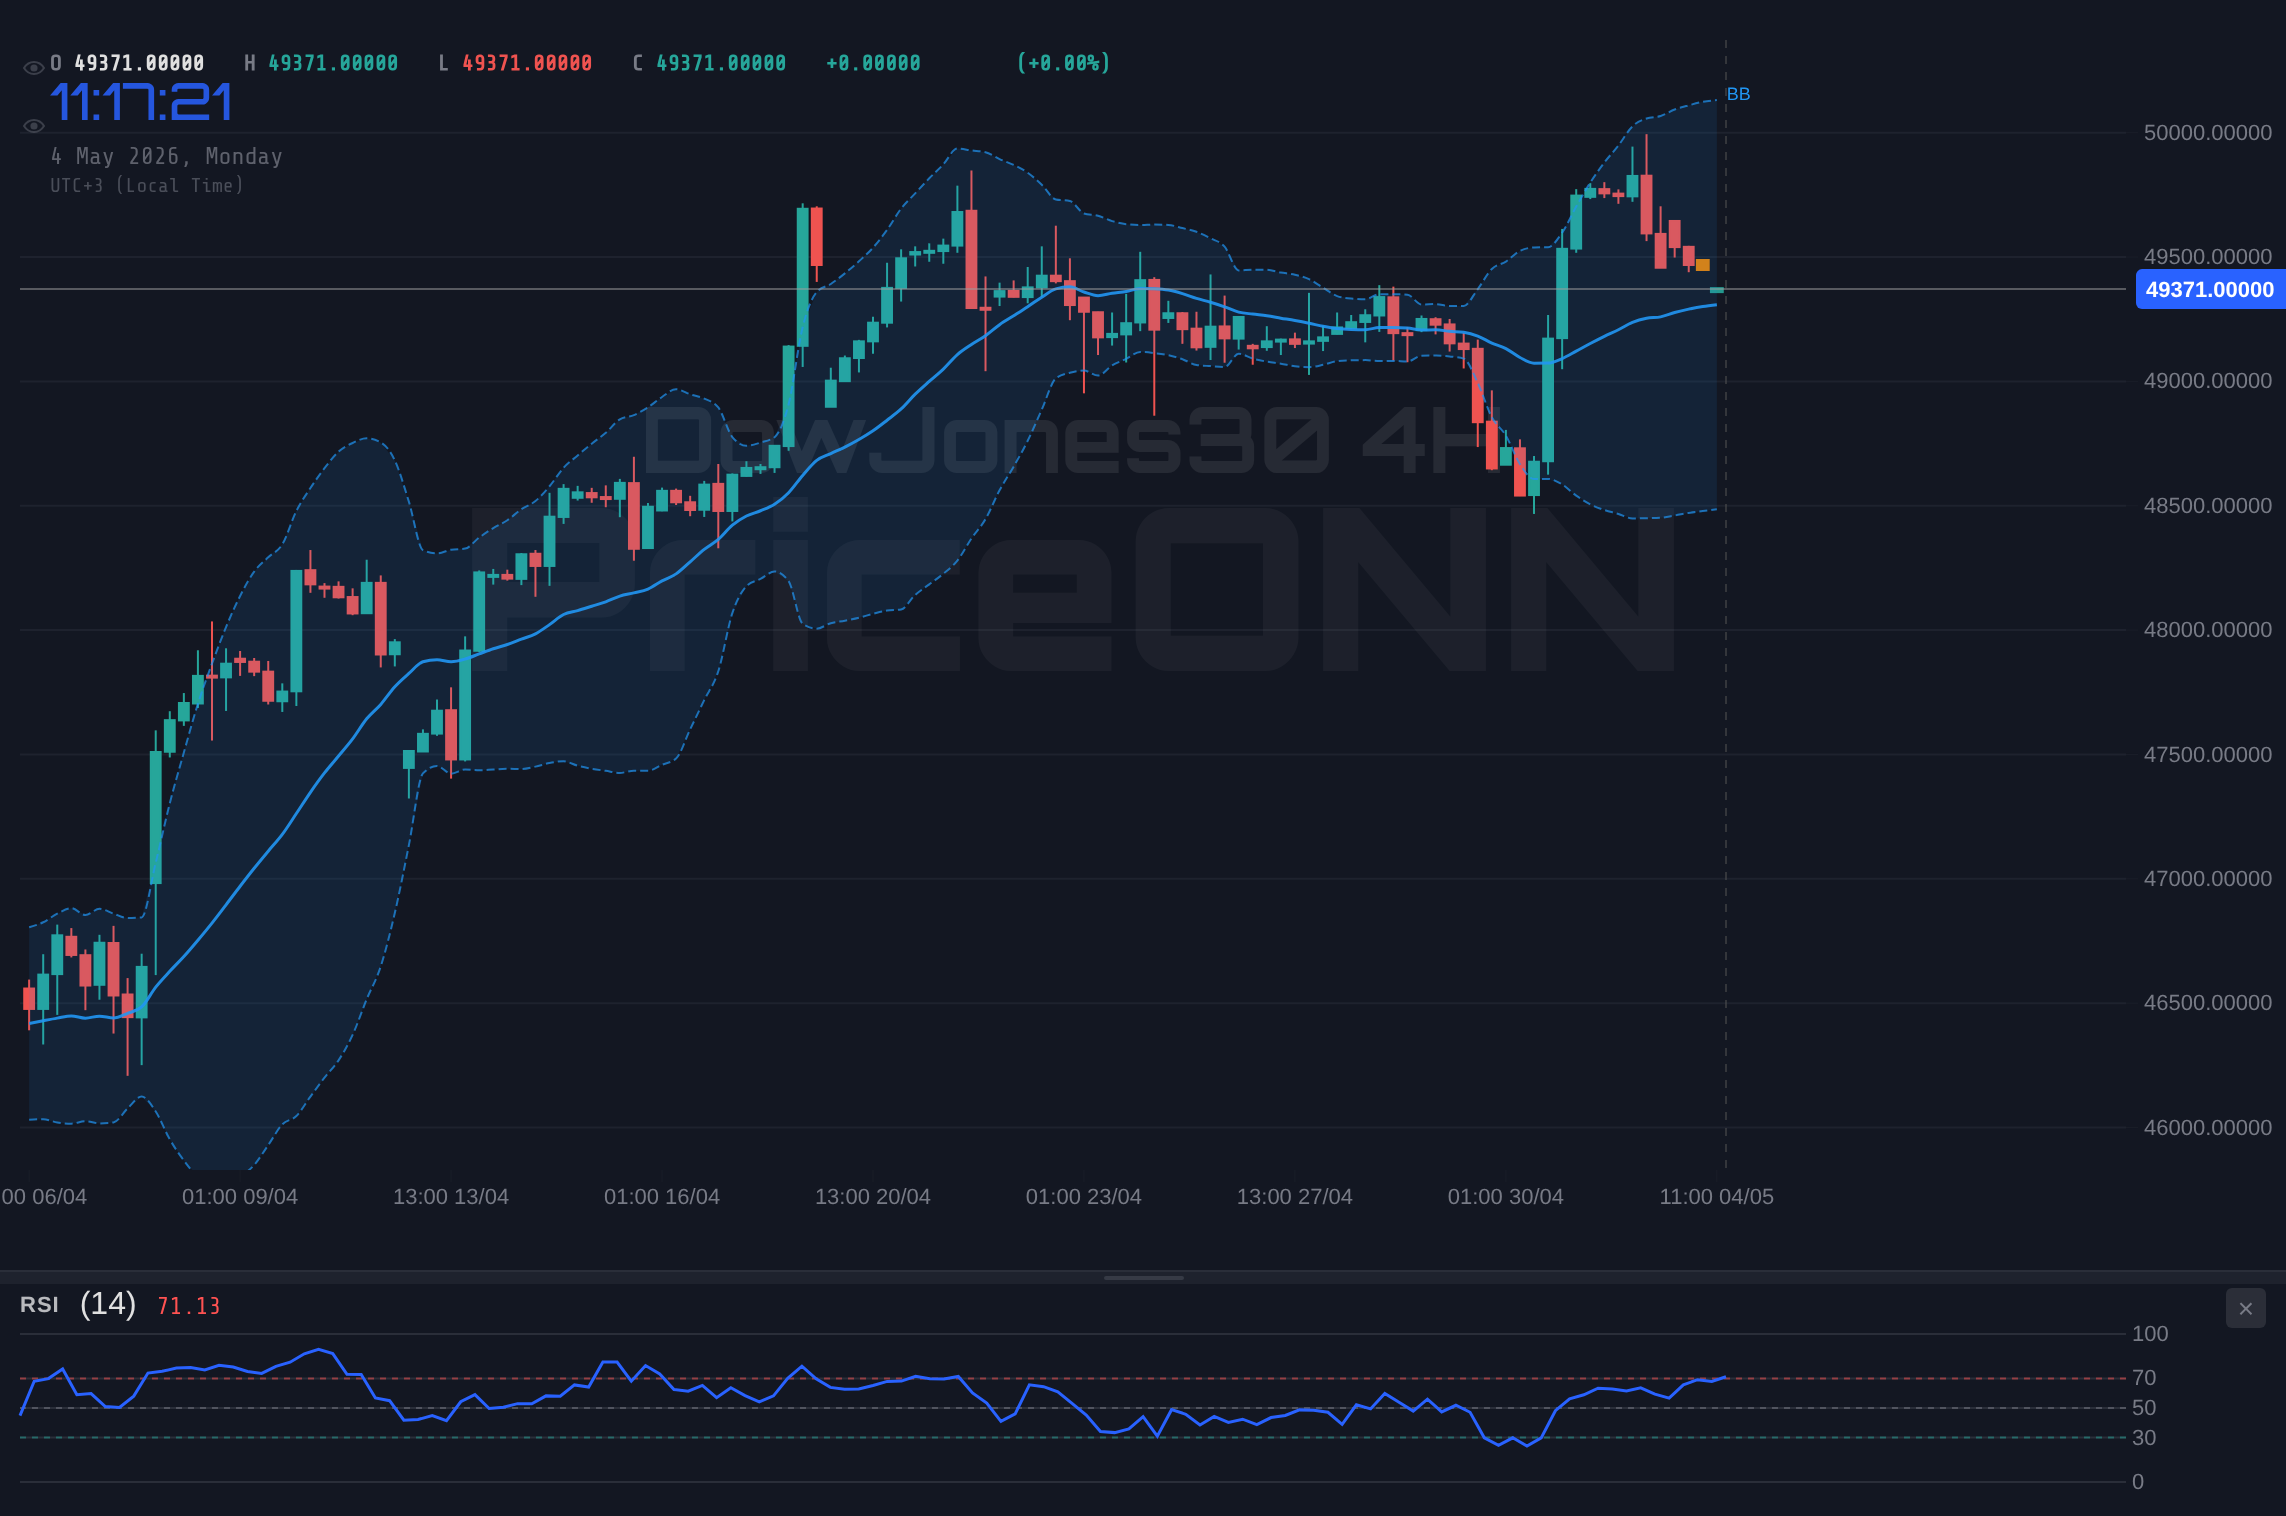
Key Levels: The Battleground for the Dow Jones
The price action over the past week has clearly defined critical levels that will likely dictate the Dow Jones's path in the coming days. On the upside, resistance is firmly established around the $49,708.67 mark, which represents the R2 level derived from the provided data. A decisive breach and sustained hold above this level could open the door for further upside, potentially targeting the R3 resistance at $49,091.33. However, the current overbought conditions on shorter timeframes suggest that reaching these higher levels might require a brief consolidation or pullback first. The $49,716 high reached during the week is a significant psychological and technical barrier that bulls will need to conquer to maintain momentum.
Conversely, support levels are of paramount importance for assessing the downside risk. The first significant support level is identified at $48,413.33 (S1), followed by $48,201.67 (S2) and $48,074.33 (S3). A break below the $48,413.33 level would be a strong bearish signal, potentially triggering a more aggressive sell-off as traders reassess the market's strength. Given the divergence in shorter-term indicators, a test of these support levels cannot be ruled out, especially if broader market sentiment shifts or if upcoming economic data proves disappointing. The $48,617 low observed this week serves as an immediate psychological support zone. The interplay between these resistance and support levels will form the core of the Dow Jones's trading range and directional bias in the near term. The market's reaction to these levels will tell us whether the bulls are strong enough to push higher or if the bears are poised to reclaim control.
Intermarket Dynamics: DXY, Equities, and Commodities
Understanding the Dow Jones's movements requires a broader view of the financial ecosystem. The Dollar Index (DXY), currently trading around 97.9, plays a crucial role. Historically, a strengthening dollar often correlates with pressure on US equity indices like the Dow Jones, as it can make US exports more expensive and signal tighter global liquidity. However, this relationship isn't always linear. This past week, the DXY saw a slight dip to 97.33 before recovering to 97.9, while the Dow Jones rallied. This suggests that other factors, such as strong domestic earnings or a perceived flight to quality within the US market itself, might be temporarily overriding the typical inverse correlation. The DXY's daily trend is showing a strong downward momentum with ADX at 37.19, and it sits below its mid-Bollinger band, indicating bearish pressure on the dollar. A sustained fall in the DXY could, in theory, provide a tailwind for the Dow Jones, especially if it signals a broader risk-on sentiment in global markets.
The performance of other major US equity indices, such as the S&P 500 and Nasdaq 100, also provides vital context. The S&P 500 closed at 6572.87 with a 0.74% gain, while the Nasdaq 100 surged by 1.45% to 26682.75. Both indices show strong upward momentum on their hourly and daily charts, with the Nasdaq exhibiting particularly aggressive gains and reaching overbought conditions on multiple timeframes (RSI at 72.58 on 1H, 86.86 on 4H). This broad strength across US equities suggests a general risk-on appetite, which is generally supportive of the Dow Jones. However, the pronounced overbought signals on the Nasdaq, particularly the RSI nearing 87 on the 4-hour chart, raise concerns about the sustainability of this rally. A significant pullback in these major indices could easily drag the Dow Jones lower. Meanwhile, oil prices, specifically Brent crude at $92.54 and WTI at $86.42, have experienced sharp declines this week, shedding nearly 7%. This drop in oil prices, despite recent geopolitical tensions around the Strait of Hormuz, might be interpreted as a sign of cooling inflation expectations or concerns about global demand. While lower energy costs can be a boon for corporate profits and consumer spending, a sharp, rapid decline can also signal underlying economic weakness, potentially tempering bullish sentiment in equities.
The Macroeconomic Backdrop: Inflation, Rates, and Consumer Health
The macroeconomic environment continues to be a significant, albeit complex, driver for market direction. Inflation remains a central theme, with recent economic data releases offering a mixed bag of signals. The US saw a Personal Consumption Expenditures (PCE) price index reading of -0.913%, a figure that came in significantly below the forecast of 2.1% and the previous reading of 3.081%. This sharp deceleration in inflation, if sustained, could influence Federal Reserve policy. The market is constantly recalibrating its expectations for interest rate cuts, and such a print might fuel hopes for earlier or more aggressive easing. However, it's crucial to note that this PCE figure is just one data point, and other inflation metrics need to be watched closely. The EUR/USD pair, for instance, saw its daily RSI at 60.87 and MACD showing positive momentum, suggesting a potential bullish bias for the Euro, perhaps reacting to disinflationary signals in the US that could lead to a less hawkish Fed stance. Conversely, the GBP/USD also shows a daily RSI of 58.46 and positive MACD momentum, indicating some underlying strength despite recent price action.
Consumer health is another critical factor. US Retail Sales data is on the horizon, with expectations for March suggesting a reading of 26.7, a significant jump from the previous 18.1, but lower than the forecast of 10.3. This data point will offer crucial insight into consumer spending resilience amidst rising gasoline prices. Recent reports indicated a 26% surge in gasoline prices, which could either boost retail sales through higher nominal spending or dampen it by eroding purchasing power. The Canadian dollar has also been in focus, with inflation projected to surge to 2.5% in March due to a 21% jump in gasoline prices. This highlights the inflationary pressures that consumers globally are facing. For the Dow Jones, strong consumer spending is generally a positive, as it underpins corporate revenues and profits. However, if the surge in prices leads to a significant contraction in real consumer spending, it could signal broader economic headwinds. The market's interpretation of this data – whether it sees it as a sign of robust demand or inflationary pressure that necessitates tighter monetary policy – will significantly impact risk appetite and, consequently, the Dow Jones's performance.
Trade Scenarios: Mapping the Path Forward
Given the mixed technical signals and the evolving macroeconomic landscape, several scenarios could play out for the Dow Jones Industrial Average in the coming week. The current price of $49,470.50 sits at a critical juncture, with strong bullish momentum battling overbought conditions and key resistance levels looming.
Bearish Scenario: Profit-Taking and Consolidation
65% ProbabilityNeutral Scenario: Range-Bound Trading
25% ProbabilityBullish Scenario: Momentum Continues
10% ProbabilityThe Risk Management Imperative
In the current market environment, characterized by mixed technical signals and a sensitive macroeconomic backdrop, disciplined risk management is not merely advisable - it's essential. The Dow Jones's proximity to key resistance levels, coupled with overbought indicators on shorter timeframes, presents a scenario where a sharp reversal is a distinct possibility. For traders operating on shorter timeframes, the failure to hold above the $49,413.33 support level could signal an opportune moment to reduce exposure or even initiate short positions, targeting the subsequent support levels. A close below $49,413.33, especially on increasing volume, would invalidate the current bullish thesis and suggest a potential move towards the $48,000-$48,500 range.
Conversely, a decisive breakout above the $49,708.67 resistance, confirmed by strong volume and a bullish divergence in indicators like the MACD on the daily chart, could signal the continuation of the uptrend. In such a scenario, traders might look for pullbacks towards the breakout level as potential entry points, targeting higher resistance levels. For longer-term investors, the current levels present a challenging risk-reward profile. While the trend has been upward, the overbought conditions and the proximity to resistance suggest that adding significant long positions at these prices might be premature. Patience could be a virtue, waiting for a clearer directional signal or a more favorable entry point, perhaps closer to the support levels. Managing leverage, employing stop-losses judiciously, and diversifying positions remain critical strategies to mitigate potential downside risks in this uncertain market.
The Week Ahead: Key Events and Levels to Monitor
Economic Calendar Watchlist
The upcoming week will feature several high-impact economic events that could significantly influence the Dow Jones Industrial Average. Following the recent data releases, investors will be scrutinizing upcoming figures for further clues on inflation, consumer behavior, and potential Federal Reserve policy adjustments. While specific dates for some US data points were not provided in the market context, the general economic calendar suggests key releases related to the US dollar will be closely watched. The recent PCE price index came in significantly below expectations at -0.913%, a development that could bolster dovish sentiment towards the Federal Reserve. If subsequent inflation data continues to show a cooling trend, it might increase the probability of earlier interest rate cuts, which is generally supportive of equity markets.
Consumer spending data, such as the upcoming US Retail Sales figures, will be critical. The market is anticipating a strong rebound, partly driven by a surge in gasoline prices. How consumers respond to these higher costs will offer vital insights into the underlying health of the US economy. A robust retail sales report could bolster confidence in economic growth and support the Dow Jones's upward trajectory. Conversely, a weaker-than-expected report might raise concerns about consumer resilience and economic slowdown, potentially leading to a risk-off sentiment. Furthermore, any commentary from Federal Reserve officials regarding inflation and interest rate policy will be closely monitored. Shifts in hawkish or dovish rhetoric could trigger significant market movements, impacting the DXY and, by extension, the Dow Jones. The market's reaction to these upcoming data points will be key in determining whether the current rally has the fundamental backing to continue or if it's susceptible to a correction.
Price Action: Levels to Define the Trend
From a technical perspective, the levels highlighted earlier remain the primary focus for the upcoming trading week. The $49,708.67 resistance level is the immediate hurdle for the bulls. A confirmed breakout above this point, ideally on increased volume and with supportive technical indicators, would be a strong bullish signal, potentially setting the stage for a move towards $50,000. This would imply that the market is shrugging off the overbought conditions and continuing its upward march. On the other hand, the support at $49,413.33 is the critical line in the sand. A decisive break below this level, particularly if accompanied by rising DXY or negative news flow, would likely trigger a cascade of selling, potentially pushing the index towards the $48,000-$48,500 zone. The $48,617 weekly low is also an important psychological level to watch for immediate downside reaction.
The interplay between these levels and the broader market sentiment will be crucial. If risk appetite remains high, and other equity indices like the Nasdaq continue their ascent, the Dow Jones may find the strength to push through resistance. However, if the DXY strengthens significantly, or if inflation concerns resurface, the index could face headwinds. The ADX on the daily chart at 24.92 suggests that the trend has moderate strength, but a move above 25-30 would indicate a stronger prevailing trend, either up or down, depending on price action. Traders will be looking for confirmation through volume and sustained price action at these key levels before committing to significant positions. The weekend's analysis suggests that while the path of least resistance has been upwards recently, the confluence of overbought signals and key resistance levels warrants caution and a keen eye on risk management.
Historical Context and Market Sentiment
Looking back at historical patterns, periods of strong upward momentum often face resistance when key indicators enter overbought territory, especially when accompanied by significant macroeconomic uncertainties. The Dow Jones's current rally, while impressive, mirrors past instances where sharp gains were followed by consolidations or corrections as the market digested new information or faced profit-taking. The fact that the Nasdaq 100 is showing even more extreme overbought conditions (RSI at 86.86 on 4H) could be a leading indicator for the broader market, suggesting that a broader market pullback might be on the horizon. Historically, when tech-heavy indices like the Nasdaq show such extreme readings, other indices like the Dow Jones often follow suit in a correction, albeit sometimes with a slight lag.
Market sentiment, as gauged by the interplay of risk-on/risk-off assets, also provides valuable context. The sharp decline in oil prices, despite geopolitical tensions, could be interpreted in multiple ways. If it reflects easing demand fears, it's positive for inflation and potentially for equities. However, if it signals a broader economic slowdown, it could dampen risk appetite. The current correlation analysis shows the DXY at 97.9, and while it dipped earlier in the week, its recovery to this level needs monitoring. A resurgent dollar could put pressure on the Dow Jones. The strength in other forex pairs like EUR/USD and GBP/USD, despite the DXY's current position, suggests a complex global monetary policy outlook. The prevailing sentiment appears cautiously optimistic, but the underlying vulnerabilities, highlighted by overbought technicals and the mixed economic signals, suggest that this optimism could be fragile. Therefore, maintaining a balanced approach, acknowledging both the bullish momentum and the potential for a reversal, is paramount.
The Role of Central Banks and Policy Expectations
Central bank policy expectations continue to be a dominant force shaping market narratives. The recent inflation data, particularly the lower-than-expected PCE reading, has fueled speculation about the Federal Reserve's stance on interest rates. While the Fed has maintained a data-dependent approach, a consistent trend of disinflation could indeed pave the way for potential rate cuts sooner rather than later. Market participants are closely watching Fed Fund Futures and OIS rates for pricing in these expectations. If market pricing starts to strongly favor earlier cuts, it could provide further support for equities by reducing borrowing costs and increasing corporate valuations. However, the Fed has also emphasized its commitment to bringing inflation fully under control, suggesting a cautious approach.
The communication from Fed officials in the coming week will be critical. Any hints of a more hawkish tone, emphasizing the need to keep rates higher for longer to ensure inflation is truly vanquished, could quickly shift market sentiment and put pressure on the Dow Jones. Conversely, any suggestion of a pivot towards easing, perhaps driven by concerns about economic growth or financial stability, would likely be bullish for equities. The current ADX reading of 24.92 on the daily chart suggests a trending market, but the direction of that trend will heavily depend on how these monetary policy expectations evolve. A dovish surprise from the Fed could solidify the bullish trend, while a hawkish stance might lead to a retest of support levels. The interplay between inflation data, labor market strength, and Fed commentary will be the key determinant of the monetary policy narrative and, consequently, its impact on the Dow Jones.
Navigating Uncertainty: A Trader's Perspective
The Importance of Active Risk Management
In a market environment like this, where strong upward momentum clashes with overbought technical conditions and evolving macroeconomic narratives, active risk management becomes the cornerstone of any successful trading strategy. The Dow Jones, currently trading around $49,470.50, faces critical resistance at $49,708.67. A failure to decisively break this level, especially with the daily RSI at 69.49 and daily Stochastic well into overbought territory, increases the probability of a pullback. For short-term traders, this presents a clear signal to tighten stop-losses on existing long positions or to consider taking partial profits. The immediate support at $49,413.33 is crucial; a break below it could signal a more significant correction, potentially targeting $48,413.33 and beyond. This is where risk management is key: setting stops below these support levels can protect capital from larger downturns.
For those looking to enter new positions, the current price levels may not offer the most attractive risk-reward ratio. The potential for a short-term reversal or consolidation means that waiting for a clearer signal might be prudent. This could involve waiting for a pullback to a more significant support level, such as $48,413.33, or waiting for confirmation of a breakout above resistance, ideally with increasing volume and supportive technical indicators. The ADX at 24.92 suggests a trend is present but not overwhelmingly strong, meaning that range-bound trading or choppy price action is a distinct possibility. Therefore, employing strategies that account for this, such as setting wider stops or focusing on shorter-term setups, could be beneficial. Patience and discipline are paramount; the market always provides another opportunity, and it's often better to wait for a high-probability setup than to chase a move that might be on the verge of reversing.
What to Watch Next Week
Looking ahead, several factors will be critical in shaping the Dow Jones's trajectory. Firstly, the upcoming economic data releases, particularly US Retail Sales and any further inflation indicators, will be closely scrutinized for their impact on Federal Reserve policy expectations. A continued trend of cooling inflation could support the bullish case for equities, while persistent price pressures might dampen sentiment. Secondly, the price action around the key resistance at $49,708.67 and support at $49,413.33 will be paramount. A decisive break in either direction, confirmed by volume and other technical indicators, will likely define the short-to-medium term trend. The correlation with the DXY and other equity indices like the S&P 500 and Nasdaq 100 will also provide valuable context.
Finally, commentary from Federal Reserve officials will be closely watched for any shifts in tone regarding monetary policy. A more dovish outlook could fuel further gains, while hawkish remarks might trigger a correction. The market sentiment, influenced by geopolitical developments and the ongoing debate about economic growth versus inflation, will also play a significant role. Given the mixed signals - bullish momentum on MACD but overbought conditions on Stochastic and RSI approaching cautionary levels - a period of consolidation or a moderate pullback seems plausible, especially if key resistance levels hold. However, a strong bullish catalyst, such as dovish Fed signals or exceptionally strong economic data, could propel the index higher. Staying agile, managing risk diligently, and adapting to the evolving market conditions will be the keys to navigating the week ahead successfully.
Frequently Asked Questions: DowJones30 Analysis
What happens if the Dow Jones breaks above the $49,708.67 resistance level?
A sustained close above the $49,708.67 resistance level on the Dow Jones, especially with strong volume, would likely invalidate the current overbought signals and confirm a continuation of the bullish trend. This could open the door for further upside, potentially targeting the R3 resistance at $49,091.33 or even psychological levels around $50,000, provided the Fed maintains a accommodative stance.
Should I consider buying the Dow Jones at current levels of $49,470.50 given the RSI is at 69.49?
Buying at current levels of $49,470.50 warrants caution, as the daily RSI at 69.49 approaches overbought territory, and Stochastic is deep in overbought zones. While momentum is positive, the risk-reward for new long positions may not be optimal. Waiting for a pullback towards support around $49,413.33 or confirmation of a breakout above $49,708.67 could offer a more favorable entry point with better risk management.
Is the MACD's positive momentum a reliable buy signal for the Dow Jones at $49,470.50?
The MACD showing positive momentum on the daily chart for the Dow Jones at $49,470.50 is a bullish indicator, suggesting underlying buying pressure. However, it should not be acted upon in isolation. The conflicting signals from the Stochastic and the approaching overbought RSI levels suggest that this bullish momentum might be nearing a short-term peak, making confirmation from other indicators and price action crucial before considering a buy signal.
How will upcoming US Retail Sales data affect the Dow Jones this week?
Upcoming US Retail Sales data will be a key catalyst for the Dow Jones. A strong report, exceeding expectations and indicating robust consumer spending despite rising gasoline prices, could boost confidence in economic growth and support a further rally, potentially pushing the index towards resistance levels. Conversely, a weaker report might raise concerns about economic slowdown, triggering a risk-off sentiment and potentially leading to a pullback towards support levels around $49,413.33.
The Path Forward: Disciplined Approach in Choppy Waters
The Dow Jones Industrial Average has navigated a complex week, closing at $49,470.50 with a notable gain. However, the mixed signals from technical indicators and the evolving macroeconomic landscape underscore the need for a disciplined and risk-aware approach. While bullish momentum is evident, the overbought conditions and key resistance levels present significant hurdles. The market is at a crossroads, and the decisions made by central banks, the resilience of consumer spending, and geopolitical stability will be critical in determining the next decisive move. For investors and traders, patience, rigorous risk management, and a keen eye on the defined support and resistance levels will be paramount in navigating the potential volatility ahead. The market always provides opportunities for those who are prepared and disciplined.
Track markets in real-time
AI-powered analysis, technical indicators and real-time price data.
Join Our Telegram Channel
Breaking market news, AI analysis and trading signals instantly.
Join Channel