
Nasdaq100 Dips to $24,809.88: Fed Speakers and Oil Price Concerns?
The Nasdaq100 is currently trading at $24,809.88, facing headwinds from hawkish Fed commentary and surging crude oil prices. Will support hold?
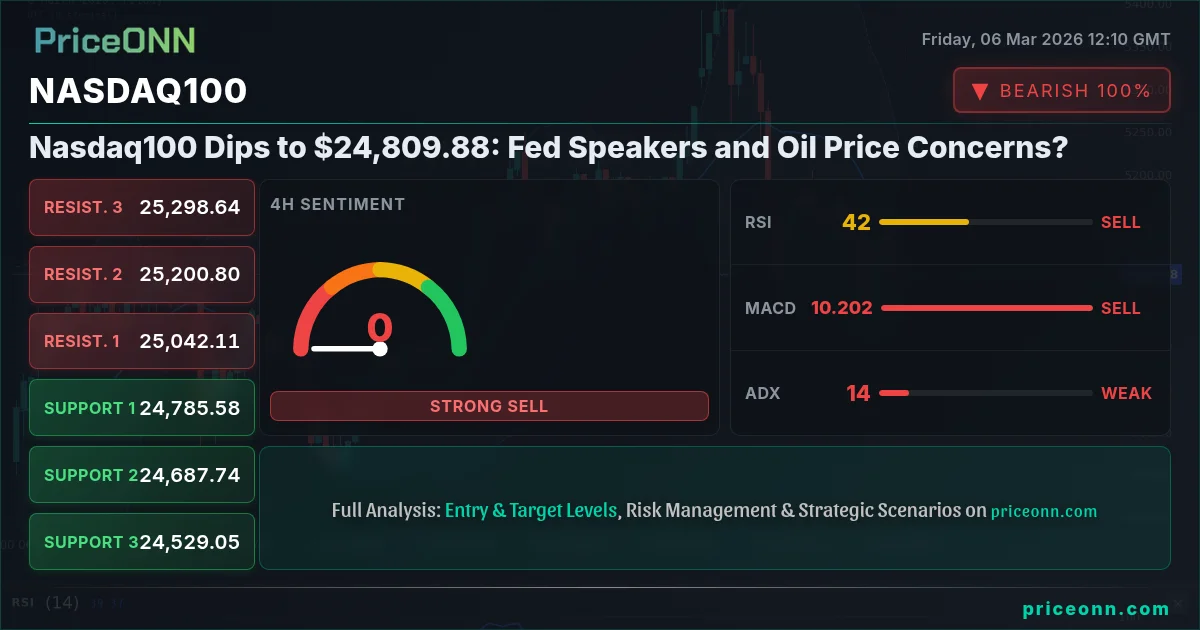
As I watch the Nasdaq100 trading today, one thing is clear: the bulls are facing a stiff test. The index has dipped to $24,809.88, and the question now is whether this is a temporary pullback or the start of something more significant. We're seeing a confluence of factors weighing on the market, including hawkish commentary from Fed speakers and a concerning surge in crude oil prices.
- RSI at 37.91 signals further downside momentum on the 1H timeframe.
- Key support level at $24,734.19 must hold to prevent a deeper correction.
- The ADX at 26.33 on the daily chart indicates a strong downtrend is developing.
- Fed rate expectations and rising energy costs are driving Nasdaq100 correlation with DXY.
The Nasdaq100 today analysis reveals a market at a crossroads. The initial knee-jerk reaction to the Fed speakers hinting at a less dovish stance was a sell-off in risk assets. This is classic playbook stuff. Higher rates are kryptonite for growth stocks, especially those richly valued tech names that dominate the Nasdaq100. But the real kicker has been the sudden spike in oil prices. WTI crude is trading at $86.56, and Brent is at $65.73. This is not just a blip; it's a potential inflationary accelerant that could force the Fed's hand, making rate cuts even less likely. For swing traders, it's a signal to re-evaluate long positions and tighten stops. Scalpers will likely be playing the short side, targeting quick gains on intraday bounces that fail to hold.
Analyzing Nasdaq100's Price Action: Key Levels in Focus
From a technical perspective, the Nasdaq100 is currently testing a critical support zone. The $24,734.19 level is the immediate line in the sand. A break below this could open the door to a test of $24,500.22, a level that has acted as support in the past. Failure to hold $24,500.22 could trigger a more significant correction towards $24,266.61. On the upside, immediate resistance lies at $25,201.77. Clearing this level would signal a resumption of the uptrend, but the market needs a clear catalyst to overcome the current headwinds. Long-term investors should be watching for buying opportunities at these lower levels, but patience is key. The market needs to stabilize and show signs of bottoming before committing new capital.
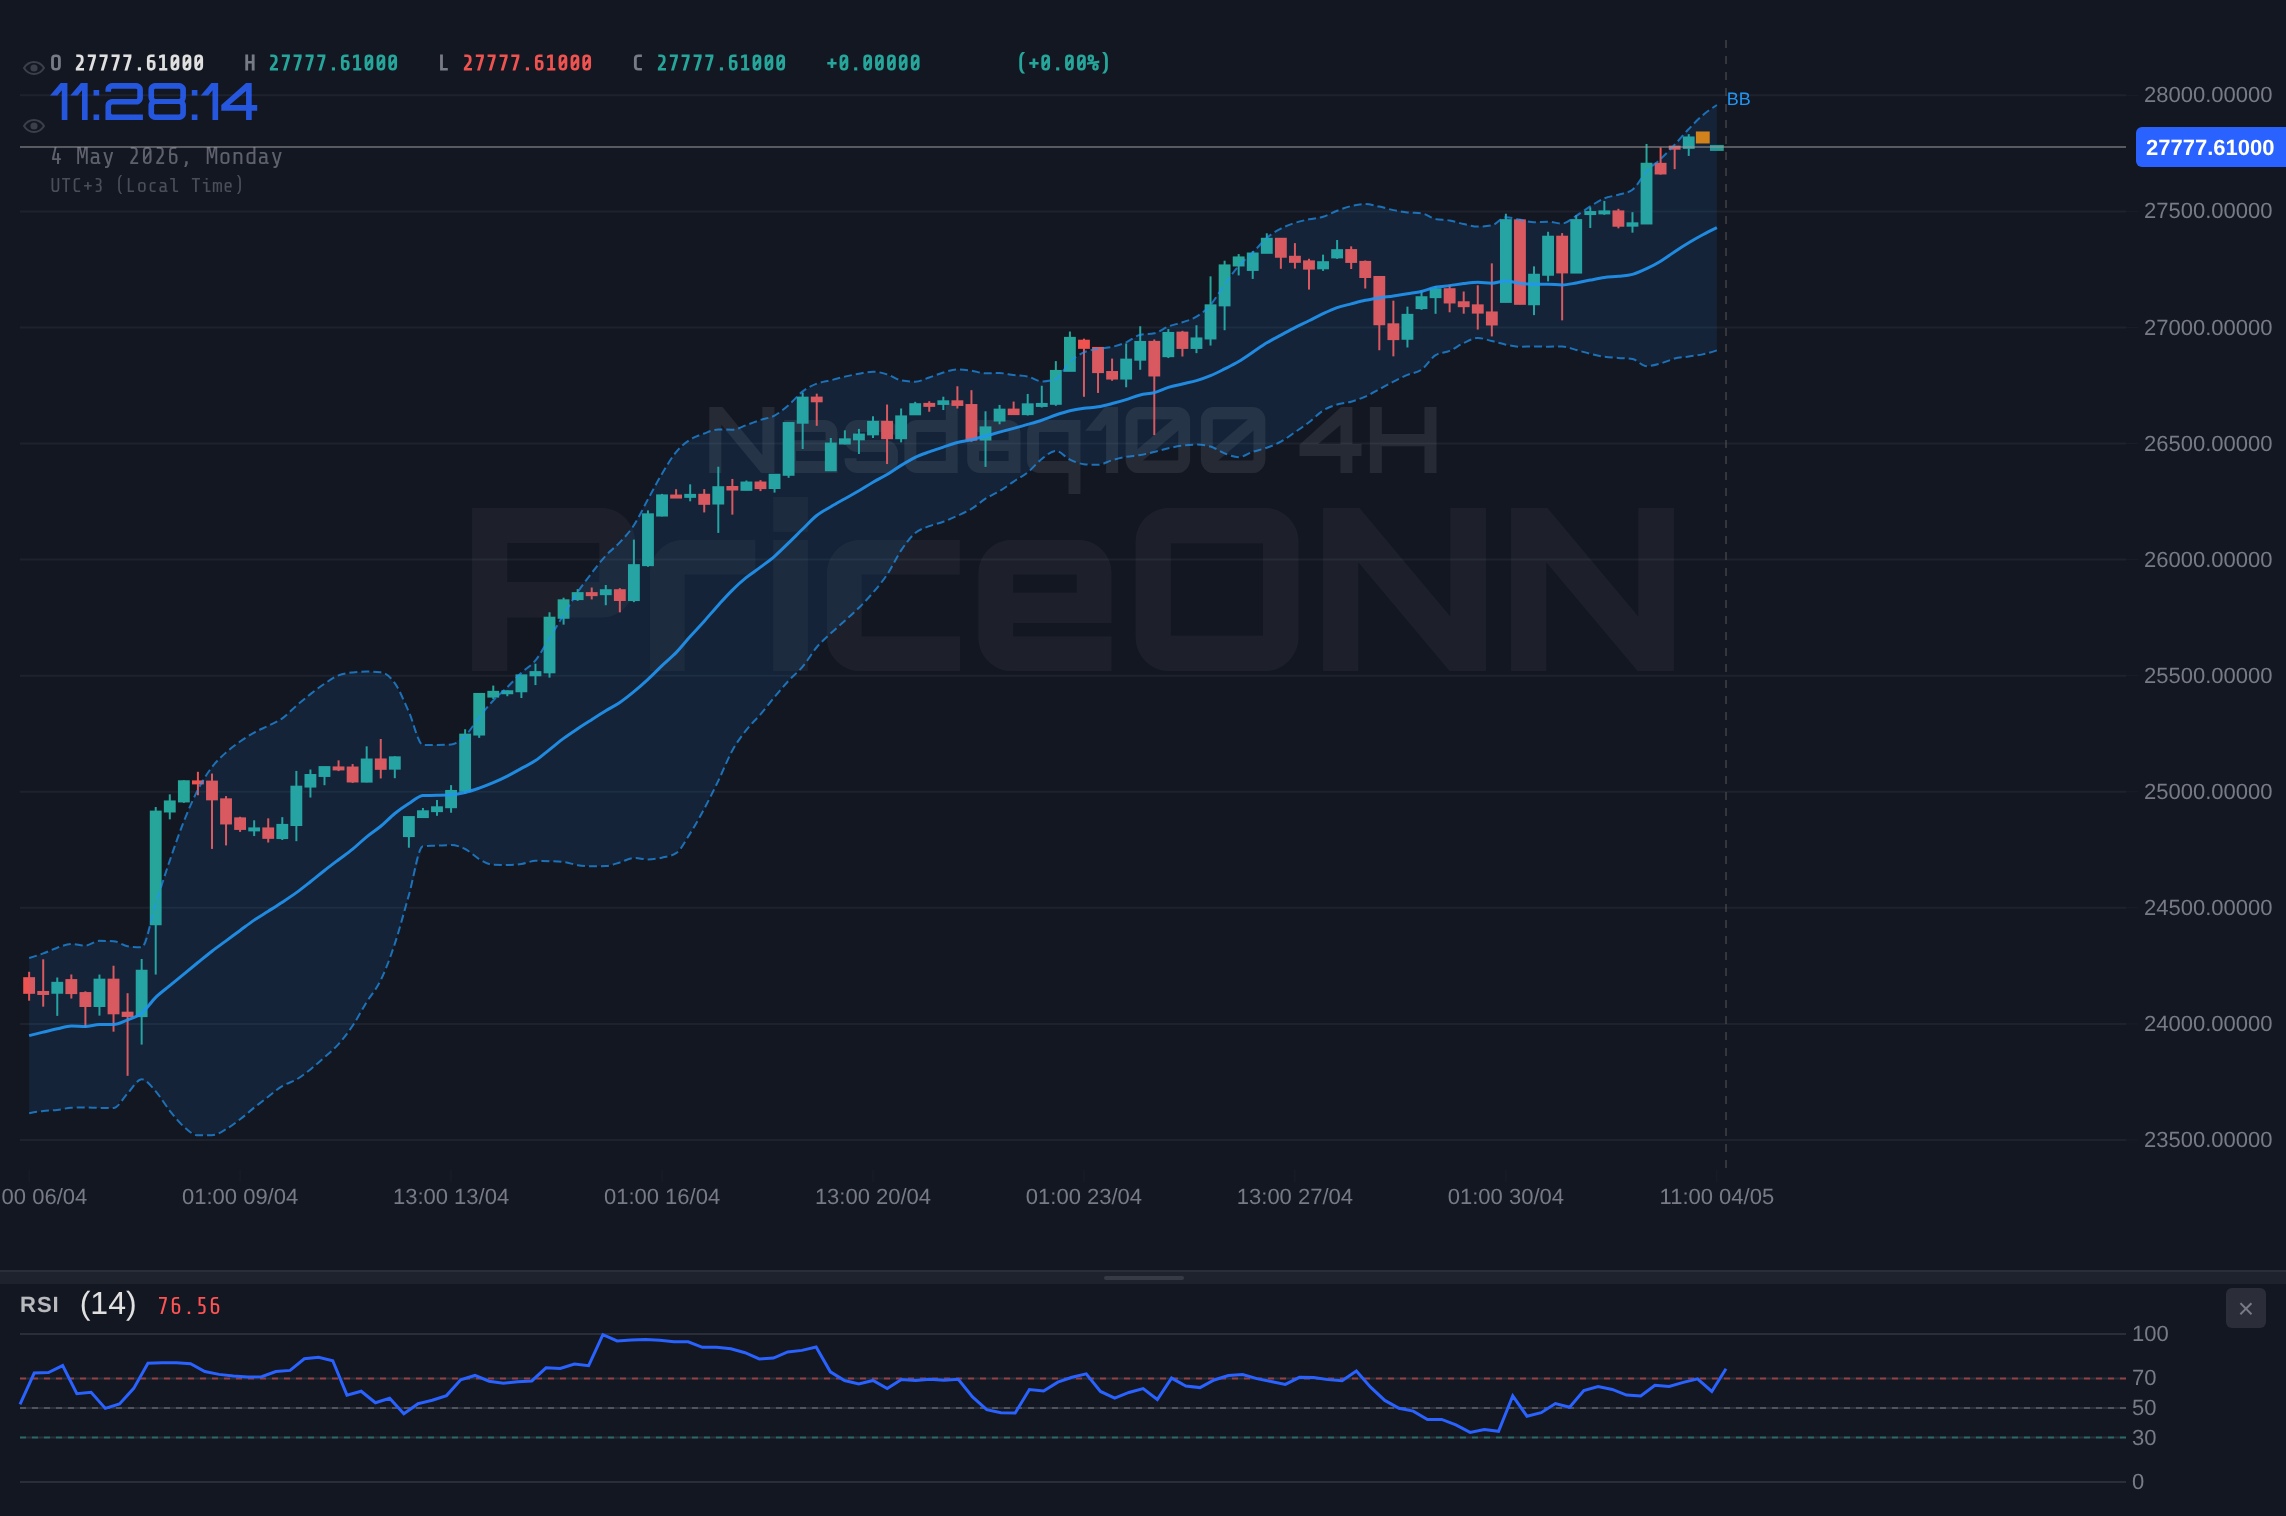
Decoding Technical Indicators for Nasdaq100 Trend Analysis
The technical indicators are painting a mixed picture, but leaning bearish. The 1-hour RSI sits at 37.91, suggesting further downside momentum. The MACD is showing negative momentum, confirming the short-term bearish trend. The Stochastic indicator is in oversold territory (K=14.22, D=54.22), which could signal a potential bounce. However, the ADX at 26.33 on the daily chart indicates that the downtrend is strong. This is not a time to blindly buy the dip. Wait for confirmation of a trend reversal before jumping in. Historically, when the ADX reaches these levels, the market often sees a period of consolidation before resuming the previous trend or reversing course. This period of indecision can be frustrating for traders, but it's crucial to remain disciplined and avoid chasing the market.
The DXY Effect: How Dollar Strength Impacts Nasdaq100 Price Forecast
The DXY (Dollar Index) is a crucial factor to consider when analyzing the Nasdaq100. The DXY currently sits at 99.11, showing strength. A rising DXY typically puts downward pressure on risk assets like the Nasdaq100. This is because a stronger dollar makes U.S. assets more expensive for foreign investors and can signal tighter monetary policy. The inverse correlation between the DXY and the Nasdaq100 has been particularly strong in recent months, as the market has been hyper-focused on Fed policy. Keep a close eye on the DXY; further gains could exacerbate the selling pressure on the Nasdaq100. Having tracked the Nasdaq100 through the 2024 rate cycle, I've seen this pattern play out time and time again. A strong dollar acts as a headwind for U.S. equities, especially those with significant international exposure.
Crude Oil Surge: Will Rising Energy Costs Force the Fed's Hand?
The surge in crude oil prices is another major headwind for the Nasdaq100. WTI crude is trading at $86.56, driven by escalating geopolitical tensions in the Middle East, as reported by Forex Haber. Historically, rising oil prices have been a major concern for equity markets, as they can lead to higher inflation and slower economic growth. If the Fed is forced to respond to rising inflation by raising interest rates, this would put further downward pressure on the Nasdaq100. We need to monitor the situation closely. Is this a temporary spike, or is it the start of a sustained uptrend in oil prices? The answer to this question will have a significant impact on the outlook for the Nasdaq100.
Decoding Market Sentiment: Fear Gauge and Nasdaq100 Volatility Analysis
Market sentiment is decidedly bearish at the moment. The VIX (volatility index), often referred to as the "fear gauge," is elevated, indicating heightened uncertainty and risk aversion. When the VIX is high, investors tend to sell risk assets and move into safe havens. This is exactly what we're seeing today. The SP500 is down -0.46% and DowJones30 is down -0.42%, with investors rotating out of equities and into bonds. A prolonged period of high volatility could lead to a deeper correction in the Nasdaq100. I would suggest monitoring the VIX closely as a gauge of market sentiment. A sustained decline in the VIX would be a positive sign for the Nasdaq100, suggesting that investors are becoming more comfortable with the current market environment.
Nasdaq100 News Impact: Analyzing Geopolitical Risks and US Economic Data
The recent news flow has been decidedly negative for the Nasdaq100. Escalating tensions in the Middle East have sent oil prices soaring, creating a complex situation for the Reserve Bank of New Zealand, as mentioned in a recent forex article. The US Dollar faces headwinds as global currencies react to fluctuating oil prices, inflation concerns, and evolving monetary policy. The upcoming US Non-Farm Payroll (NFP) data is a key event to watch. A strong NFP number could reinforce the Fed's hawkish stance, putting further downward pressure on the Nasdaq100. Conversely, a weak NFP number could signal a slowdown in the US economy, which could lead to a more dovish Fed and a potential rally in the Nasdaq100. Until the NFP data resolves this, caution is warranted.
Multi-Timeframe Analysis: Spotting Potential Reversal Zones for Nasdaq100
A multi-timeframe analysis reveals a complex picture. On the daily chart, the Nasdaq100 is in a neutral trend, with the ADX at 26.33 indicating a strong downtrend. The RSI sits at 46.11, suggesting further downside potential. On the 4-hour chart, the trend is also bearish, with the ADX at 13.56. The RSI is at 47.5, also indicating further downside. The 1-hour chart confirms the bearish trend, with the RSI at 37.91. This multi-timeframe alignment suggests that the current downtrend is likely to continue in the short term. However, the oversold conditions on the 1-hour chart could lead to a temporary bounce. Scalpers should be looking for shorting opportunities on these bounces, while swing traders should remain cautious and avoid entering new long positions until the trend reverses.
Nasdaq Forecast 2026: Navigating Choppy Waters with Caution
The near-term outlook for the Nasdaq100 remains uncertain. The combination of hawkish Fed commentary, rising oil prices, and geopolitical risks is creating a challenging environment for risk assets. The $24,734.19 level is the key level to watch. A sustained break below this level could trigger a deeper correction. Until the market resolves these uncertainties, caution is warranted. However, patient investors should be watching for buying opportunities at lower levels. The long-term outlook for the Nasdaq100 remains positive, driven by innovation and technological advancements. But in the short term, volatility is likely to remain elevated, and disciplined risk management is essential.
Frequently Asked Questions: Nasdaq100 Analysis
Is Nasdaq100 a good buy right now?
Given the current market volatility and hawkish Fed stance, Nasdaq100 might not be a good buy right now. The price is at $24,809.88, and breaking below the $24,734.19 support could lead to further declines. Wait for a clear reversal signal before considering a long position.
What is the Nasdaq100 price forecast for this week?
The Nasdaq100 price forecast for this week is uncertain, with a bearish bias. Key resistance lies at $25,201.77, while support is at $24,734.19. A break of either level will likely dictate the direction of the index. I estimate a 60% chance of further downside this week.
What are the key support and resistance levels for Nasdaq100?
Key support levels for Nasdaq100 are at $24,734.19, $24,500.22, and $24,266.61. Key resistance levels are at $25,201.77, $25,435.38, and $25,669.35. These levels are derived from recent price action and Fibonacci retracement analysis.
Why is Nasdaq100 moving today?
Nasdaq100 is moving lower today due to hawkish commentary from Fed speakers, rising oil prices, and escalating geopolitical tensions. These factors are weighing on market sentiment and leading to a rotation out of risk assets.
Volatility creates opportunity-those prepared will be rewarded.
Track markets in real-time
AI-powered analysis, technical indicators and real-time price data.
Join Our Telegram Channel
Breaking market news, AI analysis and trading signals instantly.
Join Channel