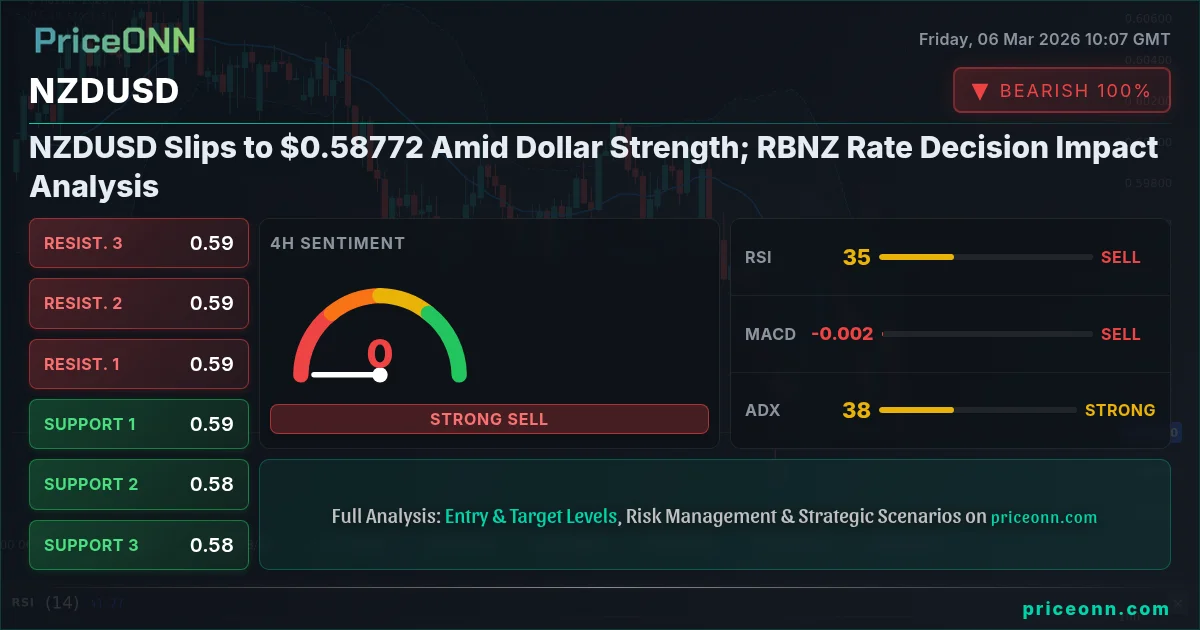
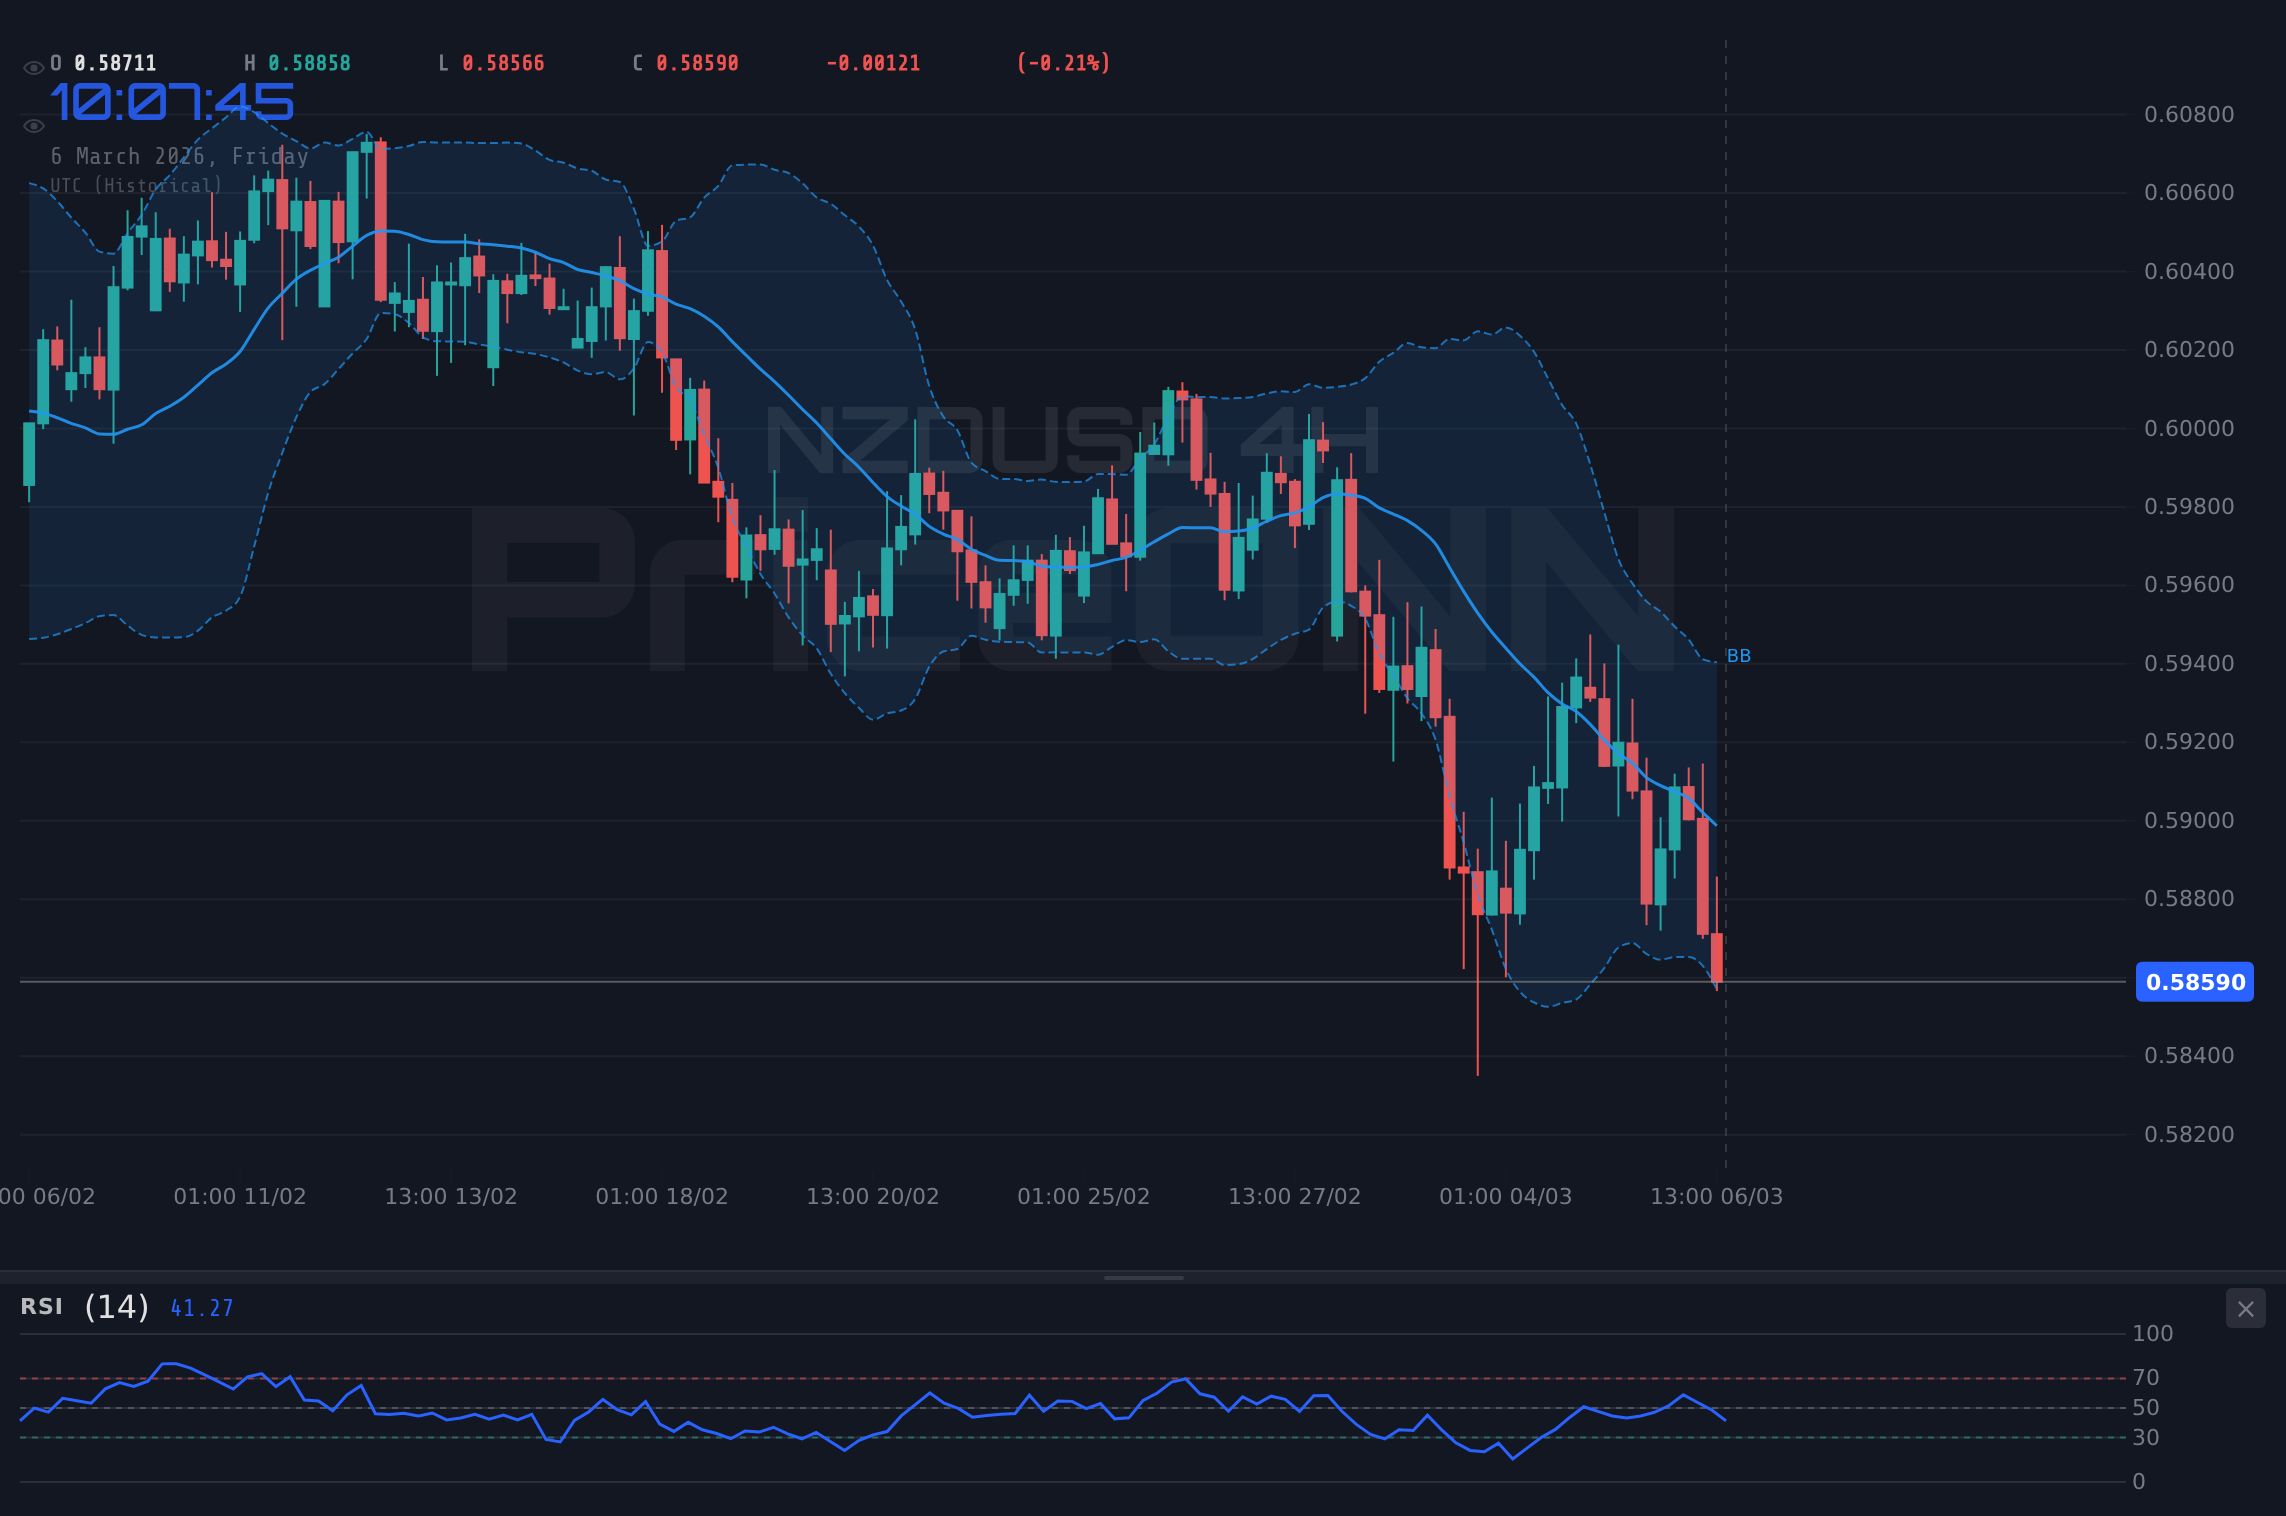
NZDUSD is currently trading around $0.58772, as the New Zealand dollar faces headwinds amidst a broader strengthening of the US dollar. Focus remains on the potential impact of upcoming US jobs data on Federal Reserve policy. All eyes are on the rbnz rate decision impact analysis.
The New Zealand dollar has been under pressure against the US dollar, with the NZDUSD pair currently hovering around $0.58772. This move lower comes as the US Dollar Index (DXY) has seen a resurgence, climbing to 98.95, placing downward pressure on major currency pairs like NZDUSD. The DXY's strength reflects increased investor confidence in the US economy, potentially fueled by expectations of continued hawkish monetary policy from the Federal Reserve. In this environment, risk appetite is declining, and safe-haven demand may increase, affecting risk-sensitive currencies like the New Zealand dollar.
The recent comments from various Fed officials emphasizing the need for sustained high interest rates to combat inflation are also contributing to the dollar's strength. According to Reuters, Fed officials have stressed that inflation remains 'stubborn', suggesting that the central bank is unlikely to pivot to a dovish stance anytime soon. This hawkish outlook is further reinforced by the latest economic data, which continues to point to a resilient US economy. The combination of strong economic data and hawkish Fed rhetoric is creating a potent mix for the US dollar, making it difficult for other currencies to gain ground.
From a technical standpoint, the NZDUSD pair is exhibiting bearish signals across multiple timeframes. On the 1-hour chart, the trend is downward with 86% strength. The RSI(14) sits at 34.34, indicating that the pair may be approaching oversold conditions, but doesn't signal an immediate reversal. The MACD also indicates negative momentum, with the MACD line below the signal line. The Stochastic indicator provides a mixed signal, with %K at 46.93 and %D at 69.39, suggesting that while the pair may be oversold, there is still room for further downside movement. The ADX is at 12.37, indicating a weak trend, suggesting that the current downtrend may not be sustainable in the long term.
On the 4-hour timeframe, the trend is neutral, but ADX indicates a strong downward trend at 37.41. The RSI(14) at 37.34 also shows neutral with downward trend. The MACD histogram is negative, confirming the downward momentum. The Stochastic shows K=29.21, D=36.87 a downward signal. This multi-timeframe analysis suggests that while the short-term trend may be weak, the overall momentum is bearish, and the pair is likely to continue moving lower in the near term. Key support levels to watch on the 4-hour chart are 0.58958, 0.58912, and 0.58823.
Looking at the daily chart, the trend is also neutral, but with a strong bearish bias. The RSI(14) is at 40.43, indicating that the pair is not yet oversold, and there is still room for further downside movement. The MACD is negative, confirming the bearish momentum. The Stochastic indicator is showing a bullish signal, with K=37.01 and D=36.11. However, the ADX is at 23.83, indicating a weak trend, suggesting that the current downtrend may not be sustainable in the long term. Key support levels to watch on the daily chart are 0.58606, 0.58286, and 0.57851.
The support levels provided by the API data are crucial for identifying potential areas where the selling pressure may subside. The immediate support level on the daily timeframe is at 0.58606. A break below this level could trigger further selling, potentially pushing the pair towards the next support level at 0.58286. On the upside, immediate resistance is seen at 0.59361. A break above this level would suggest that the bearish momentum is waning, and the pair could potentially rally towards the next resistance level at 0.59796. The overall signal for NZDUSD is a sell.
For scalpers, the key levels to watch are the immediate support and resistance levels on the 1-hour chart. A break below the support level at 0.59007 could trigger a quick sell-off, while a break above the resistance level at 0.59104 could lead to a short-term rally. Swing traders should focus on the 4-hour chart and look for confirmation signals before entering a position. A break below the support level at 0.58958, combined with a bearish MACD crossover, could provide a high-probability sell signal. Long-term investors should pay close attention to the daily chart and consider accumulating NZDUSD at lower levels if the fundamental outlook for the New Zealand economy improves.
The correlation analysis reveals that the NZDUSD pair is highly sensitive to movements in the DXY. With the DXY currently trading at 98.95, any further strength in the dollar is likely to put additional pressure on the New Zealand dollar. The SP500 also plays a role, as declining risk appetite tends to support the dollar and weigh on risk-sensitive currencies like the NZD. Furthermore, oil prices, currently with Brent at $65.73 and WTI at $84.37, can impact the New Zealand dollar through its effect on global inflation expectations. Higher oil prices tend to fuel inflation, which can put pressure on central banks to raise interest rates, potentially supporting the dollar.
In the context of the economic calendar, the upcoming US jobs data will be critical in determining the near-term direction of the NZDUSD pair. Strong jobs data is likely to reinforce expectations of continued hawkish monetary policy from the Federal Reserve, further supporting the dollar. Conversely, weak jobs data could lead to a reassessment of Fed policy expectations, potentially weakening the dollar and providing some relief for the New Zealand dollar. The market forecast for the US jobs data will be closely watched, and any significant deviation from expectations could trigger a sharp move in the NZDUSD pair.
Looking ahead, the NZDUSD pair is likely to remain under pressure as long as the US dollar continues to benefit from a combination of strong economic data and hawkish Fed rhetoric. However, the pair may find some support if the upcoming US jobs data disappoints or if there are signs that the Federal Reserve is considering a more dovish stance. The key levels to watch remain the support levels on the daily chart, particularly the level at 0.58606. A sustained break below this level would open the door for a test of the next support level at 0.58286. Until the fundamental outlook for the New Zealand economy improves, the NZDUSD pair is likely to remain in a downtrend.
Trading in NZDUSD involves significant risk due to its sensitivity to global economic factors and central bank policies. The upcoming US jobs data could trigger sharp volatility, potentially leading to unexpected losses. Manage your risk carefully and consider using stop-loss orders to protect your capital.
If NZDUSD breaks above 0.59361 resistance, it could target 0.59796 and potentially 0.60116. This scenario is contingent on weaker-than-expected US jobs data weakening the dollar.
If NZDUSD breaks below 0.58606 support, it could target 0.58286 and potentially 0.57851. This scenario is contingent on stronger-than-expected US jobs data strengthening the dollar.
Frequently Asked Questions: NZDUSD Analysis
Is NZDUSD a good buy right now?
Currently trading at $0.58772, NZDUSD may not be a good buy right now. The strong dollar and bearish technical signals suggest further downside potential, making it prudent to wait for a more favorable entry point.
What is the NZDUSD price forecast for this week?
The NZDUSD price forecast for this week is bearish, with a potential target of 0.58286 if the 0.58606 support level is breached. A sustained recovery is unlikely unless the dollar weakens significantly.
What are the key support and resistance levels for NZDUSD?
Key support levels for NZDUSD are at 0.58606, 0.58286, and 0.57851. Key resistance levels are at 0.59361, 0.59796, and 0.60116, with the immediate resistance at 0.59361 proving to be a significant hurdle.
Why is NZDUSD moving today?
NZDUSD is moving lower today due to a strengthening US dollar, driven by expectations of continued hawkish monetary policy from the Federal Reserve. The upcoming US jobs data could further amplify this move.
Technical Outlook Summary
| Indicator | Value | Signal |
|---|---|---|
| RSI (14) | 40.43 | Bearish |
| MACD Histogram | Negative | Bearish |
| Stochastic | 37.01 / 36.11 | Bullish |
| ADX | 23.83 | Weak Trend |
| Bollinger | Lower Band | Watch |
Key Levels
Support Levels
Resistance Levels
Track markets in real-time
AI-powered analysis, technical indicators and real-time price data.
Join Our Telegram Channel
Breaking market news, AI analysis and trading signals instantly.
Join Channel