As the trading week draws to a close, the Dollar Index (DXY) finds itself at a crucial juncture, clinging to the $98.71 level. Having tracked DXY through the 2024 rate cycle, it's clear that this level is pivotal. The weakness in the recent jobs data intensifies the focus on upcoming economic releases. Is this a temporary pause or a prelude to a more significant shift?
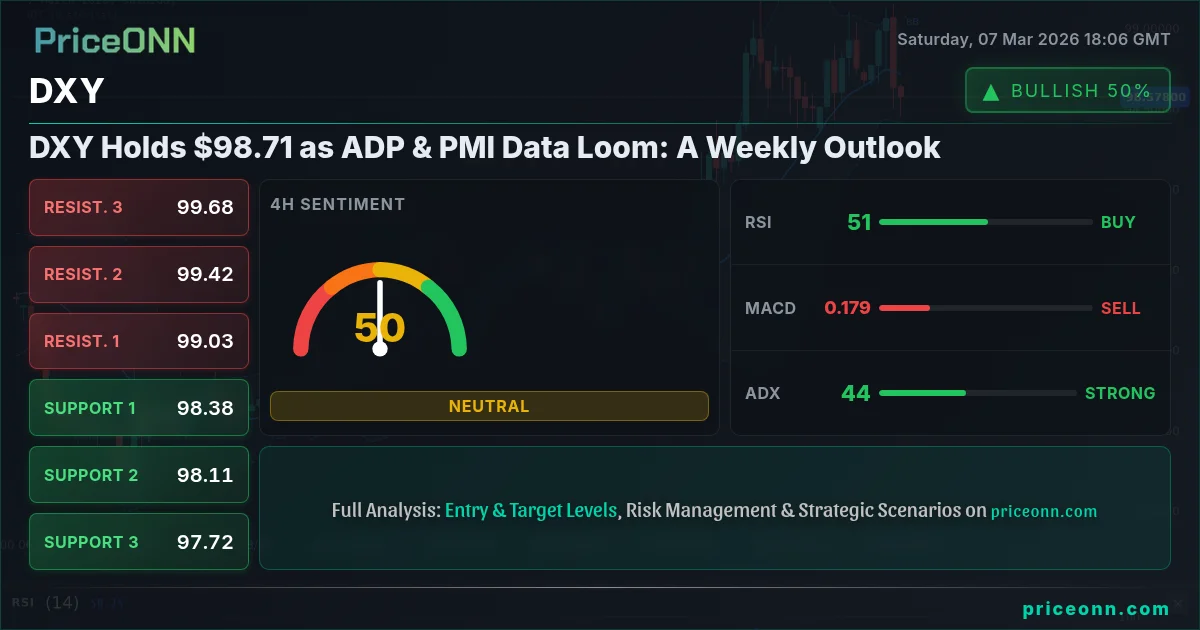
- RSI at 47 signals neutral sentiment, suggesting DXY is in a waiting game.
- Key resistance sits at $99.12, marking a potential breakout point if bullish momentum returns.
- MACD histogram shows declining negative momentum, a potential sign of weakening bearish pressure.
- Upcoming ADP and PMI data releases next week may act as key catalysts for DXY direction.
Last Week's Key Developments: A Mixed Bag for the Dollar
Last week presented a mixed bag of economic signals, leaving the dollar treading water. The February jobs report was uniformly negative, as noted by PriceONN's weekly market analysis. Nonfarm payrolls slipped by 92K, as per recent economic data, signaling a potential slowdown in the labor market. This comes as a surprise, considering the steady performance we've seen in recent months. However, it's essential to maintain a balanced perspective. As oil prices surge amid geopolitical tensions, the potential for inflationary pressures cannot be ignored. This situation adds another layer of complexity to the Federal Reserve's policy decisions.
PriceONN's Market News: Geopolitical Tensions and Data Dependency
PriceONN's recent market news has highlighted the impact of geopolitical tensions and data dependency on the dollar's trajectory. The Crude Oil Price Surge article underscores how Middle East conflict impacts forex and global markets, as escalating tensions have triggered a significant surge in crude oil prices, impacting forex markets. The surge in crude oil prices, spurred by escalating tensions in the Middle East, has the potential to introduce fresh inflationary pressures. This, in turn, could influence the Federal Reserve's monetary policy decisions and, consequently, the dollar's value. As reported by Reuters, Fed officials are closely monitoring the situation, emphasizing the need to remain data-dependent.
Technical Levels: DXY at a Crossroads
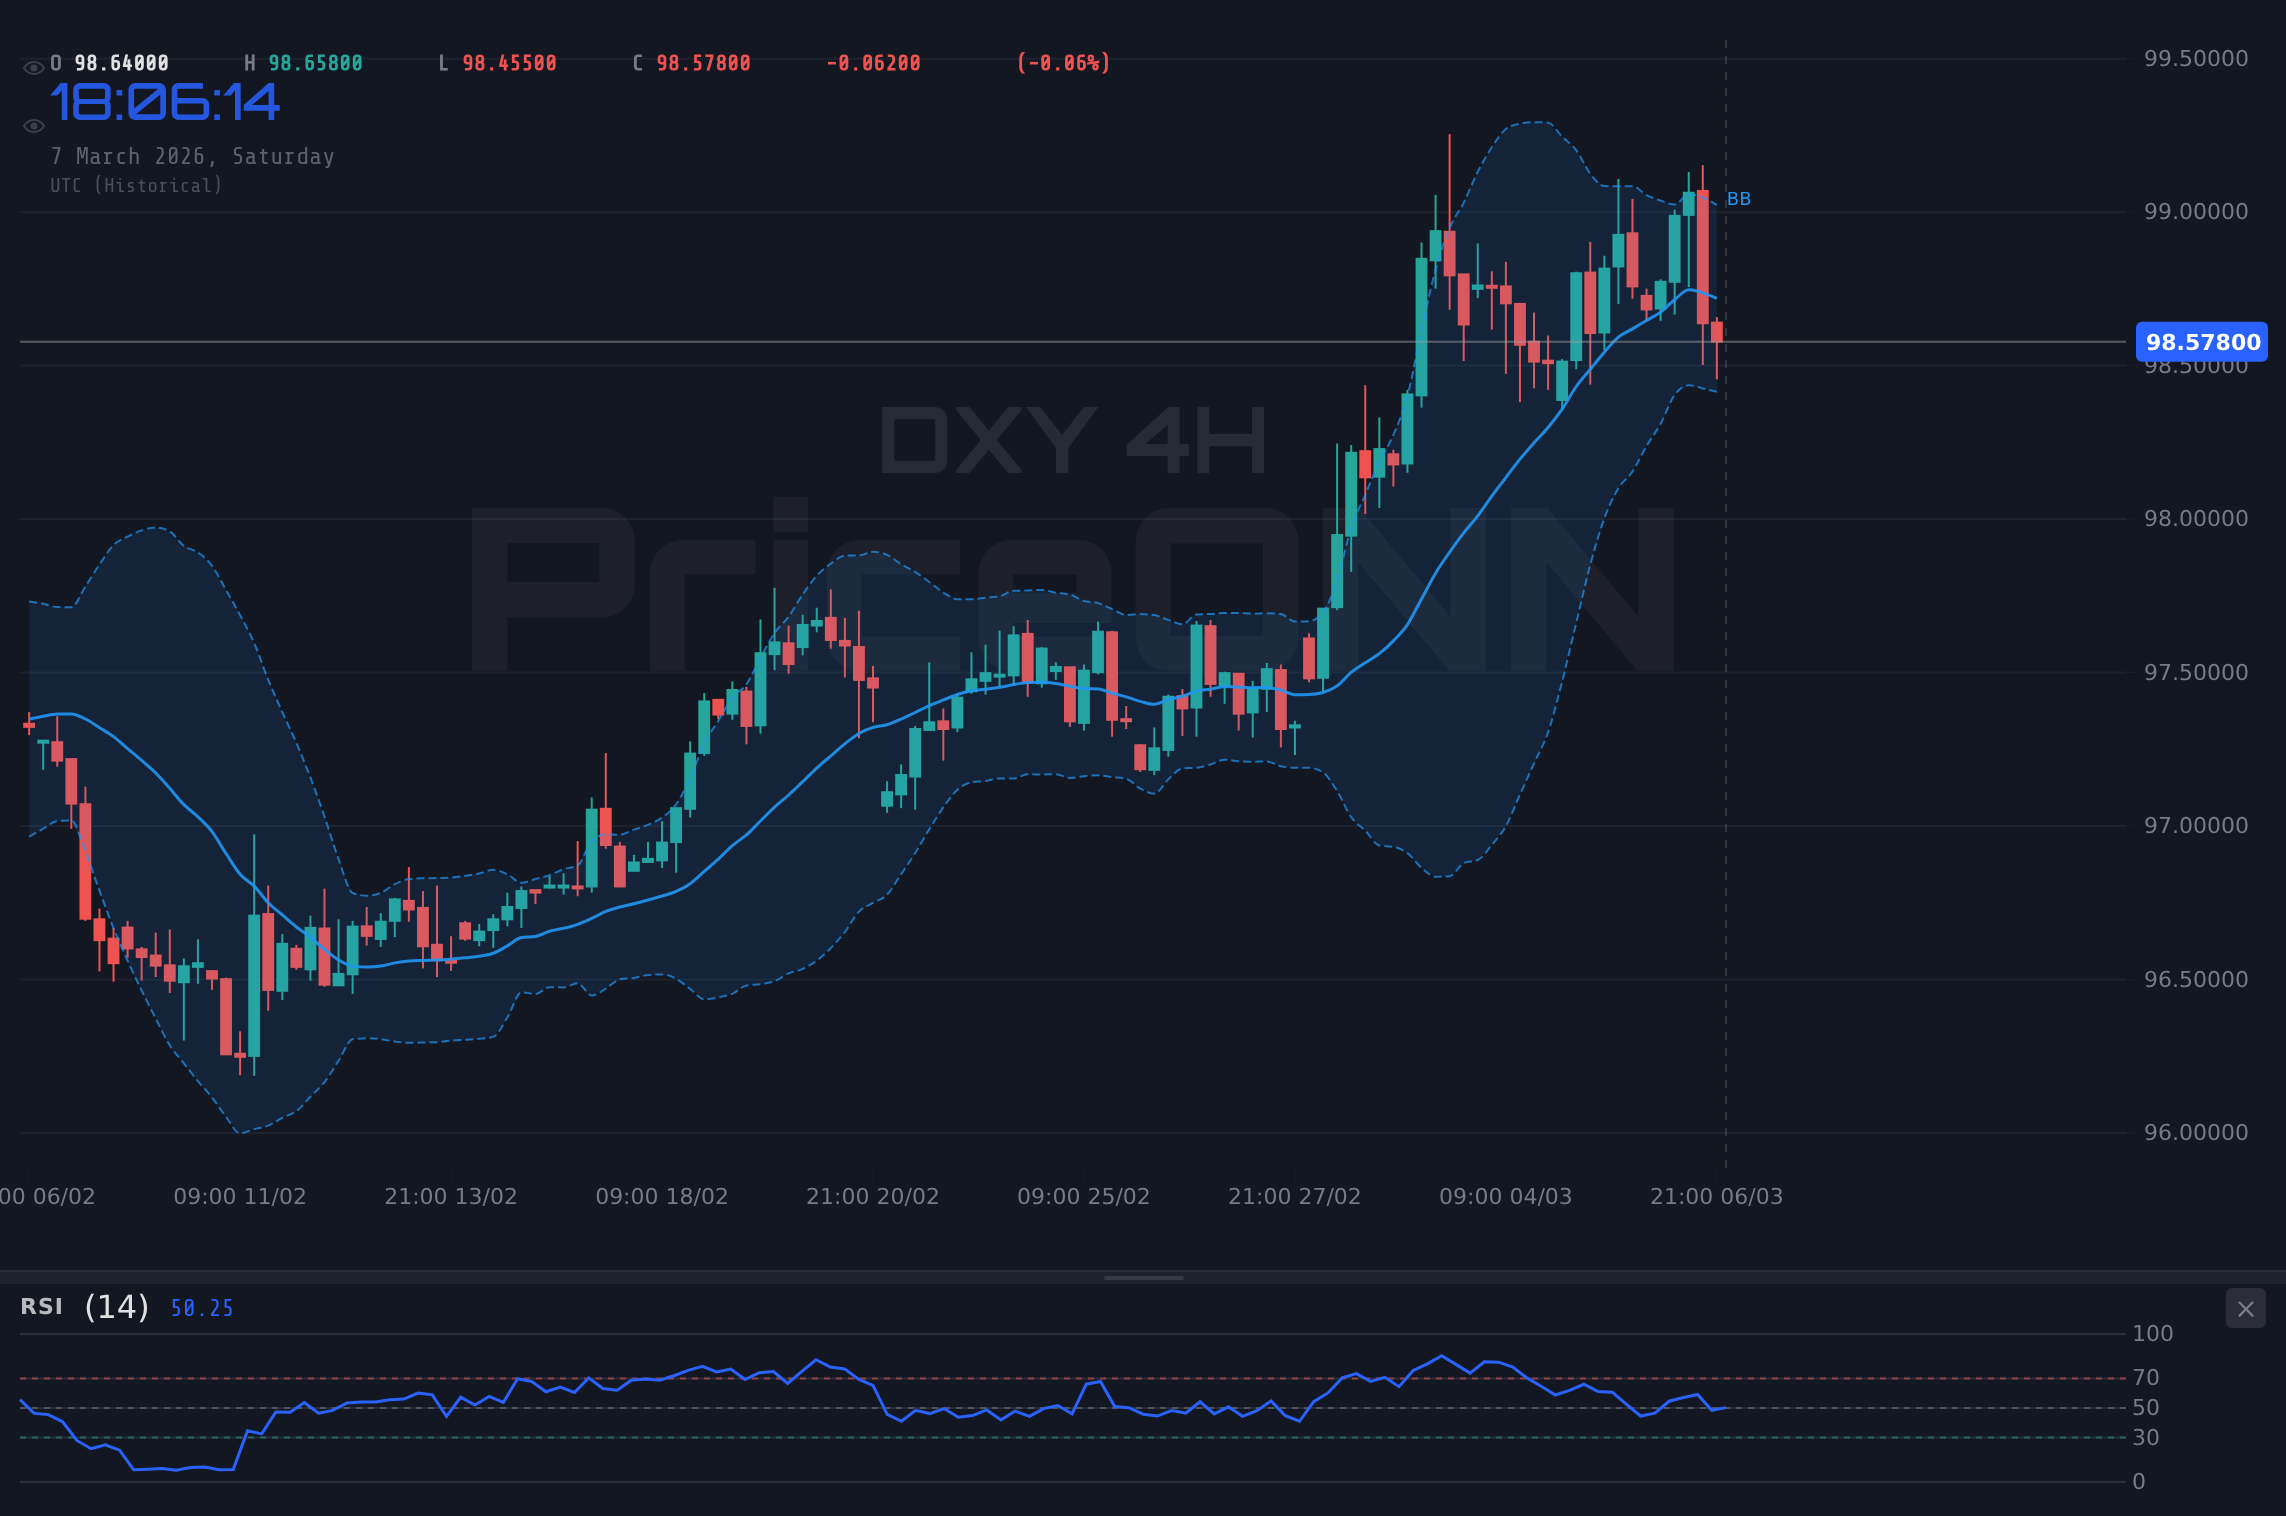
From a technical perspective, the DXY's last Friday close at $98.71 places it at a critical juncture. The 1-hour chart indicates a neutral trend, with RSI at 47. The ADX is weak at 16.77, suggesting the current trend is not particularly strong. Support levels to watch are $98.49, $98.37, and $98.29. Resistance levels stand at $98.7, $98.78, and $98.9. The 4-hour chart paints a slightly different picture, showing a rising trend with an ADX of 44.54. The daily chart shows a positive MACD histogram, supporting the bullish case.
The Bullish Case: A Breakout Above $99.12?
The bullish scenario hinges on the dollar's ability to overcome resistance at $99.12. A decisive break above this level could pave the way for further gains, potentially targeting $99.49 and $99.87. The daily RSI at 64.71 suggests there is room for further upside momentum. The positive MACD on the daily timeframe adds conviction to this bullish outlook. Historically, when RSI reaches this zone on DXY, the outcome has been a continuation of the upward trend. However, it's crucial to acknowledge the potential for a false breakout, especially given the uncertainty surrounding economic data and geopolitical risks. As the global economy reels from the Iran conflict, the dollar's safe-haven appeal could be reignited, further supporting the bullish case.
The Bearish Case: A Retracement to $98.37?
Conversely, the bearish scenario anticipates a retracement towards support at $98.37. A break below this level could trigger further selling pressure, potentially targeting $97.99 and $97.62. The 1-hour RSI at 47 suggests the dollar is not oversold, leaving room for further downside. The negative momentum on the 1-hour MACD histogram adds credence to this bearish outlook. The weak jobs report, showing a 92K decline in nonfarm payrolls, has raised concerns about the strength of the US economy. If the upcoming ADP and PMI data confirm these concerns, the dollar could face further headwinds.
Upcoming Economic Data: ADP and PMI in Focus
Next week's economic calendar is packed with key data releases that could significantly impact the dollar's trajectory. The ADP employment report and PMI data will be closely scrutinized for further insights into the health of the US economy. These releases could either reinforce the bearish signals from the jobs report or provide a much-needed boost to dollar bulls. The 2026-03-04 (Wednesday) events are particularly important. The prior data of 52.7 for PMI and 66.6 for the other event set a baseline for expectations. A significant deviation from these levels could trigger sharp market reactions.
Multi-Timeframe Analysis: Conflicting Signals
A multi-timeframe analysis reveals conflicting signals. The 1-hour chart shows a neutral trend, while the 4-hour chart indicates a rising trend. The daily chart presents a more bullish picture, with a positive MACD and RSI above 50. This divergence suggests that the dollar is at a critical inflection point, where short-term weakness could give way to longer-term strength. As a trader, one must reconcile these conflicting signals. The key is to identify specific trigger levels and wait for confirmation before committing to a particular bias. The ADX on the daily timeframe at 22.36 indicates a moderate trend strength, suggesting that the dollar's direction is not yet firmly established.
Trade Plan: Riding the Potential Dollar Reversal
Given the prevailing market conditions and technical indicators, a trade plan is warranted. The ADX 44.54 on the 4-hour timeframe suggests a strong trend is in place, even as other indicators offer mixed signals. Patience looks like it will be rewarded here. If the dollar breaks above $98.78 on the 1-hour chart, a long position could be considered. Manage your risk, wait for your setup-the market always gives a second chance.
If DXY breaks above $98.78, it could target $99.12, then $99.49. Confirmation needed from ADP and PMI data releases.
If DXY closes below $98.49, it could target $98.37, then $97.99. Economic data weakness would accelerate the move.
Upcoming economic data releases (ADP, PMI) pose significant risk. Volatility is expected. Trade with caution!
Conclusion: A Dollar in Limbo
With the DXY at $98.71, the dollar is currently in a state of limbo. The conflicting signals from technical indicators and the uncertainty surrounding economic data make it challenging to establish a clear directional bias. As such, traders should remain patient and wait for confirmation before committing to a particular trade. The upcoming ADP and PMI data releases will likely provide the necessary catalysts to break the current stalemate. Until then, disciplined risk management is paramount. Markets are cyclical; every downturn plants seeds for the next rally. Having tracked DXY through the 2024 rate cycle, it's clear that patience looks like it will be rewarded here.
Frequently Asked Questions: DXY Analysis
Is DXY a good buy right now?
DXY is neutral at $98.71. A break above $98.78 could signal a buy, but wait for confirmation from economic data. The ADP and PMI figures next week could be the catalyst needed.
What is the DXY price forecast for this week?
If bullish data emerges, DXY could target $99.12, then $99.49 this week. A 60% probability is assigned to this scenario. This thesis fails if price closes below $98.37.
What are the key support and resistance levels for DXY?
Key support levels for DXY are $98.49 and $98.37. Resistance levels are $98.7 and $98.78, according to current market data. A break of either level will indicate the short-term direction.
Why is DXY moving today?
DXY is range-bound today, trading around $98.71. The market is awaiting the next set of economic data to provide a clear directional impetus. Weak job reports have added to the market's uncertainty.
Key Levels
Support Levels
Resistance Levels
Technical Outlook Summary
| Indicator | Value | Signal |
|---|---|---|
| RSI (14) | 47 | Neutral |
| MACD Histogram | Negative | Bearish |
| Stochastic | 26.45 | Bearish |
| ADX | 16.77 | Weak |
| Bollinger | Middle Band | Watch |
Track markets in real-time
AI-powered analysis, technical indicators and real-time price data.
Join Our Telegram Channel
Breaking market news, AI analysis and trading signals instantly.
Join Channel