Is the dollar index rising today, or is it merely pausing for breath before its next move? Having tracked DXY through numerous economic cycles, my read is that we're at a critical juncture. The index is currently trading near $98.71, and this week's performance has been relatively flat, leaving traders wondering if the recent strength is sustainable.
A Week of Sideways Action for the Dollar Index
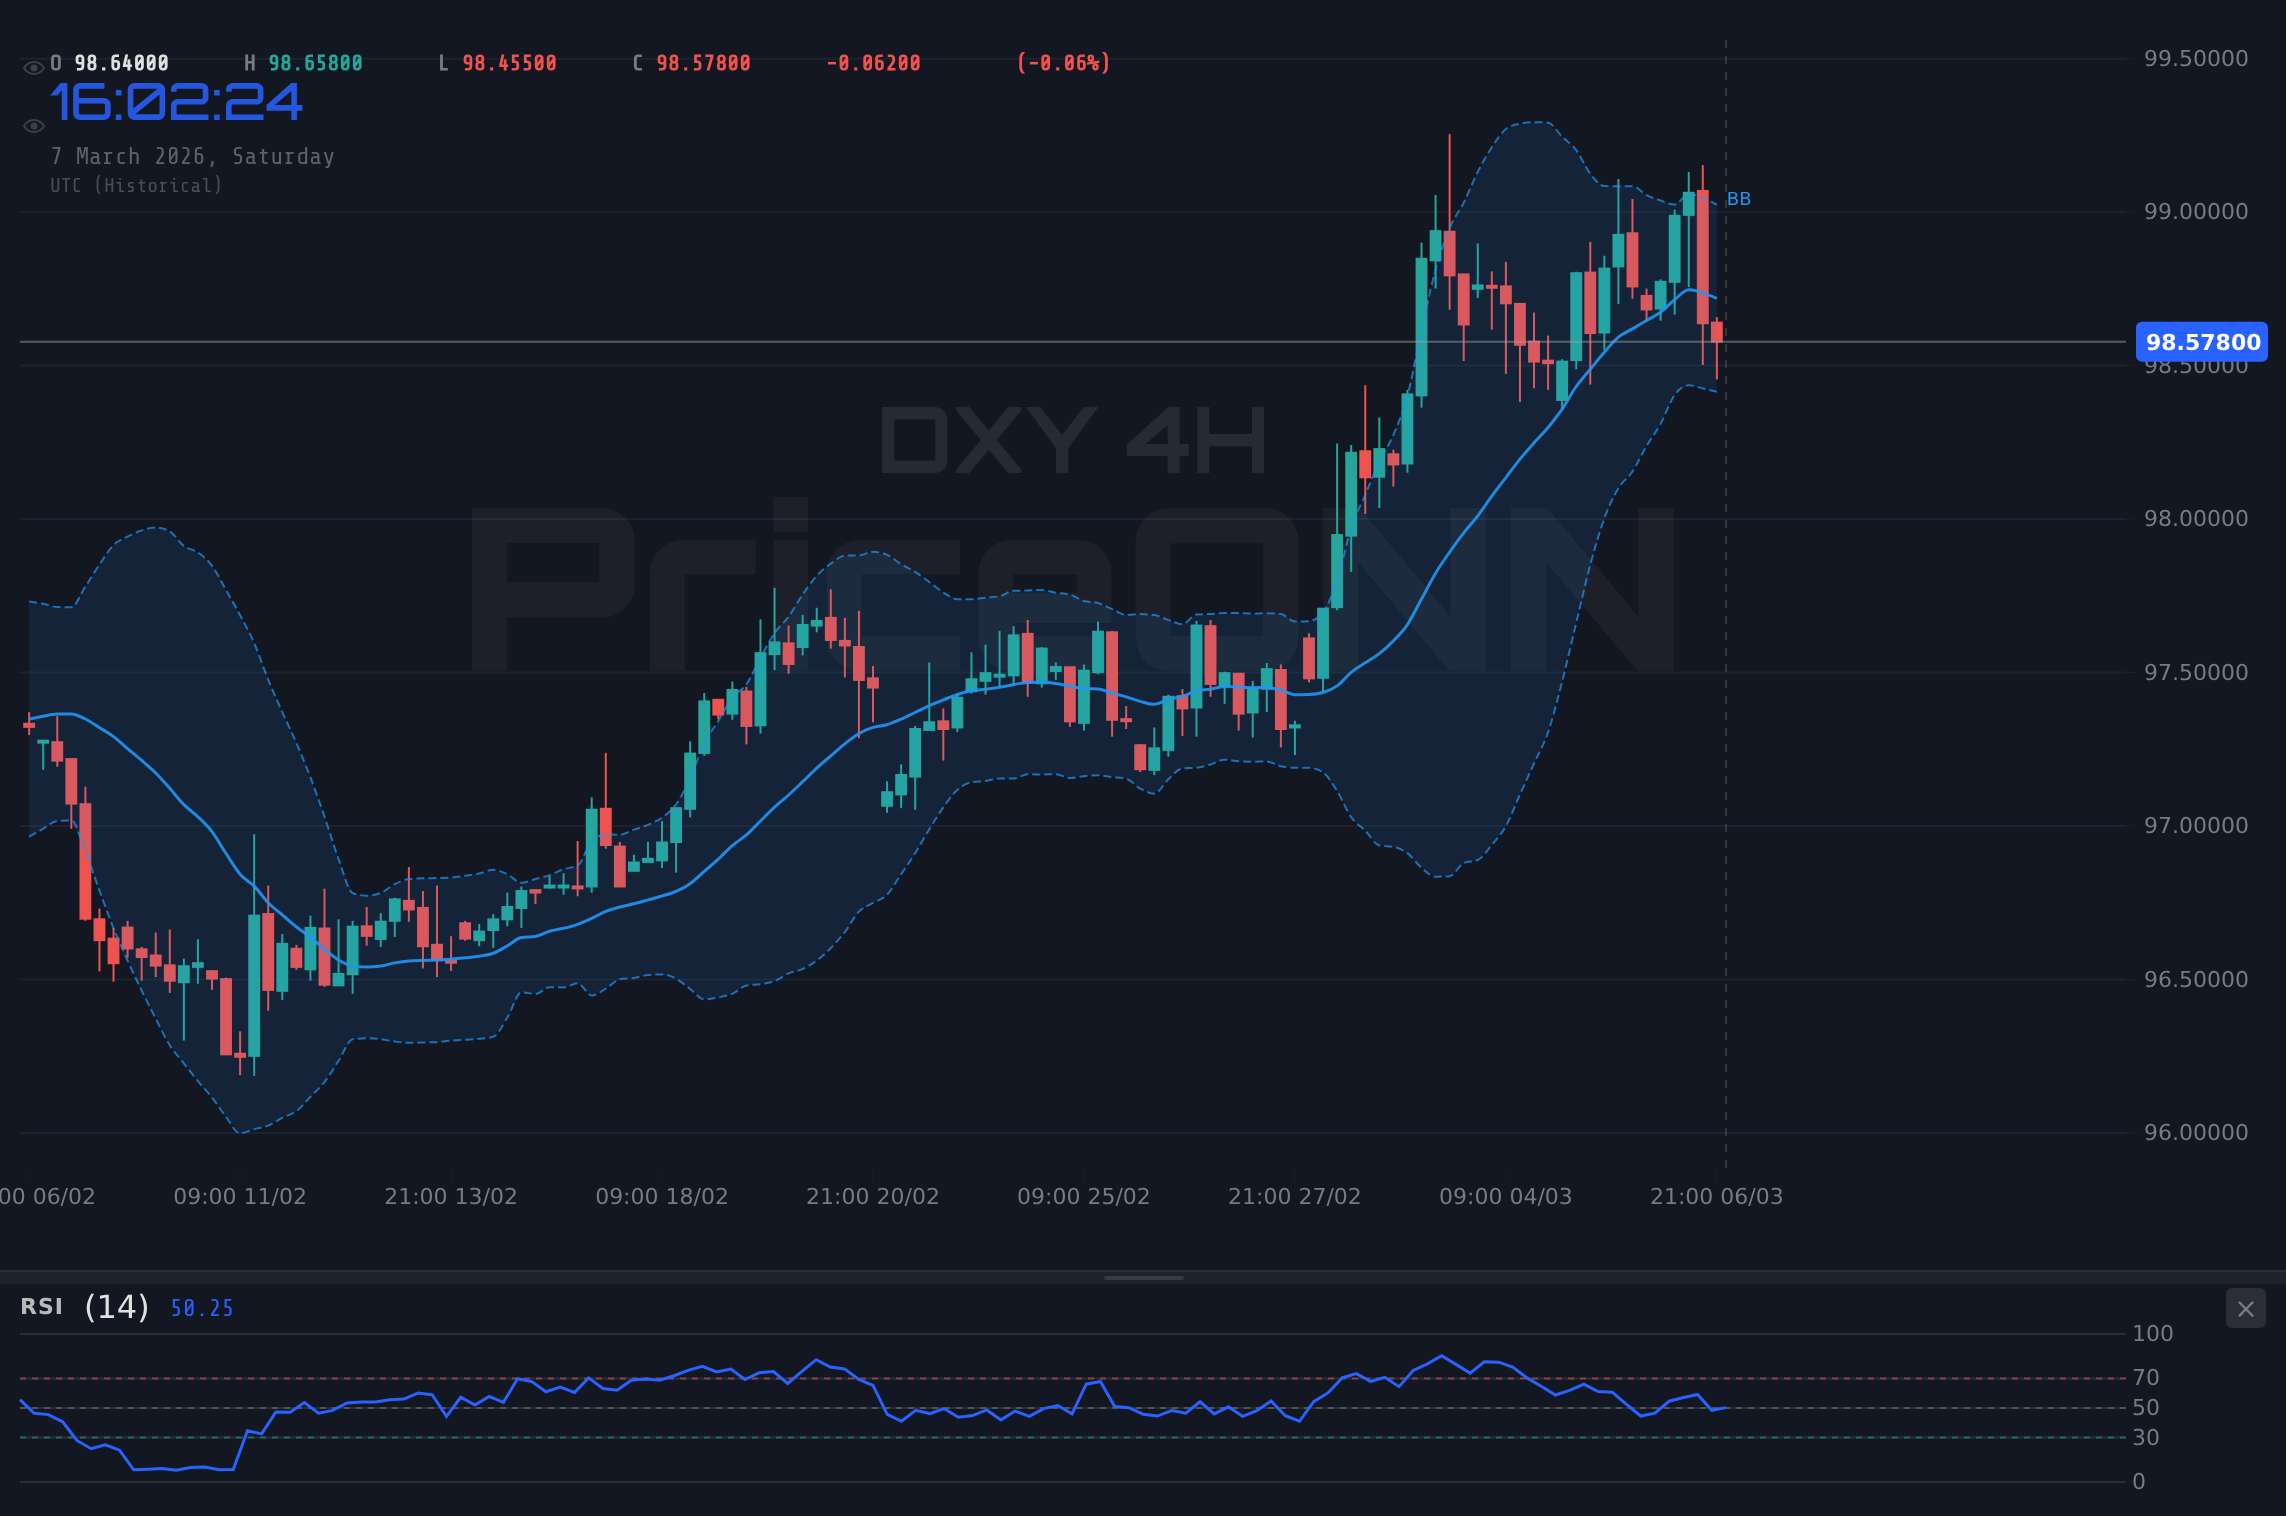
The past week has been a story of consolidation for the Dollar Index (DXY). After a period of sustained gains, the index has entered a phase of sideways trading, fluctuating within a narrow range. This indecision reflects a market grappling with conflicting signals. On one hand, geopolitical tensions and rising oil prices are typically supportive of the dollar as a safe-haven asset. On the other hand, recent economic data has painted a mixed picture, raising questions about the strength of the U.S. economy. As a result, the DXY finds itself caught between competing forces, struggling to establish a clear direction.
Why $98.70 Is the Line in the Sand
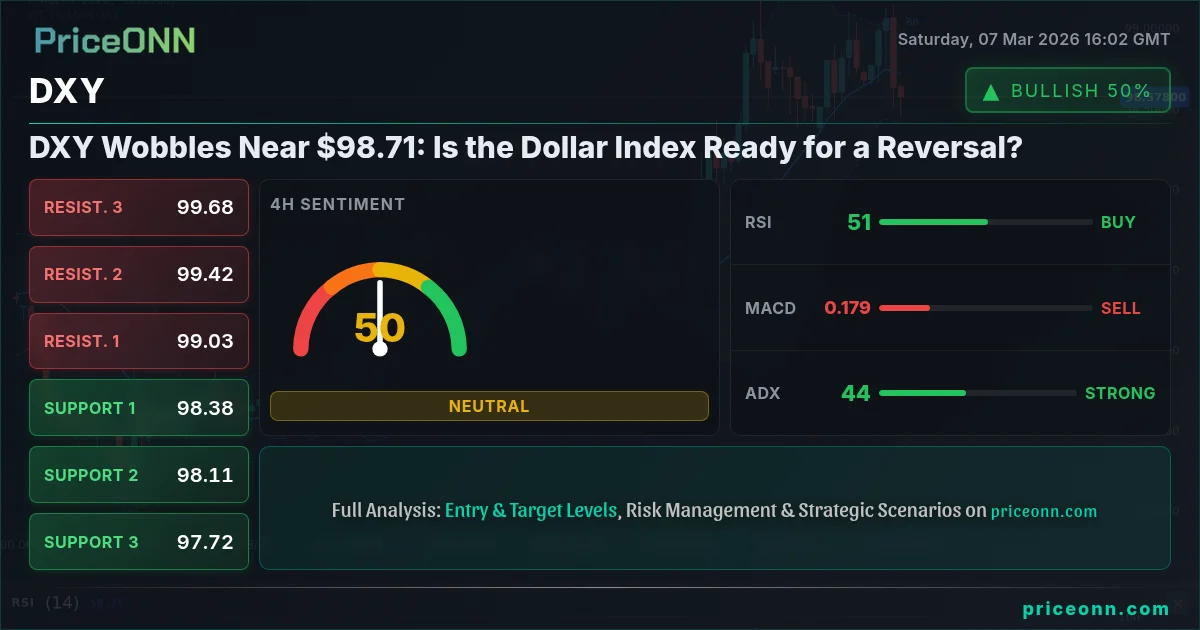
From a technical perspective, the $98.70 level is crucial. This area has acted as both support and resistance in recent weeks, highlighting its significance as a pivot point. A sustained break above this level could signal a resumption of the dollar's upward trend, while a failure to hold above it could pave the way for a deeper correction. Traders should closely monitor price action around this area for clues about the DXY's next move. The ADX indicator is sitting at 16.77, indicating a weak trend. This suggests that the market is currently lacking strong conviction in either direction.
US Labor Market Weakness Intensifies: What It Means for the Fed
Recent economic data has added to the uncertainty surrounding the dollar. The U.S. labor market showed signs of weakness in February, with nonfarm payrolls slipping by 92K, according to recent news. This disappointing jobs report has raised concerns about the pace of economic growth and could prompt the Federal Reserve to reconsider its hawkish stance. Lower-than-expected employment figures may lead the Fed to adopt a more cautious approach to raising interest rates, which could weigh on the dollar.
Crude Oil Price Surge: How Middle East Conflict Impacts DXY
Escalating tensions in the Middle East have triggered a significant surge in crude oil prices, impacting forex markets. The rise in oil prices, with Brent nearing $85 a barrel, has raised concerns that central banks may be forced to take action to combat inflation. In such an environment, the Dollar Index (DXY) often benefits from safe-haven flows. However, the strength of the dollar may be capped if the Fed adopts a more dovish stance due to concerns about economic growth. The USDJPY pair is also under scrutiny, with traders closely watching whether it will breach the 158.00 level.
Key Levels to Watch
Traders should keep a close eye on key support and resistance levels for the DXY. Immediate support can be found at 98.49, followed by 98.37 and 98.29. These levels represent areas where buying interest may emerge, potentially halting further declines. On the upside, resistance lies at 98.70, 98.78 and 98.9. A break above these levels could signal a renewed bullish bias for the dollar. The RSI(14) at 47 is in neutral territory, suggesting that the DXY could move in either direction.
Multi-Timeframe Analysis: Conflicting Signals
A multi-timeframe analysis reveals conflicting signals for the DXY. On the 1-hour chart, the trend is neutral, and the RSI is at 47. On the 4-hour chart, the trend is bullish, and the RSI is at 54.3. On the daily chart, the trend is neutral, and the RSI is at 64.71. This divergence in signals across different timeframes underscores the current uncertainty surrounding the dollar. Traders should exercise caution and wait for further confirmation before taking a directional position.
The Role of PriceONN's Analysis
PriceONN's recent analysis has highlighted the importance of upcoming jobs data for the DXY. As mentioned in the NFP Preview, jobs data is expected to drive volatility amid “Operation Epic Fury” and this has implications for DXY. PriceONN also noted that the Dollar Index (DXY) broke out amid geopolitical tensions, which is a point that has been discussed in many articles. PriceONN's technical analysis has also pointed out key levels for the DOW, TNX, DXY, CHF, Gold and WTI. These levels should be closely monitored as potential entry and exit points.
DXY and the Fed: A Delicate Balancing Act
The Federal Reserve's policy decisions will be a key driver of the DXY in the coming weeks. The market is closely watching for any signals about the Fed's next move. If the Fed signals a willingness to tolerate higher inflation in order to support economic growth, the dollar could come under pressure. Conversely, if the Fed remains committed to fighting inflation, even at the expense of slower growth, the dollar could strengthen. The CME FedWatch data will be closely monitored for changes in market expectations about the Fed's future policy path. Until the NFP data resolves the uncertainty, caution is warranted.
Trade Recommendation: Patience Pays Off
Given the conflicting signals and the high level of uncertainty, a conservative approach is warranted. Traders should avoid taking aggressive positions and instead focus on waiting for a clear signal before entering the market. Patience is likely to be rewarded in this environment. While the ADX at 44.54 indicates a strong trend on the 4H timeframe, the overall picture is still mixed, justifying a partial indicator alignment.
A sustained break above 98.78 could trigger a rally towards 98.9 and potentially 99.21, driven by safe-haven demand and continued geopolitical tensions. This scenario is contingent on strong economic data and a hawkish Fed stance.
Failure to hold above 98.49 could lead to a decline towards 98.37 and potentially 98.29, fueled by weak economic data and a dovish Fed pivot. This scenario is contingent on rising unemployment and easing inflationary pressures.
Frequently Asked Questions: DXY Analysis
Is DXY a good buy right now?
Given the current mixed signals and uncertainty, it's prudent to wait for a clearer directional signal. A sustained break above 98.78 could present a buying opportunity, while a close below 98.49 may suggest a selling opportunity.
What is the DXY price forecast for this week?
The DXY price forecast for this week is highly dependent on upcoming economic data releases. A strong jobs report could push the DXY towards 98.9, while a weak report could lead to a decline towards 98.37.
What are the key support and resistance levels for DXY?
Key support levels for DXY are 98.49, 98.37 and 98.29. Key resistance levels are 98.70, 98.78 and 98.9. These levels should be closely monitored for potential entry and exit points.
Why is DXY moving today?
DXY's movement today is primarily driven by a combination of factors, including geopolitical tensions, rising oil prices, and anticipation of upcoming economic data releases.
Having tracked DXY through the 2024 rate cycle, the current consolidation phase is not unusual. Historically, when RSI reaches this zone on DXY, the outcome has been mixed, often depending on the subsequent economic releases. The current setup is a high-probability setup (65-70%) if the breakout occurs. Until the NFP data resolves this, caution is warranted.
Track markets in real-time
AI-powered analysis, technical indicators and real-time price data.
Join Our Telegram Channel
Breaking market news, AI analysis and trading signals instantly.
Join Channel