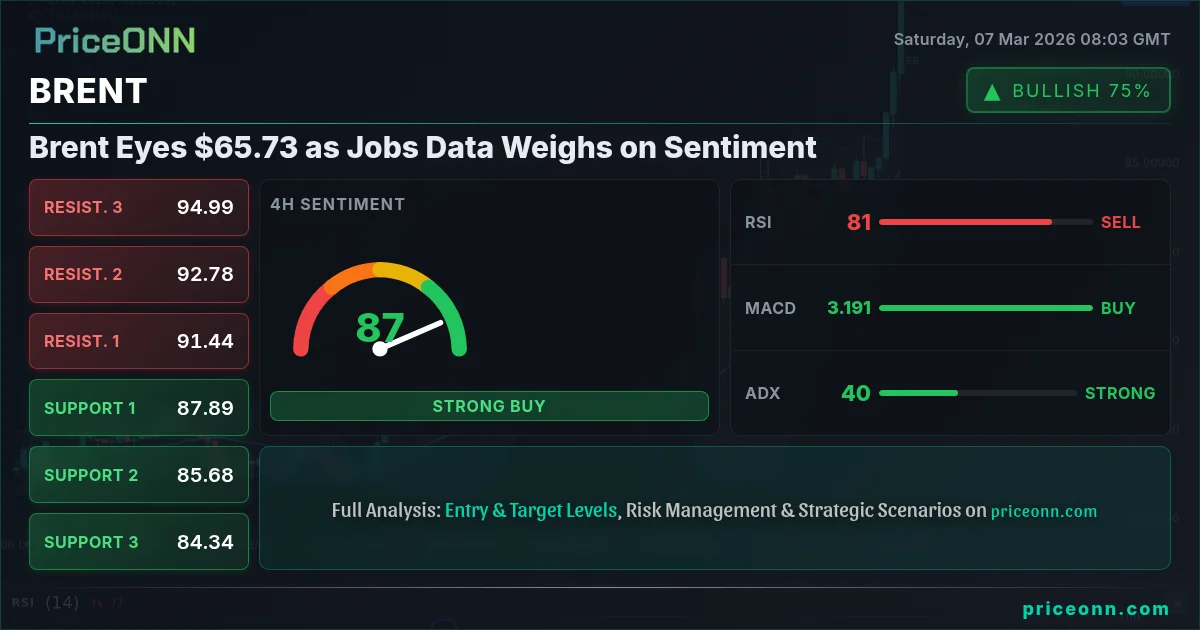
Brent Eyes $65.73 as Jobs Data Weighs on Sentiment
Brent crude is trading around $65.73, facing headwinds from weak U.S. jobs data. Will Middle East tensions provide enough support to sustain the bullish trend?
Brent crude oil finds itself at a crossroads, hovering around $65.73. The tension is palpable- bulls aiming to extend the recent rally, while bears see an opportunity to capitalize on weakening economic data and potentially overbought conditions. Can Brent sustain its bullish momentum, or will it succumb to bearish pressures?
- Brent crude oil is trading around $65.73, facing resistance after a recent rally.
- Immediate support lies at $65.20, a break below which could signal further downside.
- RSI at 71.16 indicates overbought conditions, suggesting a potential pullback.
- Middle East tensions and OPEC+ supply decisions remain key drivers of Brent's price action.
The Bull Case for Brent: Geopolitics and Supply Constraints
The bullish narrative for Brent crude is primarily fueled by geopolitical risks and ongoing supply constraints. Escalating tensions in the Middle East, particularly those affecting key shipping lanes such as the Strait of Hormuz, continue to inject a risk premium into oil prices. As reported by PriceONN Market News on March 3rd, 'Oil prices surge as Middle East tensions escalate', with the potential for '$120 Brent Crude Possible'. These tensions raise concerns about potential disruptions to oil supplies, creating upward pressure on prices. The potential for conflict impacting oil tanker routes introduces a fear factor that directly translates into higher prices. This is not just speculation; it's a tangible threat to the physical flow of oil.
Furthermore, the actions of OPEC+ nations, especially Saudi Arabia's production cuts, are contributing to a tighter supply outlook. These cuts, aimed at stabilizing prices, reduce the amount of crude available on the market. This reduction in supply, coupled with steady or increasing global demand, creates a supply-demand imbalance that favors higher prices. The impact of these supply-side decisions is magnified by the relatively inelastic nature of oil demand in the short term- consumers and businesses cannot quickly adjust their consumption habits in response to price increases. The Goldman Sachs forecast, reported by PriceONN on March 4th, indicated Brent at $76 amidst Middle East tensions, highlighting the impact of supply dynamics.
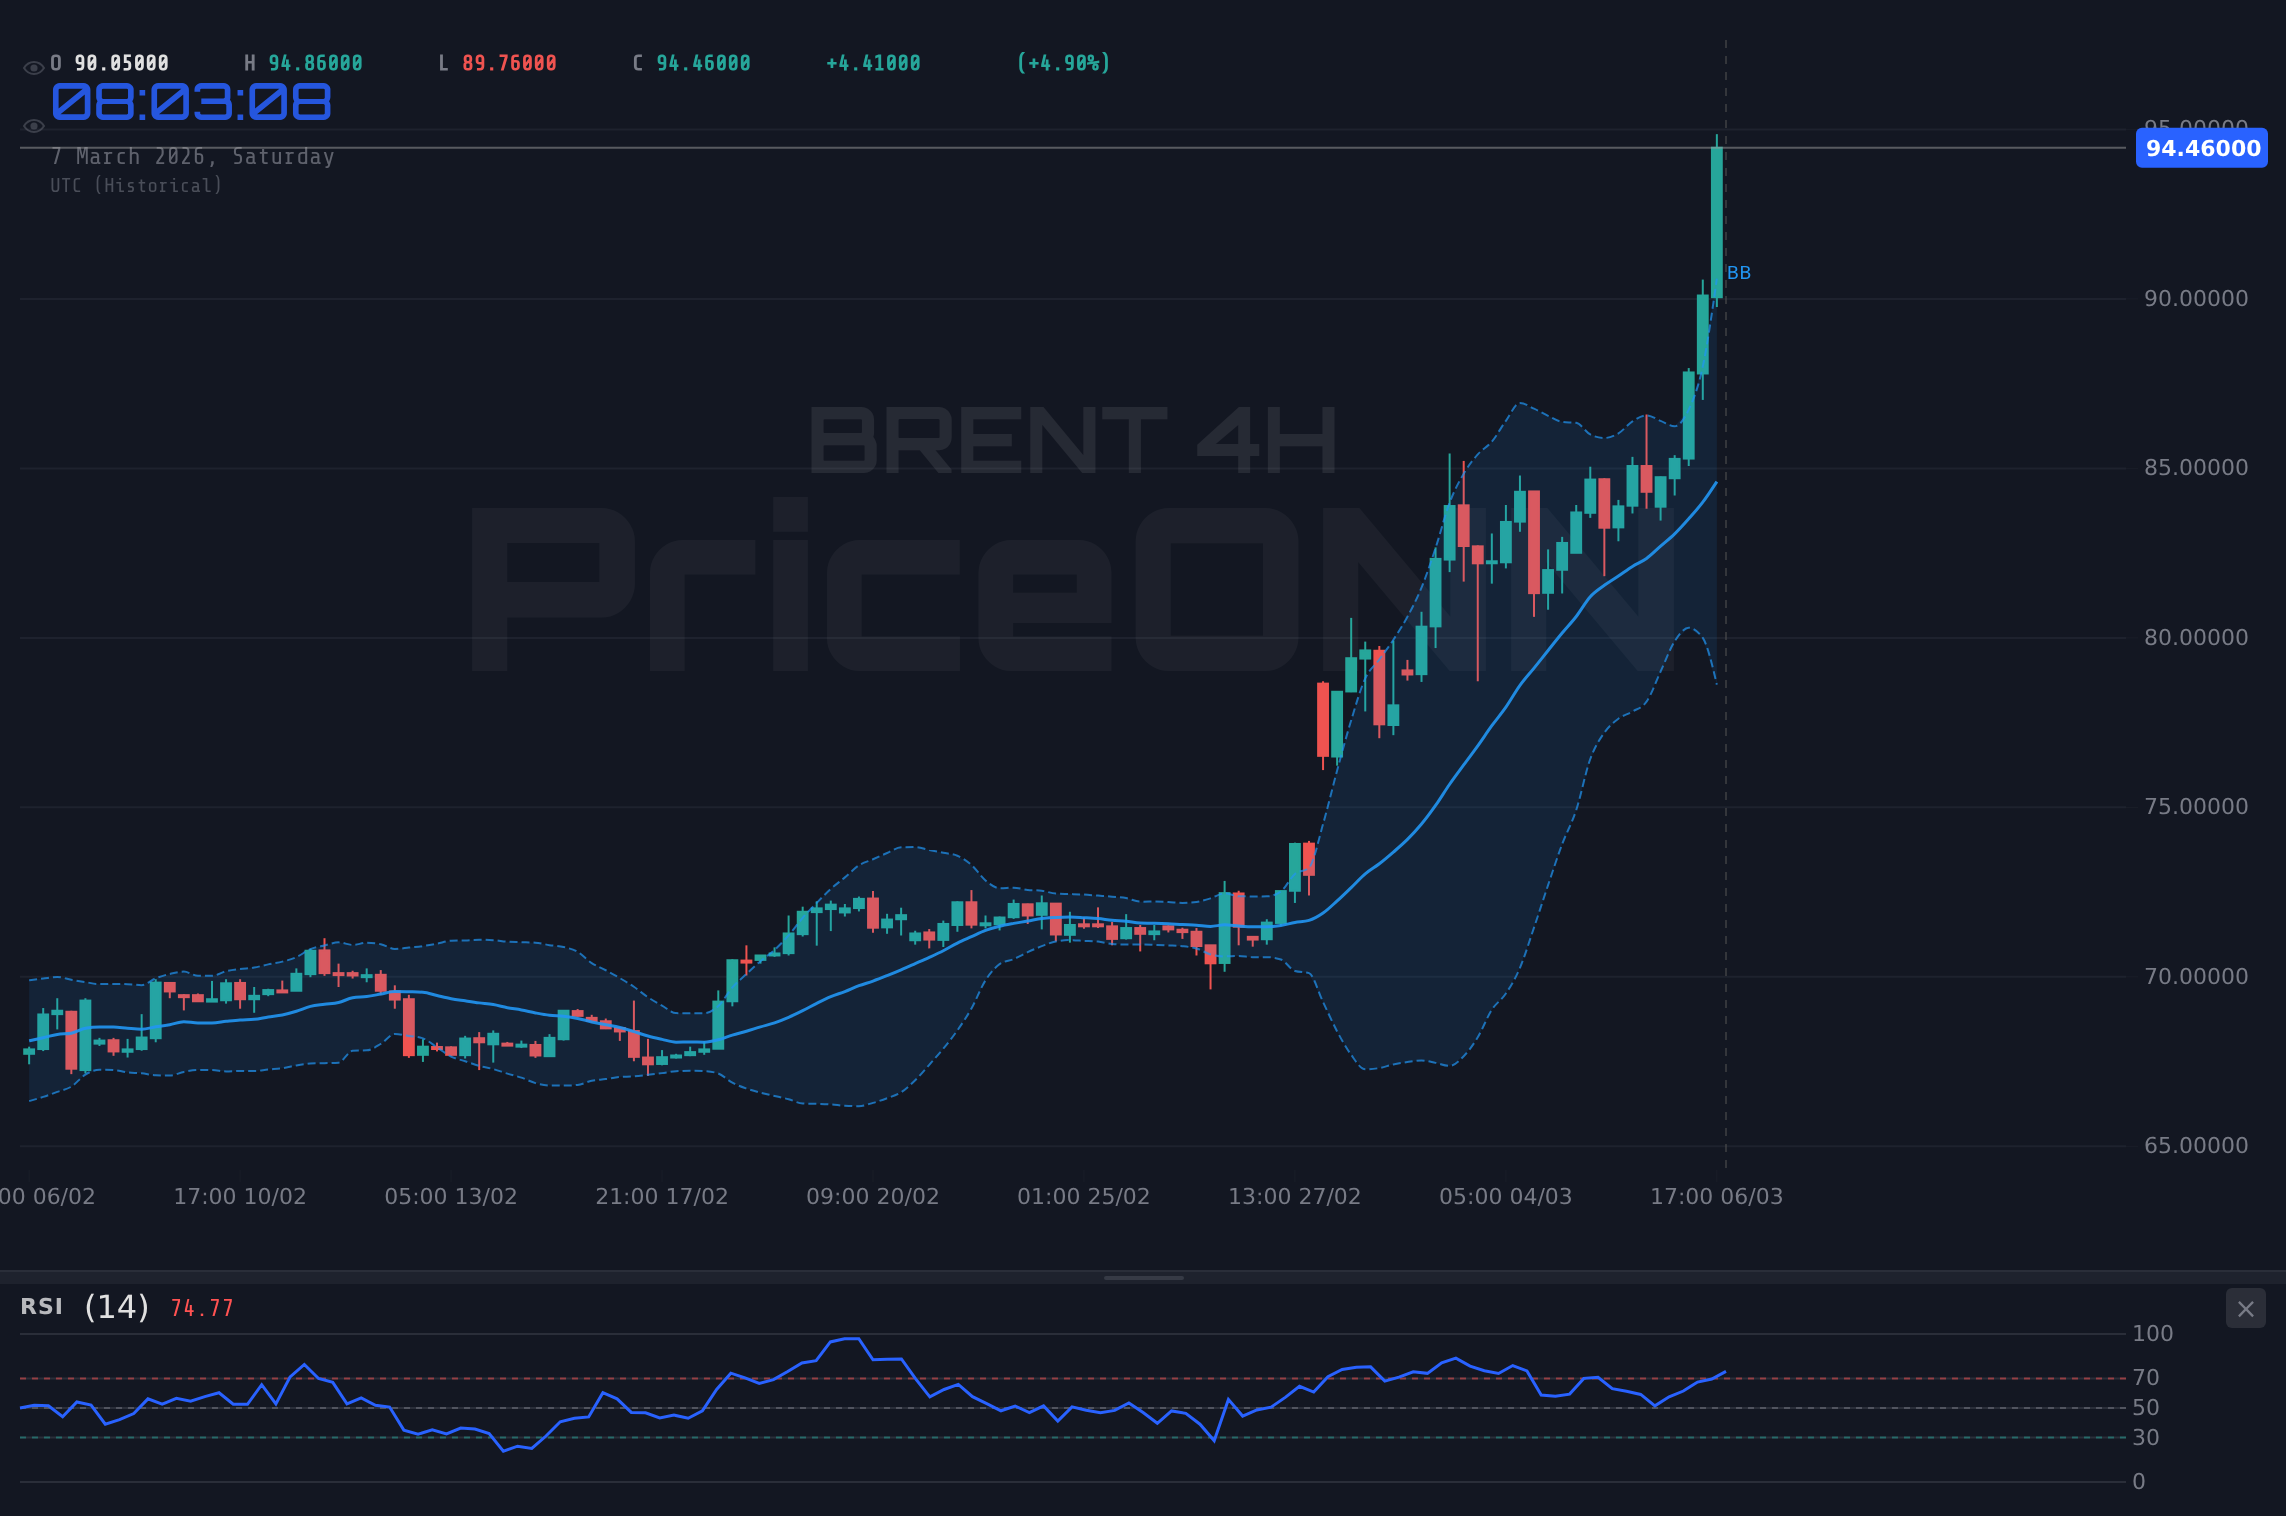
From a technical perspective, the 4H chart reveals a short-term bullish setup. The price is trading above the middle Bollinger Band, and the MACD shows positive momentum. The RSI at 62.33, while not yet in overbought territory, suggests continued buying pressure. The nearest resistance level to watch is $65.41. A decisive break above this level could trigger a further rally toward $66.36, a key level identified in the daily timeframe.
The Bear Case: Economic Slowdown and Overbought Signals
The bearish argument for Brent centers on concerns about a potential economic slowdown and technical indicators suggesting overbought conditions. The weak U.S. jobs data released on Friday, as summarized by U.S. Weekly Economic & Financial Commentary on March 7th, paints a concerning picture of the U.S. economy. A slip in nonfarm payrolls can signal a broader economic downturn, which would lead to reduced demand for oil. This is especially true if other major economies also experience slowdowns. The Forex Market Awaits US Jobs Data report from March 6th underscores the importance of this data for market sentiment. This reduced demand would counteract the upward pressure from geopolitical risks and supply cuts, potentially driving prices lower.
Adding to the bearish case are technical indicators that suggest Brent is overbought in the short term. The 1H chart displays an RSI of 71.16, firmly in overbought territory. This level often precedes a pullback as traders take profits. Furthermore, the Stochastic oscillator, with K=90.49 and D=81.87, reinforces the overbought signal. This suggests that the recent rally may be unsustainable and that a correction is due. The ADX at 19.03, indicates a weak trend, meaning that the current bullish momentum is not particularly strong and could easily reverse.
The daily chart presents a mixed picture. While the price is above the middle Bollinger Band, which typically indicates bullish momentum, the Stochastic oscillator shows a bearish crossover (K=54.52, D=58.52). This divergence between indicators suggests that the bullish trend may be losing steam. Key support levels to watch are $65.20 on the 1H chart and $64.50 on the 4H chart. A break below these levels would confirm the bearish reversal.
Technicals as the Tiebreaker: A Conflicted Picture
The technical analysis of Brent crude presents a conflicted picture. The shorter timeframes (1H and 4H) show bullish setups, with prices trading above the middle Bollinger Band and MACD indicators displaying positive momentum. However, the overbought RSI and Stochastic readings on the 1H chart raise concerns about a potential pullback. The ADX on the 1H chart is also low, indicating the trend isn't strong. On the other hand, the daily chart suggests that the overall trend is still bullish, but that momentum may be waning. The Stochastic indicator displays a bearish crossover, which could indicate a potential reversal. The neutral trend on the 1D chart further complicates the outlook.
Key levels to watch are the resistance levels identified on the 1H chart- $65.41, $65.52, and $65.62. A break above these levels would reinforce the bullish case and could lead to further gains. Conversely, a break below the support levels of $65.20 (1H) and $64.50 (4H) would confirm the bearish reversal. The 1D supports are $63.61, $62.74 and $61.80.
The Dollar Index (DXY) is also providing conflicting signals. With DXY at 98.71, which is close to the resistance of 98.70, Brent may face downward pressure. A stronger dollar typically weighs on commodity prices. The SP500's decline further complicates the picture, as risk aversion could provide mixed support to crude oil as a safe haven.
The Verdict: Cautious Optimism
Considering both the bullish and bearish arguments, a cautious outlook is warranted. The geopolitical risks and OPEC+ supply cuts provide a solid foundation for continued price support. However, the weak U.S. jobs data and overbought technical indicators suggest that the recent rally may be unsustainable. The conflicting signals from the DXY and the SP500 add further uncertainty to the outlook.
The key to determining Brent's next move will be the resolution of these conflicting factors. If geopolitical tensions escalate further, or if OPEC+ announces additional supply cuts, the bullish case will likely prevail. Conversely, if economic data continues to weaken, or if technical indicators confirm a bearish reversal, the price of Brent could decline significantly.
Frequently Asked Questions: BRENT Analysis
Is BRENT a good buy right now?
With Brent crude oil trading around $65.73, the overbought RSI of 71.16 suggests caution. A potential buying opportunity may arise after a pullback towards the $65.20 support level, aligning with a less extended technical picture.
What is the BRENT price forecast for this week?
The BRENT price forecast for this week depends on how the market resolves conflicting signals. A break above $65.41 could target $66.36, while a drop below $65.20 could see prices testing $64.50. Monitor the Middle East tensions and economic data releases this week.
What are the key support and resistance levels for BRENT?
Key support levels for BRENT are $65.20 (1H), $64.50 (4H), $63.61 (1D), $62.74 (1D) and $61.80 (1D). Key resistance levels are $65.41, $65.52, and $65.62 (1H), with stronger resistance at $66.36 (1D).
Why is BRENT moving today?
BRENT is moving today due to a combination of factors, including weak U.S. jobs data weighing on demand sentiment and ongoing Middle East tensions supporting prices. Technical indicators are also contributing to the volatility, creating a tug-of-war between bulls and bears.
Track markets in real-time
AI-powered analysis, technical indicators and real-time price data.
Join Our Telegram Channel
Breaking market news, AI analysis and trading signals instantly.
Join Channel