
Brent Crude Tests $102.64 Support Amid Powell Speech and OPEC Output Drop
Brent Crude at $102.64 faces key support as OPEC production plummets and traders await Powell's speech. Technicals show a weak trend, demanding caution.
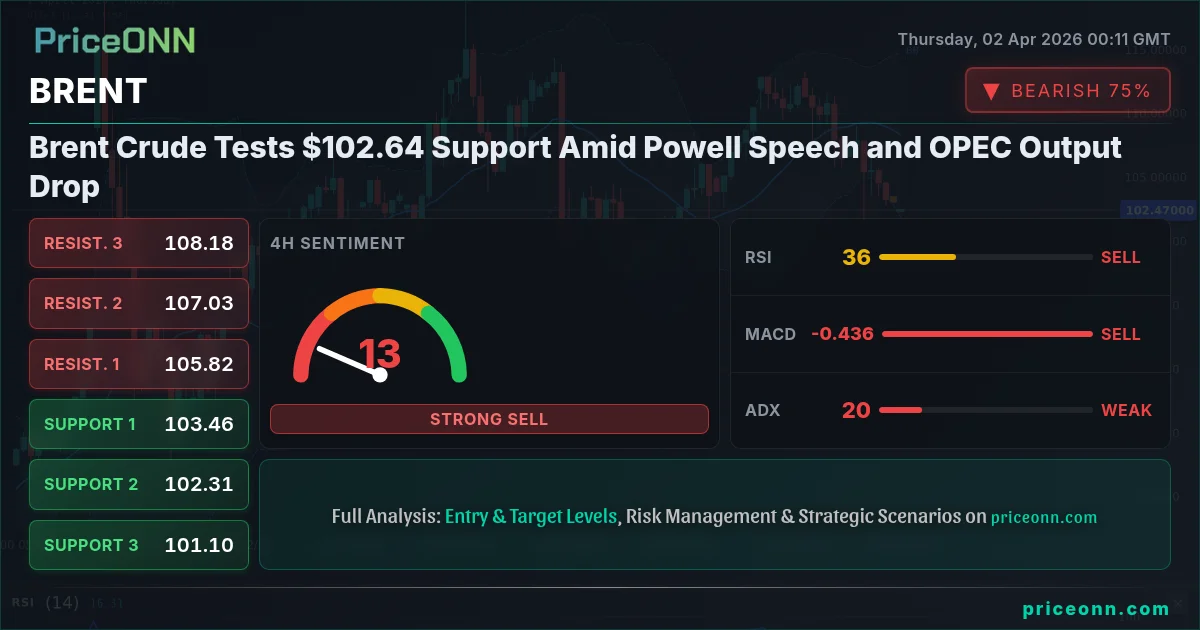
The global oil market is at a critical juncture as Brent Crude hovers around $102.64. This price point is more than just a number; it represents a confluence of geopolitical tensions, shifting OPEC strategies, and crucial central bank commentary. With OPEC production hitting multi-year lows and Federal Reserve Chair Powell's upcoming speech on the economic outlook, traders are navigating a complex landscape. The current technical indicators on Brent suggest a market in flux, demanding a nuanced approach rather than a blind directional bet. Understanding the interplay between these fundamental drivers and the nuanced technical signals is paramount for anyone looking to navigate this volatile commodity.
- Brent Crude is currently trading at $102.64, testing key support levels.
- OPEC production has plummeted to its lowest point since June 2020, impacting supply dynamics.
- Federal Reserve Chair Powell's upcoming speech is a major event risk for oil markets and the broader economy.
- Technical indicators on the 1H and 4H charts show conflicting signals, while the 1D trend remains indecisive, suggesting a 'WATCH_ZONE' scenario.
The recent sharp decline in OPEC production, reportedly down 7.2 million barrels per day in March, is a significant development that cannot be ignored. This drastic cut, the lowest since June 2020, injects a potent bullish undercurrent into the oil market, ostensibly driven by escalating geopolitical tensions. While the exact motivations behind such a steep reduction are complex, involving supply security and market management, the immediate effect is a tightening of global crude supplies. This supply shock, particularly in an environment already sensitive to geopolitical risks, typically translates into upward price pressure. However, the market's reaction has been muted, with Brent Crude currently testing support rather than rallying strongly. This suggests that other factors, such as demand concerns or a broader risk-off sentiment, are currently counterbalancing the supply-side shock.
Adding another layer of complexity is the anticipation surrounding Federal Reserve Chair Jerome Powell's upcoming speech. In an environment where inflation remains a persistent concern, Powell's words will be closely scrutinized for any hints about the future path of monetary policy. Any indication of a more hawkish stance could dampen economic growth expectations, thereby reducing future oil demand and capping potential price rallies. Conversely, a more dovish tone might offer some support to risk assets, including oil, by signaling a potential pause or shift in tightening cycles. The correlation between oil prices and broader economic health is undeniable; a slowdown in global growth directly impacts energy consumption. Therefore, Powell's commentary is not just a monetary policy event but a crucial determinant of the demand-side equation for commodities like Brent.
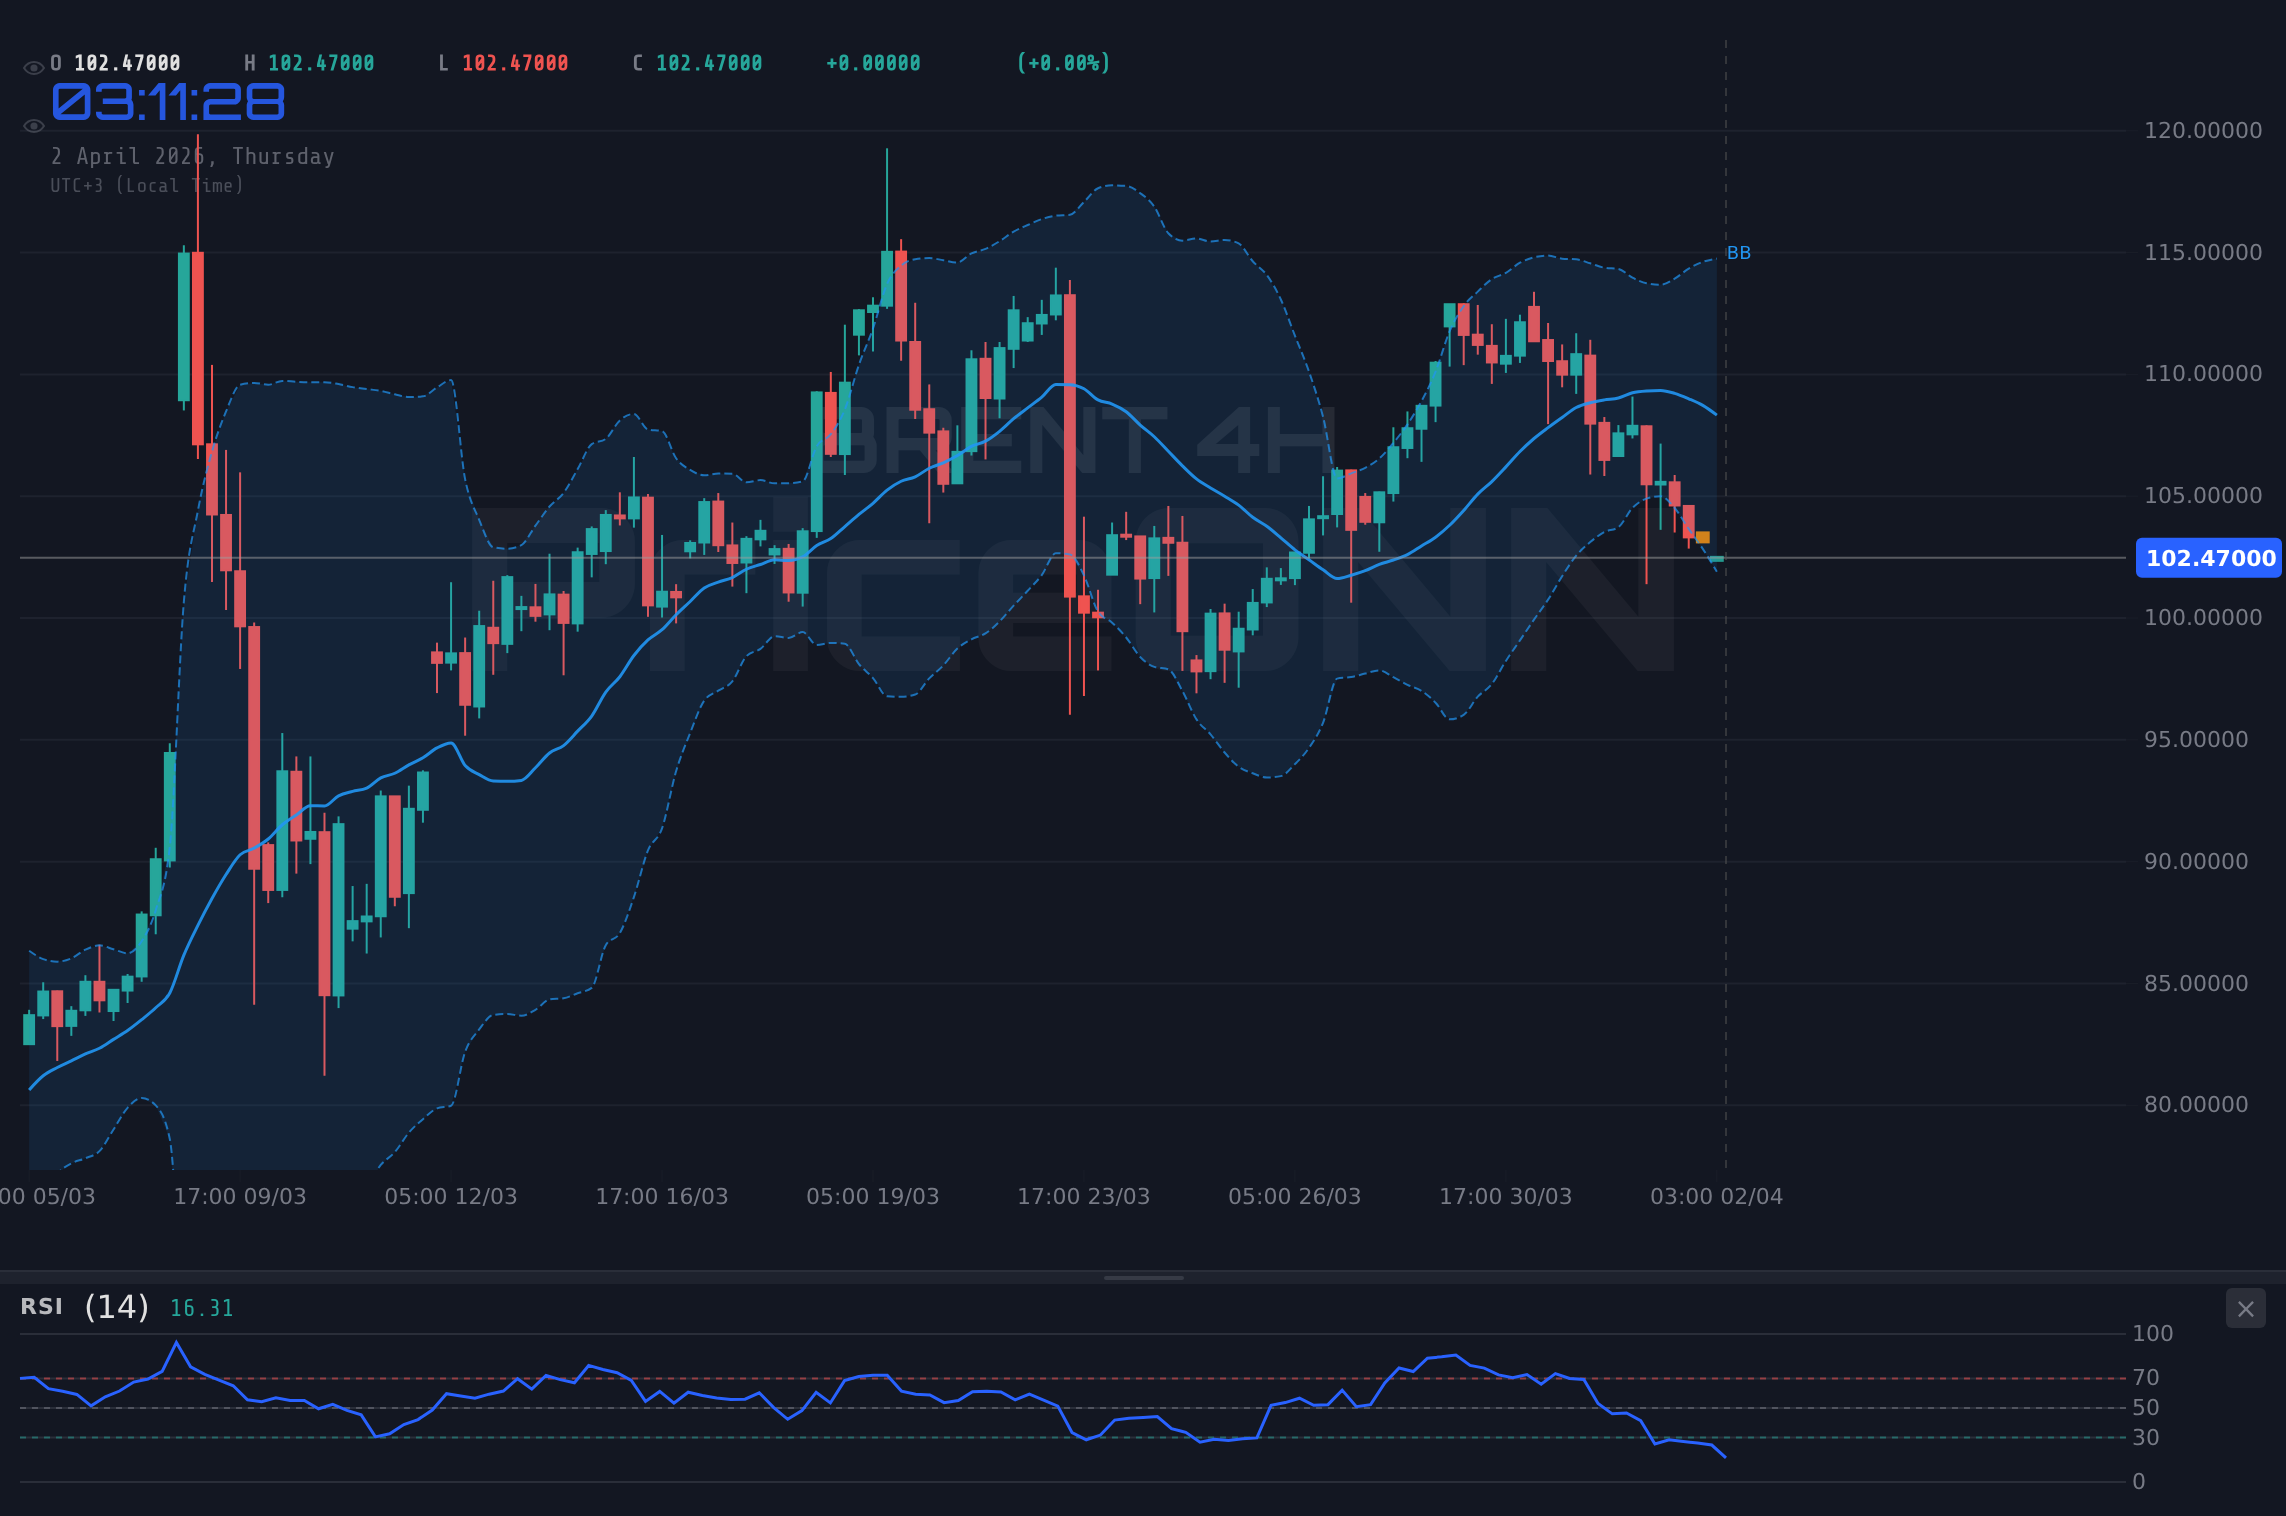
Why Brent Volatility Analysis Points to a Breakout Threshold
Examining the technical landscape for Brent Crude reveals a market at a delicate balance point. On the 1-hour chart, the trend is technically bullish with a strength of 100%, showing an ADX of 48.83, indicating a strong trend. However, the RSI is at 66.79, hovering in neutral territory but with an upward inclination, suggesting room for further upside but also caution. The MACD, while showing negative momentum on this timeframe, is a point of contention. The Stochastic Oscillator, with K at 73.5 and D at 70.44, signals a potential upward move, but the overall signal aggregate leans towards 'BUY' (7 Buys, 1 Sell). This mixed picture on the shortest timeframe suggests short-term traders might find opportunities, but the conviction is not overwhelming.
Diving into the 4-hour timeframe, the bullish trend remains strong (100% strength) with an ADX of 27.38, still indicative of a solid trend. The RSI here is 70.74, entering the overbought territory, which traditionally signals a potential for pullbacks or consolidation as buyers might pause to take profits. The MACD shows positive momentum, with the histogram above the signal line, reinforcing the bullish bias seen on the 1H chart. The Stochastic Oscillator is in extreme overbought territory (K=93.95, D=90.3), strongly suggesting that a reversal or at least a pause is imminent. Despite these overbought conditions, the overall signal leans 'BUY' (5 Buys, 3 Sells), reflecting the persistent strength in the trend despite short-term exhaustion signals.
The daily chart presents a more neutral picture, with trend strength at 50%. The ADX reading of 31.99, however, still points to a strong trend, albeit in a potentially weakening fashion or transitioning. The RSI is almost perfectly balanced at 50.29, indicating a lack of clear directional bias from this momentum indicator. The MACD is in negative momentum, and the Bollinger Bands are below the middle band, suggesting a bearish inclination on this longer timeframe. The Stochastic Oscillator shows a bullish signal (K=72.87, D=45.08), creating a divergence with the MACD and Bollinger Bands. This conflict across different timeframes and indicators is precisely why the market is in a 'WATCH_ZONE'. The ADX, despite its varying values across timeframes, consistently shows a strong trending market, which can be dangerous for mean-reversion strategies but presents opportunities for trend-followers if a clear direction re-emerges.
Navigating the Uncertainty: Key Levels and Scenarios for Brent Crude
Given the conflicting signals and the critical juncture Brent Crude finds itself in, defining key levels is essential. On the 1-hour chart, immediate support is seen at $4758.39, with further levels at $4740.38 and $4728.36. Resistance is nearby at $4788.42, followed by $4800.44 and $4818.45. The 4-hour chart provides broader support at $4739.07, $4690.8, and $4665.05, with resistance extending to $4813.09, $4838.84, and $4887.11. The daily chart's support levels are significantly lower, starting at $4537.34, $4407.84, and $4333.07, while resistance is at $4741.61, $4816.38, and $4945.88. These levels are crucial; a break below the immediate 1H support could signal a short-term pullback, while a sustained move above the 4H resistance might reignite a stronger bullish impulse.
The current ADX values present an interesting dichotomy. On the 1H chart, ADX at 48.83 screams 'strong trend', yet the price is hovering near support. On the 4H, ADX at 27.38 still indicates a strong trend, but the RSI and Stochastic are flashing overbought warnings. The daily ADX at 31.99 also suggests a strong trend, but the RSI is neutral and MACD is negative. This divergence suggests that while a trend may exist on shorter timeframes, the conviction is waning or facing significant headwinds, particularly from the demand side and potential policy shifts.
The 'WATCH_ZONE' decision is primarily driven by the ADX readings across timeframes. While shorter timeframes show strong trend strength, the daily chart's ADX, coupled with the neutral RSI and negative MACD, indicates that the longer-term picture is less clear. The market is clearly in a tug-of-war between the bullish supply shock from OPEC and potential bearish demand destruction from higher prices, geopolitical easing (e.g., Iran ceasefire talks mentioned in recent news), and hawkish central bank rhetoric. A daily close above the $4800.44 resistance level on the 1H chart would be needed to signal a continuation of the immediate bullish momentum, whereas a decisive break below the $4758.39 support could trigger a more significant correction.
The recent news flow also plays a critical role. The mention of Iran ceasefire talks, if they materialize, could ease geopolitical tensions in the Middle East, potentially removing a significant bullish catalyst for oil prices. Similarly, the significant drop in OPEC output, while bullish on the surface, could also be interpreted as a sign of concern over future demand, prompting a proactive measure to support prices. This ambiguity means that traders should exercise extreme caution. The market sentiment analysis, often a leading indicator, is currently mixed, reflecting this uncertainty. The DXY's recent dip below 100.00, as reported, could offer some support to commodities like Brent, but the overall trend of the dollar and its correlation with risk appetite will be heavily influenced by Powell's speech.
Trade Scenarios for Brent Crude: Navigating the Crossroads
Considering the technical and fundamental crosscurrents, three primary scenarios emerge for Brent Crude. The bearish scenario hinges on demand-side weakness and easing geopolitical fears. Should Powell adopt a hawkish tone, or should news of de-escalation in the Middle East gain traction, coupled with signs of slowing global growth, we could see Brent fall. The trigger for this scenario would be a decisive break below the immediate 1-hour support at $4758.39. Invalidation would occur if price closes back above the 4-hour resistance at $4813.09. The first target would be the 4-hour support at $4739.07, with a secondary target at the daily support level of $4537.34. This scenario carries a probability of 35%, reflecting the bearish undertones from potential demand destruction and the overbought signals on shorter timeframes.
Conversely, the bullish scenario anticipates that the OPEC production cuts and persistent geopolitical risks will outweigh demand concerns, at least in the short term. If Powell's speech is perceived as dovish, or if Middle East tensions flare up again, Brent could find renewed strength. The trigger for this scenario would be a sustained break and hold above the 1-hour resistance at $4788.42, ideally followed by a push above the 4-hour resistance at $4813.09. Invalidation would occur on a close below the 1-hour support at $4758.39. The first target would be the 4-hour resistance at $4813.09, with a secondary target at the daily resistance level of $4945.88. This scenario is assigned a 45% probability, acknowledging the significant supply-side bullish factor from OPEC cuts and the strong trend signals on shorter timeframes, despite the overbought indicators.
The neutral or consolidation scenario accounts for the market's indecision, where neither the bullish supply shock nor the bearish demand concerns fully dominate. This could play out if Powell's speech is ambiguous, or if geopolitical news remains mixed. In this case, Brent Crude might trade sideways, oscillating between the immediate support and resistance levels. The trigger for this scenario is the failure of either the bullish or bearish scenario to materialize, leading to price action within the established range. Invalidation would occur on a clear break above $4813.09 or below $4758.39. Targets would be the immediate support ($4758.39) and resistance ($4788.42) levels. This scenario is given a 20% probability, reflecting the potential for indecision in the immediate aftermath of major events.
The market's current state, with an ADX of 19.72 on the 4H chart and 31.99 on the 1D chart, suggests a trend that is either developing or consolidating. A weak ADX reading like 19.72 typically implies choppy, ranging conditions, making it risky for breakout strategies. However, the higher ADX on the 1H (48.83) and 4H (27.38) charts suggests that short-term trends are present, even if the longer-term picture is less defined. This is why a 'WATCH_ZONE' approach is recommended. A clear directional signal is needed. For instance, a daily close above the $4800.44 resistance level would be a strong bullish confirmation, while a break below the $4758.39 support would be a bearish signal, especially if accompanied by a rise in DXY and cautious tones from Powell.
The Path Forward: What to Watch in Brent Crude
The path forward for Brent Crude is heavily contingent on upcoming economic data and geopolitical developments. The OPEC production cuts are a significant bullish factor, but their long-term impact will depend on global demand. Powell's speech is the immediate focal point; any hint of sustained inflation could lead to higher interest rates, dampening economic activity and oil demand. Conversely, a signal that the Fed is nearing policy easing could boost risk appetite and support oil prices. Traders should closely monitor the correlation between Brent, the DXY, and equity indices like the S&P 500. A rising DXY and falling S&P 500 would typically weigh on Brent, while a weakening dollar and resilient equities could provide a tailwind.
The technical setup, particularly the conflicting signals across different timeframes, underscores the need for patience. The strong ADX readings on shorter timeframes suggest trends can emerge quickly, but the overbought Stochastic on the 4H and the neutral RSI on the daily chart indicate that current price levels may not be sustainable without fresh catalysts. Therefore, waiting for a clear break of key levels - either resistance at $4813.09 on the 4H chart or support at $4758.39 on the 1H chart - would provide a more defined trading setup. The 'brent prognose' search query, currently showing rising interest, indicates that traders are actively seeking direction, highlighting the market's anticipation.
Ultimately, the current environment demands a risk-managed approach. The 'brent price forecast' remains uncertain, caught between supply-side bullishness and demand-side risks. The technical analysis, showing a strong trend on shorter timeframes but indecision on the daily, reinforces this caution. Focus on price action around the key support at $4758.39 and resistance at $4813.09. Confirmation from broader market indicators, such as the DXY's direction and Powell's commentary, will be crucial in determining the next significant move. Patience and disciplined execution will be key as the market digests these competing forces.
Frequently Asked Questions: BRENT Analysis
What happens if Brent Crude breaks below the $4758.39 support level amid Powell's speech?
A break below $4758.39 on the 1H chart would invalidate the immediate bullish momentum, potentially triggering a move towards the next support at $4739.07. This would be amplified if Powell adopts a hawkish tone, signaling concerns about inflation and potentially weaker future demand.
Should I buy Brent Crude at current levels of $102.64 given the OPEC output cuts?
Buying at current levels carries risk due to overbought indicators on shorter timeframes and the uncertainty surrounding Powell's speech. A more prudent approach would be to wait for confirmation, such as a sustained break above $4788.42 resistance, or a clear bullish signal after Powell's remarks, and manage risk tightly.
Is the RSI at 66.79 on the 1H chart a sell signal for Brent Crude?
An RSI of 66.79 is in the upper neutral zone, indicating upward momentum but not yet extreme overbought conditions. While it suggests caution, it's not a direct sell signal on its own, especially with the strong ADX. A confirmed overbought signal, like RSI above 70 coupled with bearish divergence or a Stochastic crossover, would be more conclusive.
How will the OPEC production cuts affect Brent Crude prices this week?
The significant OPEC production cuts are a strong bullish factor, aiming to tighten supply. However, their impact this week will likely be moderated by demand-side concerns, geopolitical easing, and central bank policy signals. If demand remains robust and geopolitical risks persist, the cuts could push Brent towards the $4813.09 resistance level.
Bearish Scenario: Demand Destruction Fears Prevail
35% ProbabilityBullish Scenario: Supply Shock Dominates
45% ProbabilityNeutral Scenario: Consolidation Amid Uncertainty
20% ProbabilityTechnical Outlook Summary
| Indicator | Value | Signal | Interpretation |
|---|---|---|---|
| RSI (14) | 66.79 | Neutral | Approaching overbought on 1H, neutral on 1D |
| MACD Histogram | -ve | Bearish | Negative momentum on 1H, reinforcing caution |
| Stochastic | K=73.5, D=70.44 | Bullish | Rising on 1H, overbought on 4H - conflicting |
| ADX | 48.83 | Strong Trend | Indicates strong trend on 1H, but mixed across timeframes |
| Bollinger Bands | Mid Band Break | Watch | Above mid band on 1H/4H, below on 1D |
Track markets in real-time
AI-powered analysis, technical indicators and real-time price data.
Join Our Telegram Channel
Breaking market news, AI analysis and trading signals instantly.
Join Channel