Brent Crude Tests $105.01 Resistance: Will $105.72 Be Next?
Brent Crude hovers around $105.01 as geopolitical tensions and supply concerns fuel a cautious rally. Key levels are being tested as traders eye potential moves towards $105.72.
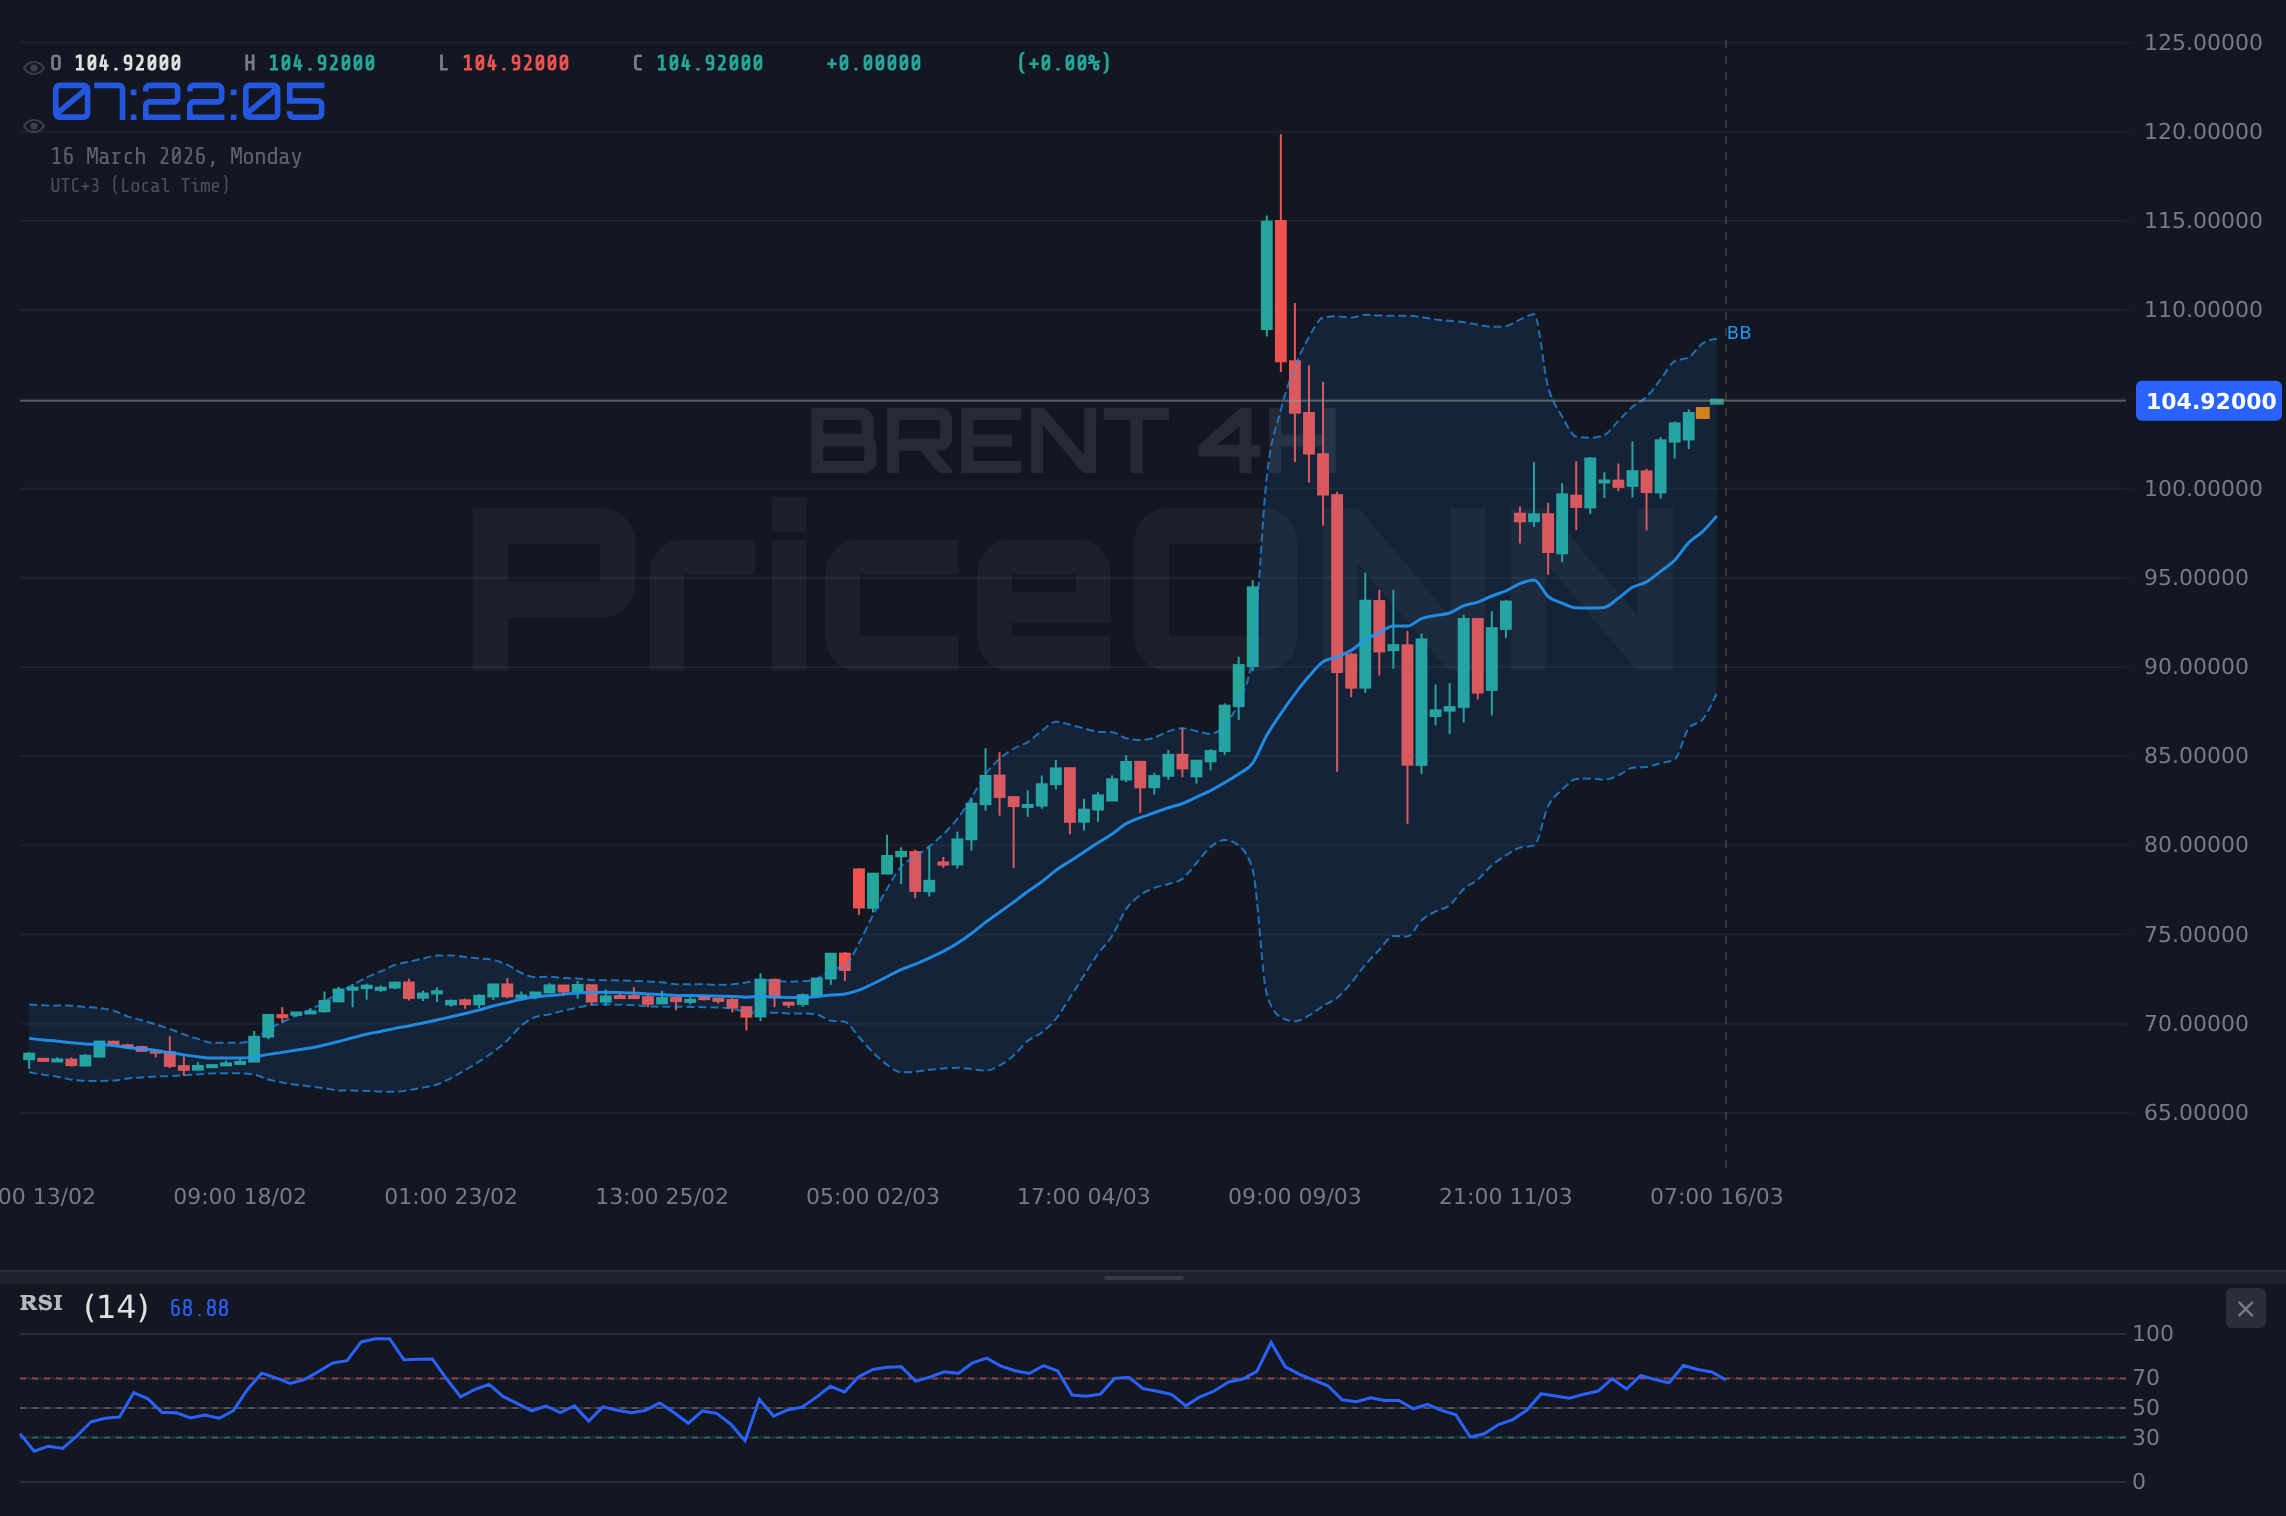
Brent Crude is currently trading at $105.01, a critical juncture where the bulls are testing key resistance levels amidst a complex geopolitical and supply landscape. The market is grappling with the aftermath of supply disruptions, particularly concerning Qatar's LNG production and potential impacts on energy flows through the Strait of Hormuz, while also digesting news of Saudi Arabia's scaled-back NEOM project. This dynamic environment creates significant volatility, making precise technical analysis and a keen understanding of intermarket correlations paramount for traders navigating these choppy waters. The current price action suggests a market on tenterhooks, balancing inflationary pressures from supply fears against potential demand shifts and broader economic sentiment.
- Brent Crude is testing resistance near $105.01, with the next significant level at $105.72.
- Geopolitical tensions in the Middle East and supply disruptions, particularly concerning Qatar's LNG, are driving price action.
- The ADX at 22.13 suggests a moderate trend, while RSI at 69.6 indicates rising bullish momentum but nearing overbought territory.
- The DXY is currently at 99.95, showing a divergence with Brent's upward move, indicating specific energy market drivers.
- A break above $105.72 could open the door for further upside, while a failure to hold $103.94 support presents a bearish risk.
Navigating the Energy Tightrope: Supply Fears vs. Economic Realities
The energy markets are once again at the forefront of global economic discussions, with Brent Crude oil hovering precariously around the $105.01 mark. This price point is not merely a number; it represents a battleground between escalating geopolitical tensions and the persistent specter of supply chain vulnerabilities. Recent reports detailing Qatar's LNG production halt and ongoing disruptions in the Strait of Hormuz are sending ripples of concern across Asian energy markets, potentially triggering a price spike and exacerbating inflationary pressures. This situation is compounded by news that Saudi Arabia might be scaling back its ambitious NEOM project due to ballooning costs, a development that, while seemingly unrelated to immediate oil supply, could signal shifting economic priorities and investor sentiment within major energy-producing nations. The interplay between these factors is creating a complex trading environment where swift, data-driven decisions are crucial.
The current upward momentum in Brent, reflected by its positive daily change of 1.31% to $105.01, is largely underpinned by these supply-side anxieties. However, the broader economic picture remains a significant counterweight. Global growth concerns, coupled with the ongoing efforts by central banks to tame inflation, could cap any sustained rally. Traders are closely watching the correlation between oil prices, the US Dollar Index (DXY), and major equity indices like the S&P 500 and Nasdaq. While Brent shows a strong upward trend on the 1H and 4H charts, the broader economic headwinds and the DXY's current level near 99.95 present a nuanced picture. The ADX at 22.13 on the 1H chart indicates a moderate trend strength, suggesting that while the direction is up, the conviction isn't overwhelming, leaving room for significant price swings.
Technical Tapestry: Indicators Painting a Mixed Picture
Delving into the technicals, the 1-hour chart for Brent Crude shows a strong uptrend with a power score of 97%. The RSI(14) is currently at 69.6, signaling strong bullish momentum but hovering near the edge of overbought territory. This suggests that while buyers are in control, the market might be due for a pause or a minor pullback to consolidate gains. The MACD is positive and above its signal line, reinforcing the bullish sentiment, while the Stochastic Oscillator, with %K at 96.63 and %D at 90.07, is firmly in overbought territory, hinting at a potential short-term reversal or consolidation. The ADX at 23.9 confirms a moderate uptrend, but the extreme readings on the Stochastic oscillator warrant caution for aggressive entries at these levels.
On the 4-hour timeframe, the trend remains strongly bullish (96% power), with the RSI at 63.46 still within healthy territory, indicating room for further upside. The MACD continues to show positive momentum. However, the Stochastic oscillator here is even more extreme, with %K at 98.71 and %D at 85.6, firmly in overbought conditions. This confluence of extreme Stochastic readings across multiple timeframes, especially on the 4H chart, suggests that a pullback is increasingly likely. The ADX at 22.13 on this timeframe also supports a moderate trend, but the overbought Stochastic implies that the current upward push might be losing steam and could be vulnerable to profit-taking.
The daily chart presents a slightly different, yet still bullish, perspective. The trend is unequivocally bullish, with 100% power. The RSI(14) at a very high 87.92 is deep in overbought territory, indicating significant buying pressure has been in play. The MACD remains bullish, and the Stochastic oscillator shows %K at 60.41 and %D at 56.48, still suggesting upward momentum, though less extreme than the shorter timeframes. The ADX here is a strong 57.84, indicating a very powerful trend is in play. This strong daily trend, coupled with overbought conditions on shorter timeframes, paints a picture of a market that is technically strong but potentially due for a correction or consolidation before the next major move. The immediate support at $103.94 and resistance at $105.72 become crucial reference points.
Levels to Watch: The $105.72 Threshold and Beyond
The current price of $105.01 for Brent Crude is sitting just below the first significant resistance level at $105.11, with the next major hurdle at $105.62 and then $106.28. A decisive break and sustained hold above $105.72 would be a strong signal for further upside, potentially targeting higher levels. This would likely be fueled by confirmation of ongoing supply disruptions or a significant shift in geopolitical risk appetite. The 1-hour chart resistance levels at $105.11 and $105.62 are the immediate battlegrounds.
On the downside, support is seen at $103.94, followed by $103.28 and $102.77 on the 1-hour chart. A break below $103.94 would signal a potential reversal or at least a deeper correction, especially if it coincides with easing supply fears or a strengthening US dollar. The 4-hour support levels at $102.29 and $100.94 become more critical if the bearish sentiment gains traction. The daily support levels at $99.61 and $95.58 represent significant psychological and technical boundaries that would likely only be tested if major fundamental shifts occur.
The divergence between the strong bullish trend on the daily chart and the overbought conditions on shorter timeframes, particularly the Stochastic oscillator, suggests that while the long-term outlook remains positive, short-to-medium term traders should exercise caution. A consolidation phase between $103.94 and $105.72 is a plausible scenario if no new catalysts emerge. However, any news confirming prolonged supply issues or escalating geopolitical tensions could easily propel Brent through the $105.72 resistance, triggering a broader upward move.
Intermarket Dynamics: DXY, Equities, and the Inflation Narrative
The relationship between oil prices and the US Dollar Index (DXY) is often inverse, but current market conditions present a more complex interplay. As Brent Crude rallies towards $105.01, the DXY is trading around 99.95, showing a slight downtrend on the 1H chart but a strong uptrend on the 4H and 1D charts, currently at 71.79 on the daily RSI, indicating overbought conditions. This divergence suggests that the current oil rally is being driven more by specific energy market fundamentals – namely supply concerns – rather than a broad dollar weakness. If the DXY were to reverse sharply upwards, it could put a damper on Brent's ascent, even amidst supply fears.
Equity markets, represented by the S&P 500 and Nasdaq, are showing a mixed picture. The S&P 500 is up 0.69% to 6670.9 on the 1H chart, indicating some risk appetite, but the 4H and 1D charts show a strong downtrend, with RSI below 45. Similarly, Nasdaq shows a strong downtrend on longer timeframes. This suggests that while there might be short-term gains in equities, the broader sentiment leans towards risk-off, which typically weighs on commodities like oil. However, oil's current rally is defying this broader trend, highlighting the dominant influence of supply-side shocks and inflation expectations. Traders are looking for confirmation of a sustained risk-on sentiment to support a broader commodity rally, or a clear risk-off move to signal potential headwinds for Brent.
The inflation narrative remains central. Higher oil prices directly contribute to inflation, and the market is keenly aware of the impact this has on central bank policy. If oil prices continue to climb due to supply constraints, it could force central banks, particularly the Federal Reserve, to maintain a hawkish stance or even consider further tightening, which would typically strengthen the dollar and pressure commodities. The current situation, where oil is rising despite potential economic slowdowns and hawkish central bank rhetoric, underscores the power of supply-driven inflation. The upcoming economic calendar, while light on high-impact events today, will be closely scrutinized for any data that could sway inflation expectations or central bank policy outlooks.
Trade Plan: Navigating the Brent Crude Landscape
Given the technical indicators and current market conditions, a cautious approach is warranted. The strong uptrend on the daily chart is compelling, but the overbought conditions on shorter timeframes, particularly the Stochastic oscillator, suggest a potential for a near-term pullback. The ADX of 22.13 indicates a moderate trend, which means that while the direction is up, it's not a runaway train yet, and reversals are possible.
Scenario A: Bullish Continuation
65% ProbabilityScenario B: Consolidation or Pullback
35% ProbabilityRisk management is paramount here. The extreme readings on the Stochastic oscillator suggest that entering long positions at current levels carries a higher risk of facing immediate profit-taking. A more prudent approach would be to wait for a confirmed breakout above $105.72 or a pullback to a more attractive support level, such as $103.94 or even $102.29, before considering long positions. The geopolitical backdrop and supply disruption news provide a strong fundamental underpinning for potential upside, but the technical picture warrants patience.
While no high-impact economic events are scheduled for today, the ongoing geopolitical tensions in the Middle East and the Qatar LNG shutdown represent significant black swan event risks. Any escalation or unexpected news could lead to rapid and substantial price movements, potentially triggering stop-losses. Traders should remain vigilant and ensure adequate risk management is in place.
The Road Ahead: What's Next for Brent Crude?
Looking forward, the path for Brent Crude will likely be dictated by the ongoing narrative surrounding supply disruptions and their impact on inflation versus broader economic concerns and central bank policy. The resilience shown by oil prices in the face of potential demand destruction and a strengthening dollar is remarkable, underscoring the potent influence of supply-side factors. The key levels around $105.01 and $105.72 will be critical in the short term. A sustained move above $105.72, supported by continued supply fears, could propel Brent higher, potentially towards the daily resistance of $107.80. Conversely, any signs of de-escalation in geopolitical tensions, a resolution to the Qatar LNG issue, or a significant shift in risk sentiment could lead to a retracement, with $103.94 and $102.29 serving as crucial support levels to watch.
The technical picture, while showing strong bullish bias on longer timeframes, presents a cautionary note due to overbought conditions on shorter timeframes. This suggests that while the trend is up, the immediate path may involve consolidation or a minor pullback. Traders would be wise to wait for clearer signals or a more favorable risk-reward setup, perhaps on a pullback to support or a confirmed breakout above resistance. The interplay between these technical signals and the evolving geopolitical and supply fundamentals will be key to unlocking the next major move in Brent Crude.
Frequently Asked Questions: BRENT Analysis
What happens if BRENT breaks decisively above the $105.72 resistance level?
A sustained break above $105.72, confirmed by increased volume, would likely trigger further bullish momentum. This could open the door for Brent Crude to target the next significant resistance at $106.28, and potentially extend towards the daily chart level of $107.80 as supply concerns continue to dominate market sentiment.
Should I buy BRENT at current levels around $105.01 given the RSI at 69.6 and Stochastic overbought?
Entering long positions at current levels carries a higher risk due to the overbought Stochastic oscillator on shorter timeframes. A more prudent strategy would be to wait for a pullback to support levels like $103.94, or a confirmed breakout above $105.72, offering a better risk-reward ratio. The probability of a short-term correction increases with these overbought signals.
Is the RSI at 87.92 on the daily chart a strong sell signal for BRENT?
An RSI of 87.92 on the daily chart is indeed deep in overbought territory, indicating significant upward momentum has been sustained. While it suggests a potential for a pullback or consolidation, it is not a direct sell signal in isolation, especially given the strong overall bullish trend (ADX 57.84). Confirmation from other indicators and price action, such as a break below key support, would be needed to signal a bearish reversal.
How will the Qatar LNG shutdown and Middle East tensions affect BRENT prices this week?
The ongoing Qatar LNG shutdown and persistent Middle East tensions are significant bullish catalysts for Brent Crude, as they directly impact global energy supply and can trigger inflationary fears. If these supply disruptions continue or escalate, they could push Brent prices higher, potentially accelerating a move towards the $105.72 resistance and beyond, overriding broader economic concerns.
Technical Outlook Summary
| Indicator | Value | Signal | Interpretation |
|---|---|---|---|
| RSI (14) | 69.6 | Neutral | Approaching overbought, strong momentum but watch for pullback |
| MACD Histogram | +1.36 | Bullish | Positive momentum supporting the uptrend |
| Stochastic | 96.63 / 90.07 | Bearish | Extreme overbought conditions on 1H chart, signaling potential reversal |
| ADX | 22.13 | Bullish | Moderate trend strength, confirming upward bias |
| Bollinger Bands | Middle Band | Bullish | Price is above the middle band, indicating bullish pressure |
Key Levels
Support Levels
Resistance Levels
Track markets in real-time
AI-powered analysis, technical indicators and real-time price data.
Join Our Telegram Channel
Breaking market news, AI analysis and trading signals instantly.
Join Channel