في ظل تصاعد التوترات الجيوسياسية التي غالباً ما تدفع المستثمرين للبحث عن الملاذات الآمنة، وجد الذهب نفسه يتداول بحذر قرب مستوى 5021.41 دولاراً. هذه النقطة المحورية تتطلب نظرة فاحصة، ليس فقط على حركة سعر المعدن الأصفر، بل على الشبكة المعقدة للعوامل الاقتصادية والسياسية العالمية التي تشكل مساره حالياً. رد فعل السوق على هذه الأحداث المتكشفة هو شهادة على الدور الدائم للذهب كتحوط ضد عدم اليقين، وفهم الفروق الدقيقة لهذا التفاعل أمر بالغ الأهمية لأي متداول جاد.
- يتداول XAUUSD حالياً قرب 5021.41 دولاراً، متأثراً بالمخاطر الجيوسياسية وقوة مؤشر الدولار (DXY).
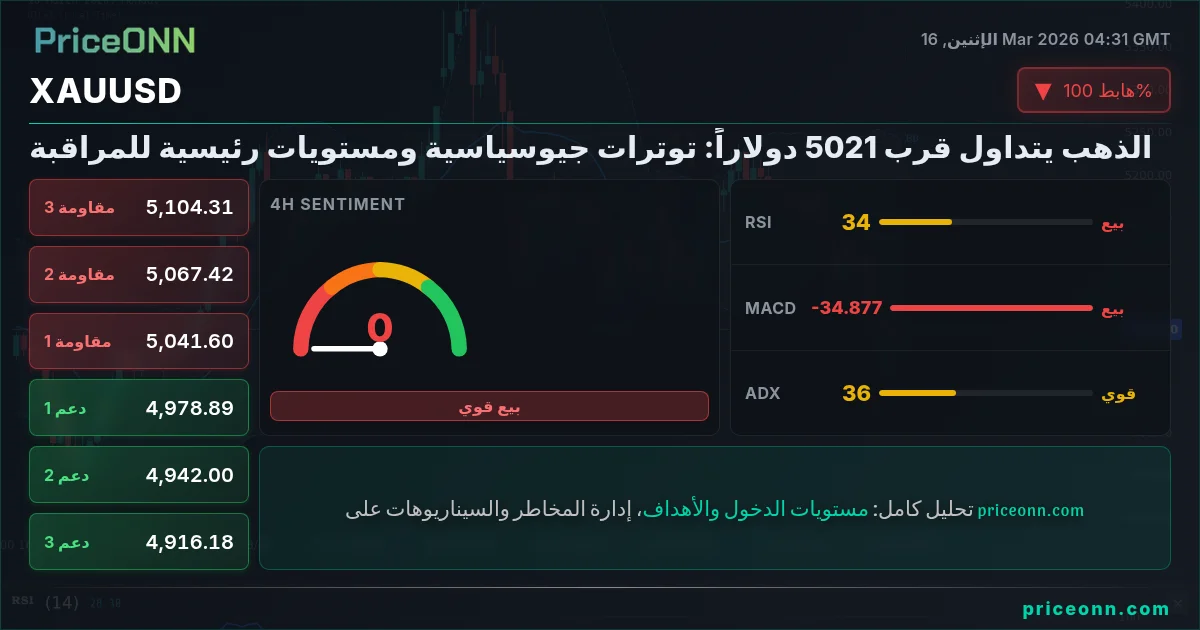
- يُظهر الرسم البياني للساعة مؤشر القوة النسبية (RSI) عند 39.48، مما يشير إلى زخم محايد مع ميل طفيف للهبوط، بينما يشير مؤشر ADX عند 49.57 إلى اتجاه هبوطي قوي.
- مستويات الدعم الرئيسية للمراقبة هي 4994.65 دولاراً و 4985.72 دولاراً، مع مراقبة المقاومة عند 5015.51 دولاراً و 5027.44 دولاراً.
- التوترات الجيوسياسية، لا سيما في الشرق الأوسط، هي المحرك الرئيسي، مما قد يزيد الطلب على الذهب كملاذ آمن.
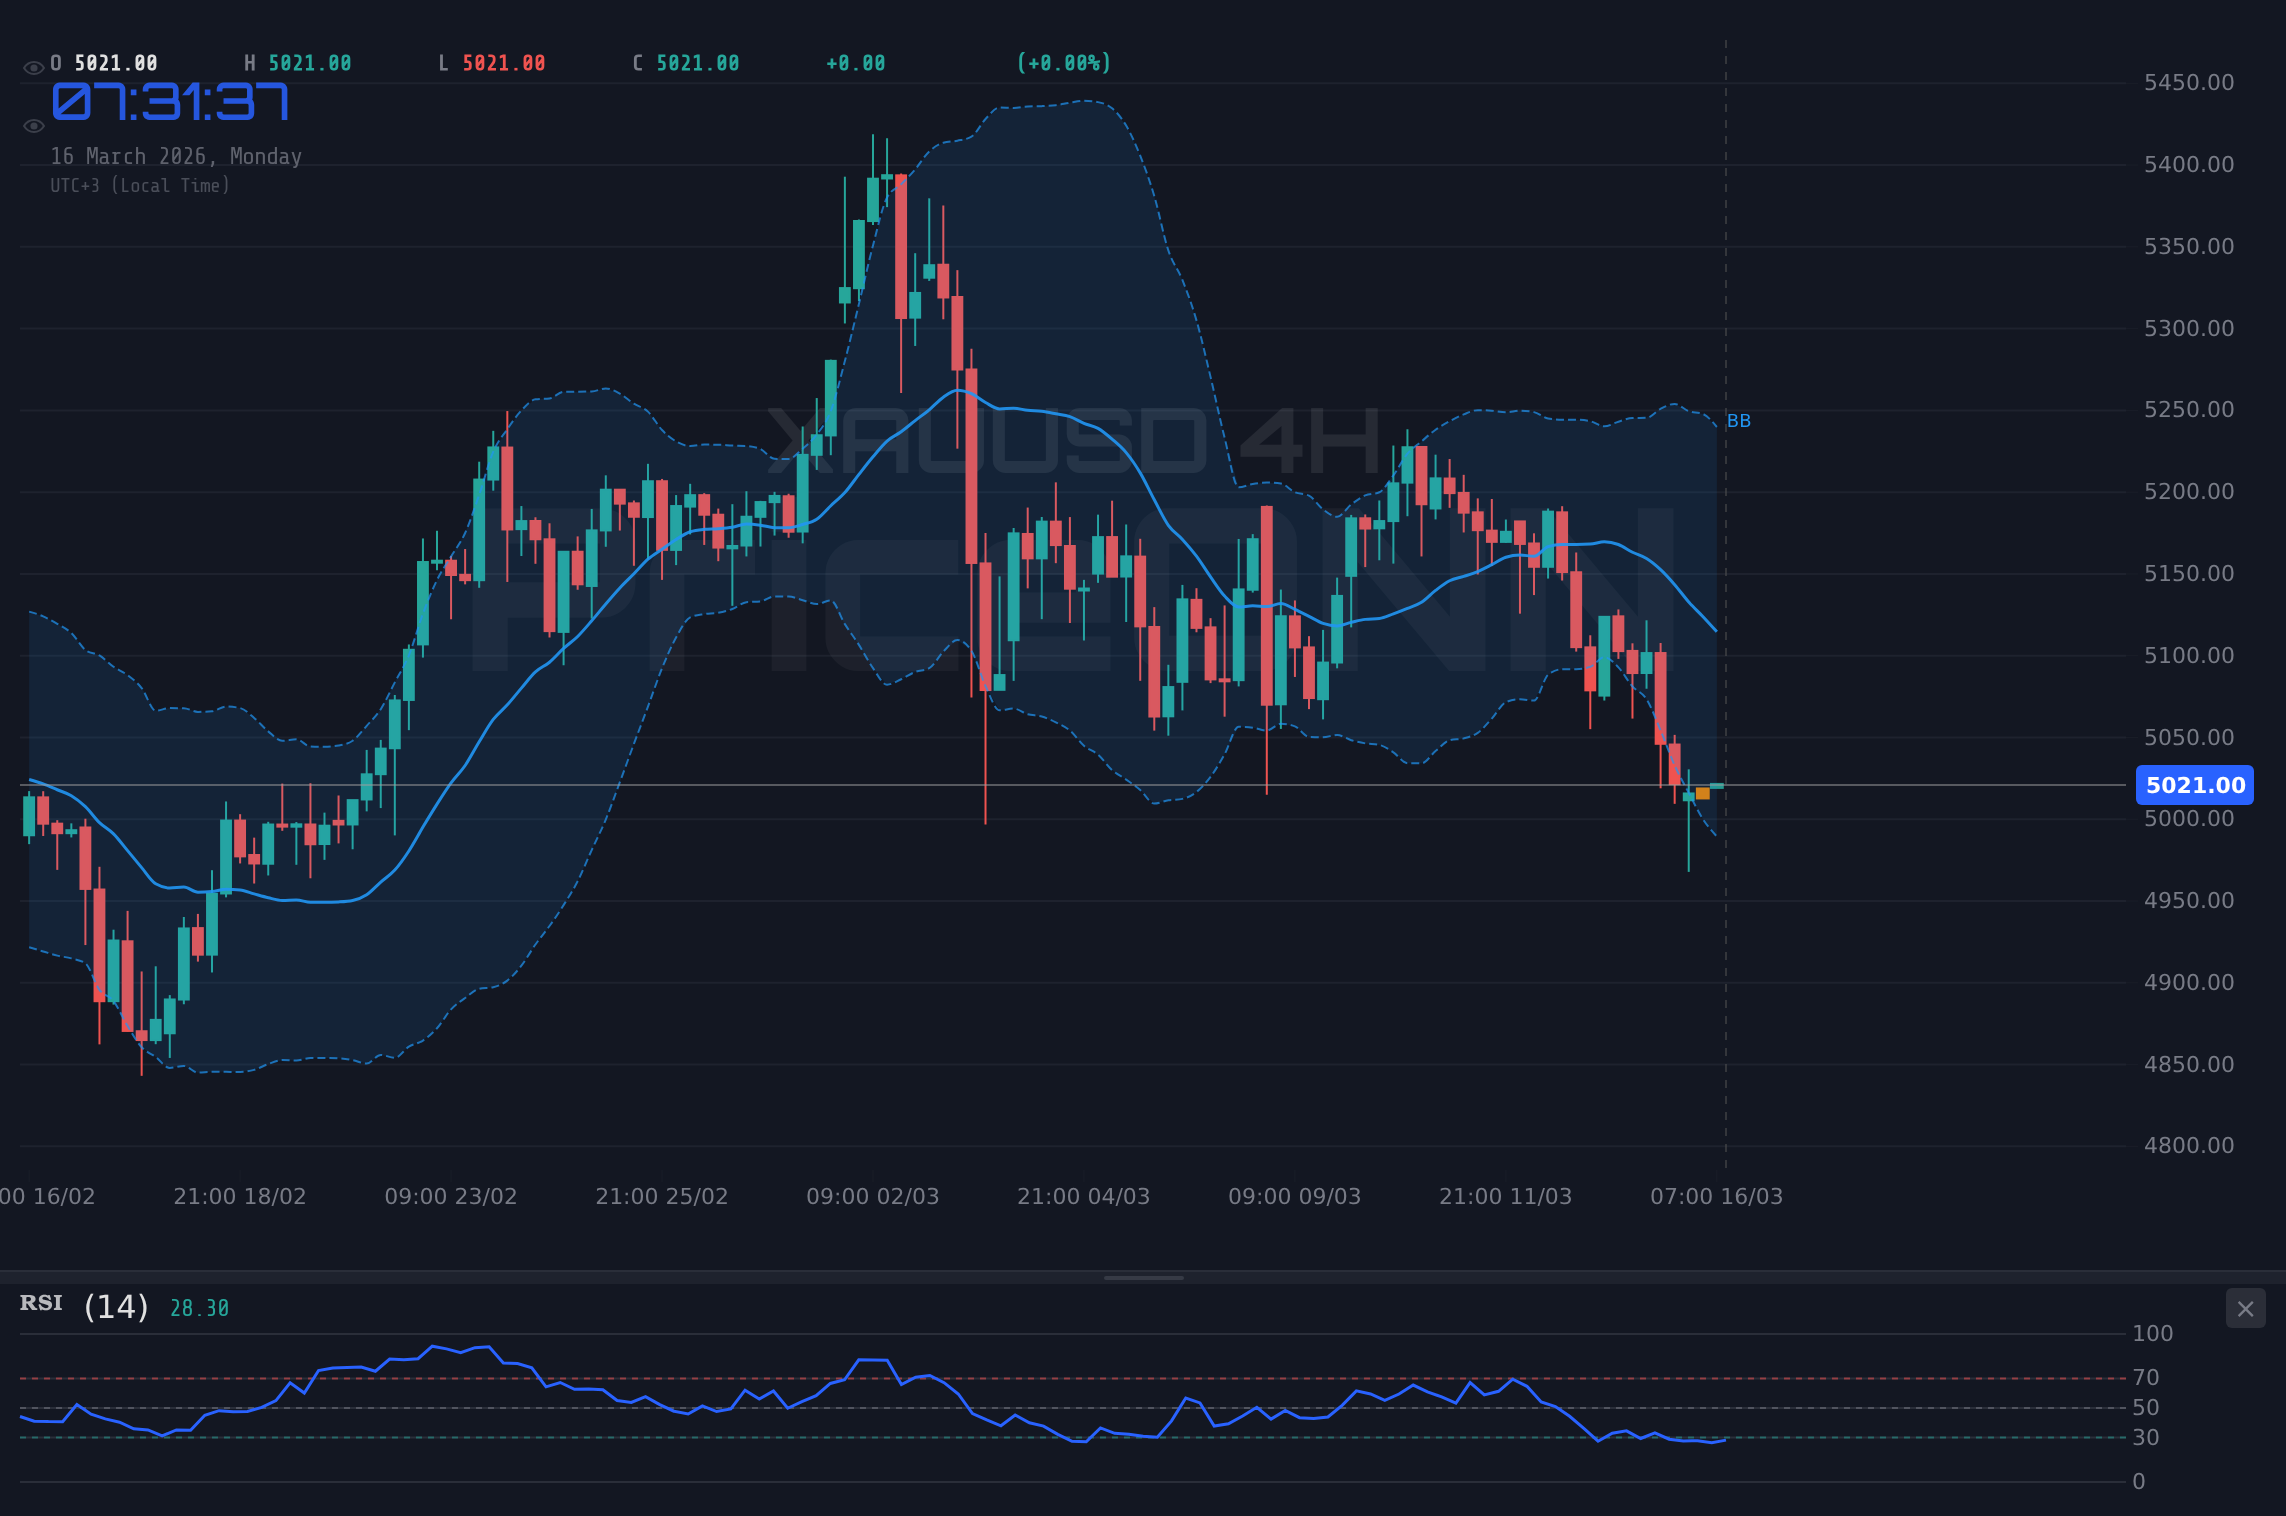
يعكس السعر الحالي لـ XAUUSD البالغ 5021.41 دولاراً سوقاً يتعامل مع مزيج معقد من الإشارات. في حين أن الرسم البياني اليومي يشير إلى اتجاه محايد مع قراءة لمؤشر ADX تبلغ 12.68 فقط، مما يشير إلى نقص في قوة الاتجاه طويلة الأجل، فإن الأطر الزمنية الأقصر ترسم صورة مختلفة. يُظهر الرسم البياني للساعة، على سبيل المثال، اتجاهاً هبوطياً قوياً مع مؤشر ADX عند 49.57 وإشارة بيع من مؤشرات متعددة. يسلط هذا التباين عبر الأطر الزمنية الضوء على التقلبات واحتمالية التحركات الحادة، مما يجعل تحليل الدوافع الأساسية أمراً بالغ الأهمية.
يتداول مؤشر الدولار الأمريكي (DXY) حالياً حول 99.97، ويظهر اتجاهاً صعودياً قوياً على الرسوم البيانية للساعة و 4 ساعات، على الرغم من أن اتجاهه اليومي قوي أيضاً. عادةً ما يمارس مؤشر الدولار المرتفع ضغطاً هبوطياً على أسعار الذهب، حيث أن الدولار الأقوى يجعل الذهب أكثر تكلفة لحاملي العملات الأخرى. هذا الارتباط العكسي هو جانب أساسي من ديناميكيات سعر الذهب، ومع إظهار مؤشر DXY زخماً صعودياً قوياً، فإنه يمثل عقبة أمام الذهب. ومع ذلك، فإن الوضع الجيوسياسي المتصاعد، لا سيما فيما يتعلق بالاضطرابات المحتملة في الشرق الأوسط ومضيق هرمز، يمكن أن يتغلب على قوة الدولار هذه، مما يؤجج الطلب على الذهب كملاذ آمن.
التنقل في التيارات الجيوسياسية المعاكسة
تسلط التقارير الإخبارية الأخيرة الضوء على تصاعد التوترات في الشرق الأوسط واضطرابات محتملة في سلاسل التوريد في أسواق الطاقة، مثل تقليص مشروع نيوم السعودي ومخاوف بشأن إمدادات قطر من الغاز الطبيعي المسال. في حين أن هذه الأحداث تؤثر بشكل مباشر على أسعار الطاقة مثل خام برنت والنفط الخام الأمريكي (WTI)، فإن تأثيرها غير المباشر على الذهب لا يمكن الاستهانة به. غالباً ما يؤدي عدم اليقين الجيوسياسي المتزايد إلى الهروب إلى الأمان، مما يعزز الطلب على أصول مثل الذهب، حتى في مواجهة الدولار القوي. تخلق هذه الديناميكية صراعاً: الدولار القوي يدفع الذهب للأسفل مقابل المخاوف الجيوسياسية التي تسحبه للأعلى. لذلك، فإن مستوى 5021.41 دولاراً هو ساحة معركة تتصادم فيها هذه القوى المتعارضة حالياً.
يؤكد مؤشر ADX عبر جميع الأطر الزمنية على تردد السوق الحالي، وإن كان مع إشارة اتجاه هبوطي قوي على الرسوم البيانية للساعة و 4 ساعات. على الرسم البياني اليومي، يشير مؤشر ADX عند 12.68 إلى اتجاه ضعيف، مما يعني أن السوق يتوطد أو ينتظر محفزاً مهماً. هذا هو المكان الذي يصبح فيه تحليل حركة السعر حاسماً. المقاومة الفورية عند 5015.51 دولاراً و 5027.44 دولاراً، والدعم عند 4994.65 دولاراً و 4985.72 دولاراً على الرسم البياني للساعة، تحدد نطاق التداول قصير الأجل. قد يشير الاختراق الحاسم فوق مستوى المقاومة 5027.44 دولاراً إلى تحول، في حين أن الانخفاض دون 4994.65 دولاراً قد يشير إلى مزيد من الضغط الهبوطي.
قبضة الدولار وصمود الذهب
يمثل السعر الحالي لمؤشر DXY البالغ 99.97، مع اتجاهات صعودية قوية على الأطر الزمنية الأقصر واتجاه يومي قوي، تحدياً كبيراً للذهب. تاريخياً، عندما يقوى الدولار، تميل أسعار الذهب إلى الانخفاض. هذا يرجع إلى أن الذهب مسعر بالدولار؛ الدولار الأقوى يعني قوة شرائية أقل لحاملي العملات الأخرى، مما يجعل الذهب أقل جاذبية. مؤشر القوة النسبية (RSI) على الرسم البياني لـ DXY لمدة 4 ساعات عند 68.11، مما يشير إلى أنه في المنطقة المحايدة العليا ولا يزال لديه مجال للارتفاع قبل الوصول إلى ظروف ذروة الشراء القصوى. وبالمثل، يشير مؤشر RSI اليومي عند 72.06 إلى استمرار الزخم الصعودي للدولار. هذه البيئة تفضل عادةً نظرة هبوطية للذهب.
ومع ذلك، فإن السرد المحيط بالذهب نادراً ما يكون بسيطاً. وضعه كأصل ملاذ آمن يعني أنه يمكن أن ينفصل عن الارتباطات التقليدية عندما تزداد حالة عدم اليقين العالمية. التوترات الجيوسياسية المستمرة، كما وردت من مصادر مثل رويترز وبلومبرغ، هي مثال رئيسي. أي تصعيد في الشرق الأوسط، أو اضطرابات كبيرة في سلاسل توريد الطاقة العالمية - كما تشير الأخبار المتعلقة بإغلاق الغاز الطبيعي المسال في قطر ومراجعات مشروع نيوم السعودي - يمكن أن تتغلب على قوة الدولار وتؤدي إلى هروب إلى الذهب. هذا الاحتمال لطلب الملاذ الآمن يعني أنه حتى مع مؤشر DXY القوي، قد يجد الذهب دعماً، خاصة حول المستويات الفنية الرئيسية مثل 4994.65 دولاراً.
الإشارات الفنية: مزيج مختلط
يكشف فحص المؤشرات الفنية لـ XAUUSD عن صورة معقدة. على الرسم البياني للساعة، مؤشر القوة النسبية (RSI) عند 39.48 في منطقة محايدة ولكنه يميل نحو الهبوط، مع إظهار مؤشر MACD زخماً سلبياً تحت خط الإشارة الخاص به. ومع ذلك، يُظهر مؤشر ستوكاستيك إشارة صعودية مع كون %K أعلى من %D عند 50.42 و 33.67 على التوالي، مما يشير إلى ارتداد محتمل قصير الأجل. مؤشر ADX عند 49.57 يشير إلى اتجاه هبوطي قوي على هذا الإطار الزمني، مما يعزز الشعور الهبوطي. تميل الإشارة الإجمالية على الرسم البياني للساعة إلى 'بيع'، مع 7 إشارات بيع مقابل 1 إشارة شراء.
يعزز الرسم البياني لمدة 4 ساعات سرد الاتجاه الهبوطي، مع مؤشر ADX عند 34.33 مما يشير إلى اتجاه قوي. مؤشر القوة النسبية (RSI) أقل عند 34.54، لا يزال في المنطقة المحايدة ولكنه أقرب إلى منطقة ذروة البيع، في حين أن مؤشر ستوكاستيك يُظهر إشارة هبوطية واضحة (%K
ومع ذلك، يقدم الرسم البياني اليومي طبقة من الحذر. ينخفض مؤشر ADX بشكل كبير إلى 12.68، مما يشير إلى اتجاه ضعيف واحتمالية للتوطيد. مؤشر القوة النسبية (RSI) عند 47.84 في المنطقة المحايدة بقوة، ومؤشر ستوكاستيك في منطقة ذروة البيع العميقة مع كون %K عند 15.22 و %D عند 31.06، مما يلمح إلى فرصة شراء محتملة. لا يزال مؤشر MACD هبوطياً، لكن توزيع الإشارات الإجمالي يُظهر مزيجاً، يميل نحو 'بيع' مع 6 إشارات بيع و 2 إشارة شراء. تشير هذه النظرة اليومية إلى أنه في حين أن الاتجاهات قصيرة الأجل هبوطية، فإن الصورة طويلة الأجل أقل تحديداً، ويمكن لمُحفز كبير أن يغير المعنويات.
أهمية 5015.51 دولاراً و 4994.65 دولاراً
بالنسبة للمتداولين الذين يتطلعون إلى التنقل في الظروف المتقلبة الحالية، فإن مستويات 5015.51 دولاراً و 4994.65 دولاراً مهمة بشكل خاص. المقاومة عند 5015.51 دولاراً على الرسم البياني للساعة تعمل كعقبة فورية. قد يؤدي الفشل في الاختراق بقوة والحفاظ على السعر فوق هذا المستوى إلى تراجع الأسعار نحو الدعم عند 4994.65 دولاراً. هذا المستوى، وهو دعم رئيسي على الإطار الزمني للساعة، قريب أيضاً من دعم 5003.39 دولاراً على الرسم البياني لمدة 4 ساعات. من المحتمل أن يؤدي الاختراق دون 4994.65 دولاراً إلى مزيد من البيع، مستهدفاً محتملة مستوى 4985.72 دولاراً، والذي يمثل تقاطعاً للدعم عبر أطر زمنية مختلفة.
على العكس من ذلك، فإن الحركة المستمرة فوق 5015.51 دولاراً، والأهم من ذلك، فوق مستوى المقاومة 5027.44 دولاراً، يمكن أن تشير إلى انعكاس صعودي قصير الأجل. سيتطلب هذا تأكيداً من المؤشرات الأخرى وتحولاً محتملاً في معنويات السوق الأوسع، ربما مدفوعاً بتعليقات متساهلة من الاحتياطي الفيدرالي أو تخفيف التوترات الجيوسياسية. يصبح مستوى 5036.37 دولاراً على الرسم البياني للساعة هو المقاومة الهامة التالية. نظراً لإشارات الاتجاه الهبوطي القوية الحالية على الأطر الزمنية الأقصر، فإن هذا السيناريو الصعودي يبدو أقل احتمالاً بدون محفز كبير.
تحليل الأسواق المتداخلة: الأسهم والطاقة
يوفر أداء مؤشرات الأسهم الرئيسية مثل S&P 500 (حالياً عند 6668.4) و Nasdaq 100 (عند 24520.14) سياقاً لشهية المخاطرة. يُظهر كلا المؤشرين اتجاهاً هبوطياً قوياً على الرسوم البيانية اليومية، مع قراءات ADX تبلغ 39.23 و 31.61 على التوالي، مما يشير إلى أن معنويات 'تجنب المخاطر' قد تكون سائدة على الرغم من بعض القوة خلال اليوم. هذه البيئة التي تتجنب المخاطر تفيد عادةً الأصول الملاذ الآمن مثل الذهب. إذا استمرت أسواق الأسهم في التعثر، فقد توفر أرضية لأسعار الذهب، حتى لو ظل مؤشر DXY قوياً.
تُظهر أسواق الطاقة، وخاصة خام برنت عند 105 دولاراً وخام WTI عند 99.51 دولاراً، اتجاهات صعودية قوية. يُعزى هذا بشكل كبير إلى المخاوف الجيوسياسية، التي تغذي أيضاً الطلب على الذهب. تشير قيم مؤشر القوة النسبية (RSI) المرتفعة في النفط (مؤشر RSI لخام برنت عند 87.91 يومياً) إلى ظروف ذروة الشراء واحتمالية حدوث تراجع، لكن الدوافع الجيوسياسية الأساسية تشير إلى استمرار الدعم. أي اضطرابات كبيرة في إمدادات الطاقة يمكن أن تؤدي إلى ارتفاع توقعات التضخم، مما يعزز جاذبية الذهب كتحوط ضد التضخم.
خطة التداول: التنقل في مفترق طرق 5021.41 دولاراً
بالنظر إلى الإشارات الهبوطية القوية على الأطر الزمنية الأقصر، والقوة المستمرة لمؤشر DXY، ومستويات المقاومة الحرجة المقبلة، يلزم اتباع نهج حذر لـ XAUUSD. يشير مؤشر ADX عند 34.33 على الرسم البياني لمدة 4 ساعات إلى اتجاه هبوطي قوي، ويشير مؤشر القوة النسبية (RSI) عند 34.54 إلى وجود مجال للانخفاض أكثر قبل الوصول إلى منطقة ذروة البيع على هذا الإطار الزمني.
السيناريو أ: استمرار الاتجاه الهبوطي
احتمالية 60%السيناريو ب: انعكاس صعودي (مدفوع جيوسياسياً)
احتمالية 25%احتمالية السيناريو الهبوطي أعلى بسبب تلاقي الإشارات الفنية على الأطر الزمنية الأقصر والقوة المستمرة لمؤشر DXY. ومع ذلك، لا يمكن تجاهل العامل الجيوسياسي المجهول. قد يؤدي التصعيد أو تخفيف التصعيد المفاجئ إلى تغيير سريع في التوقعات. لذلك، فإن إدارة المخاطر أمر بالغ الأهمية. سيكون الإغلاق دون 4994.65 دولاراً على الرسم البياني للساعة هو المحفز الأساسي لبدء مركز بيع، مع وضع وقف الخسارة فوق مستوى المقاومة 5027.44 دولاراً. على العكس من ذلك، فإن الاختراق الحاسم فوق 5027.44 دولاراً، خاصة إذا كان مصحوباً بزيادة الطلب على الملاذات الآمنة بسبب الأحداث الجيوسياسية، يمكن أن يشير إلى فرصة شراء، على الرغم من أن هذا يبدو أقل احتمالاً نظراً للإعداد الفني الحالي.
ظل التقويم الاقتصادي
في حين أن السوق يركز حالياً على الأحداث الجيوسياسية، فإن إصدارات البيانات الاقتصادية القادمة يمكن أن توفر اتجاهاً إضافياً. على الرغم من عدم وجود أحداث عالية التأثير مجدولة لليوم، 16 مارس، سيراقب المتداولون عن كثب التقويم الاقتصادي لبقية الأسبوع. أي مفاجآت في بيانات التضخم أو التوظيف القادمة يمكن أن تؤثر بشكل كبير على توقعات سياسة البنك المركزي، والتي بدورها ستؤثر على كل من مؤشر DXY والذهب. على سبيل المثال، إذا جاءت أرقام التضخم الأمريكية القادمة أعلى من المتوقع، فقد يقوي ذلك الدولار ويضغط على الذهب، بافتراض أن الاحتياطي الفيدرالي يحافظ على موقف متشدد. وعلى العكس من ذلك، قد تؤدي البيانات الأضعف إلى توقعات بخفض أسعار الفائدة من قبل الاحتياطي الفيدرالي، مما قد يدعم الذهب.
يمكن للأحداث الجيوسياسية أن تسبب تقلبات شديدة. استخدم دائماً أوامر وقف الخسارة وقم بإدارة مخاطرك بشكل مناسب. التفاعل بين مؤشر DXY القوي والطلب على الملاذات الآمنة يخلق بيئة تداول معقدة حول مستوى 5021.41 دولاراً.
يمثل إجراء السعر الحالي حول 5021.41 دولاراً لـ XAUUSD اختباراً حاسماً. تميل المؤشرات الفنية قصيرة الأجل إلى الهبوط، مدعومة بمؤشر DXY قوي، لكن حالات عدم اليقين الجيوسياسية توفر عاملاً مجهولاً صعودياً. يجب على المتداولين البقاء يقظين، ومراقبة المستويات الرئيسية عن كثب، والاستعداد للتحولات السريعة في المعنويات. سيكون الصبر والانضباط في انتظار الإعدادات الواضحة وإدارة المخاطر مفتاح التنقل في هذه البيئة.
أسئلة متكررة: تحليل XAUUSD
ماذا يحدث إذا اخترق XAUUSD مستوى المقاومة 5027.44 دولاراً؟
قد يشير الاختراق المستمر فوق 5027.44 دولاراً على الرسم البياني للساعة إلى انعكاس صعودي، مستهدفاً محتملة 5036.37 دولاراً. هذا السيناريو أقل احتمالاً حالياً بسبب المؤشرات الفنية قصيرة الأجل الهبوطية ومؤشر DXY القوي، ولكن الأحداث الجيوسياسية يمكن أن تعمل كمحفز.
هل مؤشر القوة النسبية (RSI) عند 39.48 هو إشارة بيع لـ XAUUSD الآن؟
يشير مؤشر القوة النسبية (RSI) عند 39.48 على الرسم البياني للساعة إلى زخم محايد يميل نحو الهبوط، وليس إشارة بيع فورية. ومع ذلك، عند دمجه مع مؤشر ADX عند 49.57 الذي يشير إلى اتجاه هبوطي قوي، فإنه يدعم نظرة هبوطية حذرة، خاصة إذا انخفض السعر دون 4994.65 دولاراً.
هل يجب أن أشتري XAUUSD عند المستويات الحالية البالغة 5021.41 دولاراً نظراً للمخاطر الجيوسياسية؟
الشراء عند المستويات الحالية ينطوي على مخاطر بسبب الإشارات الهبوطية قصيرة الأجل وقوة مؤشر DXY. قد يكون النهج الأكثر حكمة هو الانتظار لاختراق مؤكد فوق 5027.44 دولاراً أو انخفاض حاسم إلى مستويات الدعم مثل 4994.65 دولاراً للحصول على إعداد تداول أوضح. احتمالية التحرك الهبوطي أعلى حالياً.
كيف ستؤثر الأحداث الجيوسياسية القادمة على XAUUSD هذا الأسبوع؟
يمكن أن تؤدي التوترات الجيوسياسية المتصاعدة، خاصة في الشرق الأوسط، إلى تعزيز الطلب على الذهب كملاذ آمن بشكل كبير، مما قد يتغلب على قوة الدولار ويدفع XAUUSD نحو مستويات المقاومة مثل 5027.44 دولاراً وما فوقها. وعلى العكس من ذلك، فإن تخفيف التصعيد يمكن أن يزيل دافعاً صعودياً رئيسياً.