
DowJones30 Trades Near $46,457: Jobs, Prices Data Ahead
DowJones30 hovers around $46,457 as traders await key US jobs and inflation data. Technicals show a neutral trend with strong ADX.
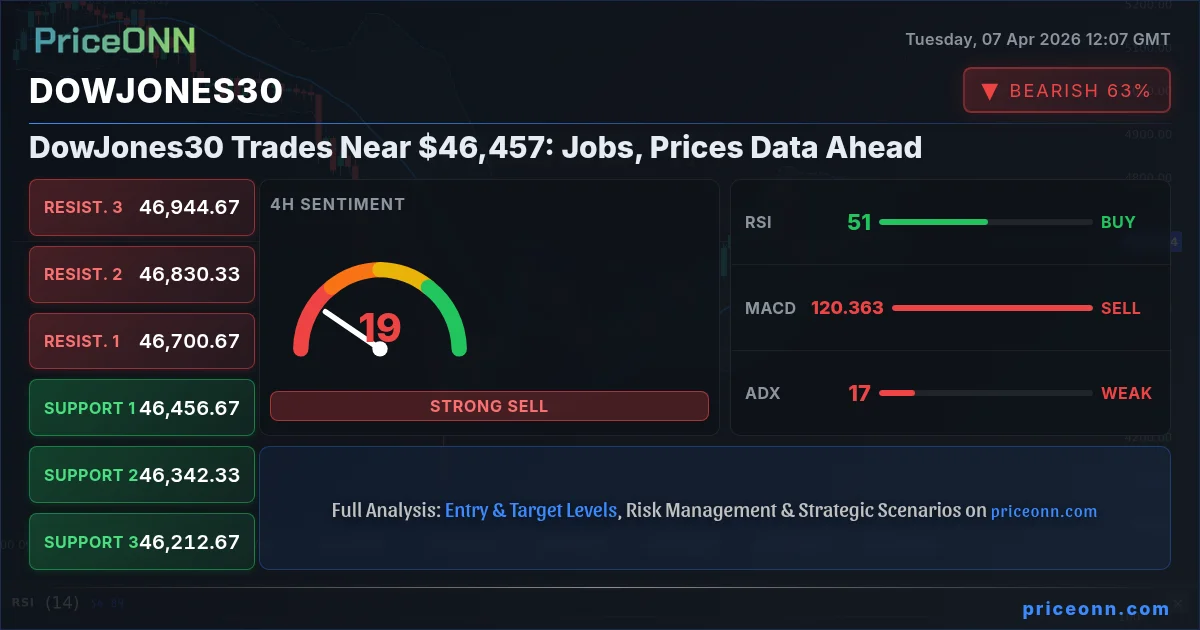
The Dow Jones Industrial Average is currently navigating a critical juncture, trading near the $46,457 mark. This consolidation comes as market participants brace for a deluge of crucial economic data, including employment figures and inflation indicators, expected to shape the Federal Reserve's next policy moves. While the index shows a neutral trend on the daily chart, the underlying technical signals present a complex picture, demanding careful observation and disciplined risk management. Understanding the interplay between these economic releases and the Dow's technical landscape is paramount for traders aiming to navigate the potential volatility ahead. This deep-dive analysis will dissect the current market conditions, explore key technical levels, and provide a forward-looking perspective on what to expect.
- The DowJones30 is trading at $46,457, showing a neutral trend on the daily chart with a strong ADX of 36.36 indicating a robust downtrend on the daily timeframe, while 1H and 4H show weaker trends.
- Key support is identified at $46,327.33, with further levels at $45,881.67 and $45,637.33; breaking below these could signal further downside.
- Resistance is currently faced around $47,017.33, with subsequent levels at $47,261.67 and $47,707.33, levels that must be cleared for a bullish reversal.
- The RSI(14) is at 45.44, suggesting a bearish bias, while MACD shows positive momentum on the daily chart, creating a divergence that warrants attention.
- Correlation analysis shows DXY at 99.7, indicating dollar strength, which typically pressures indices like the DowJones30.
Navigating the $46,457 Level: A Technical Crossroads
The Dow's Current Stance: A Battle for Direction
The Dow Jones Industrial Average (DJIA) finds itself at a pivotal $46,457.00 level, a point where conflicting technical signals and anticipation of economic events create a delicate balance. On the daily chart, the trend is technically classified as 'Düşüş' (Downtrend) with a strength of 93%, underscored by a strong ADX reading of 36.36. This suggests that bearish momentum has been dominant over the longer term. However, the shorter timeframes paint a different picture. The 1-hour chart indicates a 'Yükseliş' (Uptrend) with 92% strength, showing a strong intraday recovery, while the 4-hour chart also leans towards an uptrend with 89% strength. This divergence across timeframes highlights a market in flux, where short-term momentum might be battling against a more entrenched longer-term trend. Traders are keenly watching to see if the intraday strength can overcome the daily bearish bias, or if the underlying downtrend will reassert itself.
The immediate price action around $46,457 is crucial. This level has acted as a battleground, with price oscillating around it. The ADX, a measure of trend strength, is particularly telling across different timeframes. A strong ADX of 36.36 on the daily chart confirms the presence of a significant trend, albeit a bearish one. Conversely, the 1-hour ADX at 13.39 and the 4-hour ADX at 17.76 both indicate weak trends on these shorter frames. This disparity suggests that while the longer-term direction might be down, the immediate market is characterized by indecision and a lack of strong directional commitment, potentially leading to choppy price action until a clearer catalyst emerges.
Decoding the Indicators: Mixed Signals from the Tools
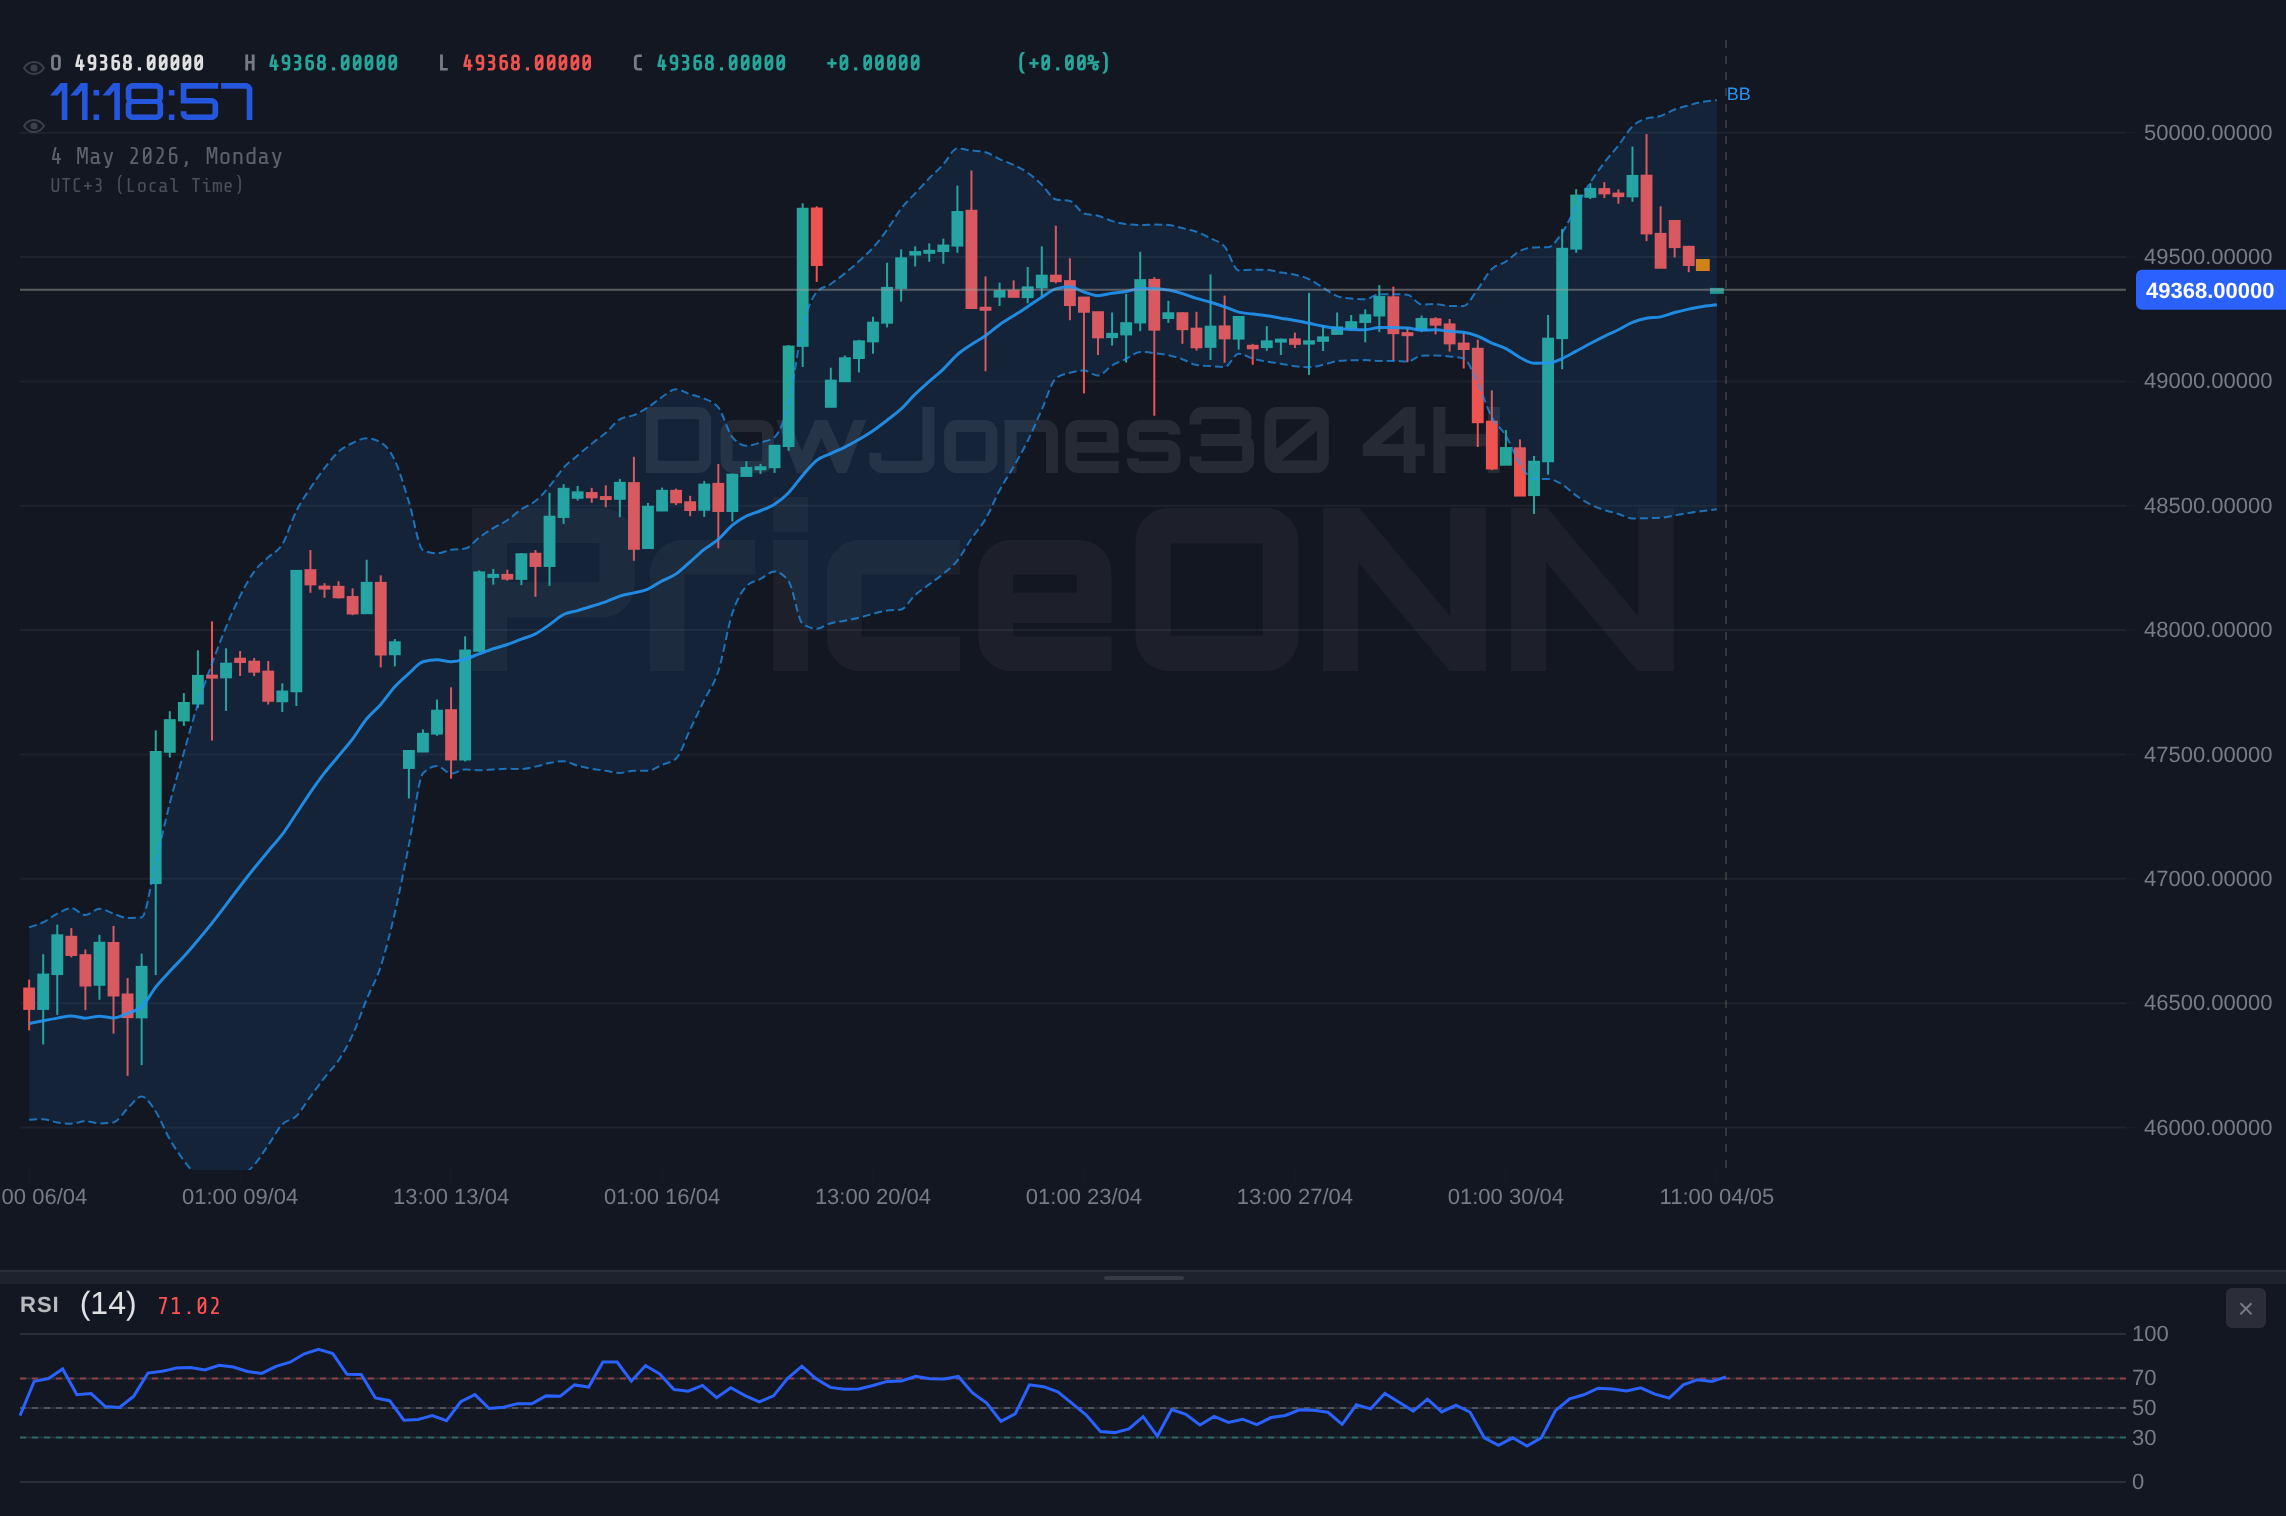
Diving deeper into the technical indicators provides a nuanced view of the Dow's immediate prospects. On the daily chart, the Relative Strength Index (RSI(14)) stands at 45.44. This value falls within the neutral territory but leans towards bearish, indicating that while not yet oversold, selling pressure has been more dominant than buying pressure over the past 14 days. However, the Moving Average Convergence Divergence (MACD) on the daily timeframe is showing positive momentum, with the MACD line above its signal line. This creates a divergence: the RSI suggests bearish leanings, while the MACD hints at potential underlying buying strength. This kind of divergence often precedes a significant price move, as the market tries to reconcile these conflicting signals.
Looking at the shorter timeframes, the 1-hour RSI is at 43.44, reinforcing the bearish sentiment seen on the daily chart, suggesting that intraday buyers might be losing steam. The MACD on the 1-hour chart is also negative, aligning with the bearish tone. On the 4-hour chart, the RSI is slightly more neutral at 52.13, showing a slight upward inclination, while the MACD is again negative. The Stochastic Oscillator provides further conflicting data. On the daily chart, %K (86.43) is above %D (70.06), suggesting a potential bullish signal as it moves out of oversold territory. However, on the 1-hour chart, %K (35.18) is below %D (46), indicating a bearish signal. This cross-contradiction highlights the current indecisiveness in the market. The ADX readings, as previously mentioned, confirm the lack of strong directional conviction across shorter timeframes, despite the stronger trend on the daily.
The $46,457 Line: Where Support Meets Resistance
The current trading price of $46,457.00 for the Dow Jones Industrial Average is situated within a zone of significant technical interest, bridging key support and resistance levels that will likely dictate its short-to-medium term direction. The primary support level on the daily chart is located at $46,327.33. This level has historically acted as a floor, and a decisive break below it could trigger further downside, potentially testing the subsequent support at $45,881.67. Below that, $45,637.33 represents a more substantial support zone, a failure to hold which would indicate a significant shift in market sentiment.
On the upside, immediate resistance is found at $47,017.33. This is a critical level that bulls must conquer to signal a potential reversal of the current bearish bias. A successful breach and sustained hold above this resistance could open the path towards $47,261.67 and subsequently $47,707.33. The proximity of these levels to the current price suggests that the market is poised for potential volatility, especially as it digests upcoming economic data. The strength of the trend indicated by the ADX on the daily chart (36.36) implies that any move through these levels will likely require significant conviction and volume. Traders are closely monitoring price action around $46,457, looking for confirmation of a break above resistance or a retest and failure at support.
Macroeconomic Crosscurrents: Jobs, Inflation, and the Fed
The Dollar's Role: DXY at 99.7
The US Dollar Index (DXY), currently trading around 99.7, plays a crucial role in shaping the Dow Jones's movements. A DXY reading above 99.5 generally indicates dollar strength, which tends to exert downward pressure on global indices like the Dow Jones Industrial Average. The current reading of 99.7 suggests a firm dollar, potentially acting as a headwind for US equities. The daily chart for DXY shows a rising trend with an ADX of 29.17, confirming the strength of this upward move. This dollar strength can make US exports more expensive, potentially impacting corporate earnings, and can also lead to capital outflows from riskier assets as investors seek the perceived safety and higher yields of dollar-denominated assets. The interplay between the strong dollar and the Dow's price action is a key correlation to watch, especially as we approach key economic data releases.
The DXY's technicals also present a mixed picture, similar to the Dow. While the daily chart shows a rising trend, the 1-hour chart indicates a falling trend, and the 4-hour chart is neutral. The RSI on the daily DXY is at 57.03, indicating a healthy bullish bias without being overbought, while the MACD shows negative momentum on the hourly and positive on the 4-hour. This suggests that the dollar's strength might be facing some internal contradictions, which could lead to increased volatility in correlated assets like the Dow Jones. A sustained break above key resistance levels for the DXY, such as 100.18, would likely amplify the pressure on the Dow, while a failure to hold support at 99.39 could provide some relief to equities.
Upcoming Data: The Catalyst for Volatility
The economic calendar is packed with high-impact events that could significantly influence the Dow Jones Industrial Average. Several US data releases are on the horizon, including employment figures and inflation data. While specific dates and forecasts are not provided in the current market context, the general expectation is that these releases will offer crucial insights into the health of the US economy and the potential trajectory of Federal Reserve monetary policy. For instance, a stronger-than-expected jobs report could fuel inflation concerns and reinforce expectations of a hawkish Fed, potentially leading to increased pressure on equities as interest rate hike probabilities rise. Conversely, weaker employment numbers might suggest an economic slowdown, which could lead to a reassessment of Fed policy and potentially offer some support to the stock market if it implies a less aggressive stance.
Inflation data will be equally critical. If inflation proves to be 'stubbornly high' or shows signs of re-acceleration, it could reinforce the Fed's resolve to maintain a tight monetary policy or even consider further tightening. This scenario would likely weigh heavily on the Dow, as higher borrowing costs tend to dampen corporate profitability and reduce consumer spending. On the other hand, signs of cooling inflation could bolster hopes for a Fed pivot towards easing policy sooner rather than later, which would be a significant tailwind for equities. The market's reaction will depend not only on the actual figures but also on how they align with or deviate from existing expectations. Traders will be dissecting these numbers for any hints about future interest rate decisions, with the potential for significant price swings in the Dow Jones Industrial Average.
Geopolitical Undercurrents: Iran Tensions and Market Sentiment
Beyond domestic economic data, geopolitical tensions, particularly surrounding Iran and the Strait of Hormuz, are adding another layer of complexity to the market environment. Escalating tensions in the Middle East can directly impact oil prices, with Brent crude currently trading at $113.97 and WTI at $116.14, both showing strong upward momentum. Higher oil prices can translate into broader inflationary pressures, complicating the Fed's inflation-fighting efforts and potentially leading to a risk-off sentiment in financial markets. This can manifest as increased demand for safe-haven assets like gold (currently at $4,657.80) and a corresponding sell-off in riskier assets such as equities, including the Dow Jones. The market's sensitivity to these geopolitical developments means that any significant escalation or de-escalation could trigger sharp price movements across various asset classes.
The current market sentiment appears to be a delicate balance between the anticipation of economic data and the underlying geopolitical risks. While the DXY shows dollar strength and oil prices are rising due to Middle East tensions, the broader equity markets present a mixed picture. For instance, the S&P 500 is showing a bullish trend on the 1-hour and 4-hour charts, despite a bearish daily trend, while the Nasdaq 100 exhibits a more cautious outlook with a bearish 1-hour trend. This complex sentiment landscape means that the Dow Jones could be susceptible to sharp moves in either direction based on news flow. The market is essentially trying to price in the potential for higher inflation driven by energy prices, while simultaneously assessing the Fed's reaction function and the overall global risk appetite.
The Path Forward: Scenarios and Probabilities
Bearish Scenario: Testing the Depths
This scenario anticipates a continuation of the bearish pressure evident in the daily technicals. The primary trigger for this outlook would be a decisive close below the key daily support level of $46,327.33. Such a move would likely be amplified by negative economic data, perhaps showing higher-than-expected inflation or a significant slowdown in job growth, reinforcing expectations of a hawkish Fed or an economic downturn. The ADX on the daily chart, already strong at 36.36, would likely continue to climb, indicating an accelerating downtrend. The RSI, currently at 45.44, would fall further into bearish territory, potentially below 40, while the MACD might confirm the bearish momentum with a widening gap between the MACD line and its signal line. The strong dollar, with DXY potentially pushing towards 100.18 or higher, would add further pressure.
Bearish Scenario: Downside Momentum Builds
65% ProbabilityBullish Scenario: A Reversal in the Making?
Conversely, the bullish scenario hinges on the ability of the Dow Jones to overcome immediate resistance levels and sustain upward momentum, likely fueled by more favorable economic data or a shift in Fed expectations. The trigger for this scenario would be a strong close above the daily resistance at $47,017.33. This move would need to be supported by positive economic news, such as inflation figures coming in cooler than expected or a less hawkish tone from the Federal Reserve minutes, potentially leading to a retreat in the DXY. The shorter timeframes (1H and 4H) already show some bullish strength, and a breakout above $47,017.33 could see these trends accelerate, potentially pushing the RSI towards overbought territory (above 70) and confirming the MACD's positive momentum. The Stochastic Oscillator on the daily chart, with %K above %D, could also provide a confirming bullish signal if it continues its upward trajectory.
Bullish Scenario: Breaking the Downside Bias
25% ProbabilityNeutral Scenario: Choppy Waters Ahead
Given the conflicting signals across different timeframes and the uncertainty surrounding upcoming economic data, a neutral, range-bound scenario remains a distinct possibility. In this case, the Dow Jones Industrial Average would likely continue to trade sideways, oscillating between the key support at $46,327.33 and resistance at $47,017.33. The weak ADX readings on the 1-hour and 4-hour charts support this view, indicating a lack of strong directional conviction in the short term. Price action might become choppy, characterized by smaller price swings and potentially 'stop hunts' as the market attempts to trap unwary traders on the wrong side of the eventual move. This scenario could persist until a significant economic catalyst forces a clear breakout in either direction. During such consolidation, traders might focus on shorter-term strategies, playing the range within the defined support and resistance boundaries, always with strict risk management in place.
Neutral Scenario: Range-Bound Consolidation
10% ProbabilityThe Trader's Perspective: Risk Management is Key
For traders observing the Dow Jones Industrial Average around $46,457, the overarching theme must be risk management. The conflicting signals from various indicators and timeframes, coupled with the uncertainty of upcoming economic data and geopolitical events, create a high-volatility environment. It's crucial to avoid chasing price and instead wait for clear confirmation of a directional bias. The strong ADX on the daily chart suggests that any trend continuation, either up or down, could be significant. Therefore, defining risk beforehand is paramount. This means setting appropriate stop-loss levels based on the key support and resistance zones discussed – below $46,327.33 for longs, and above $47,017.33 for shorts.
The provided market data shows a strong downtrend signal on the daily chart (ADX 36.36), yet shorter timeframes show weaker trends and some conflicting signals like the daily MACD's positive momentum against the RSI's bearish leanings. This complexity means that relying on a single indicator or timeframe is ill-advised. A prudent approach involves waiting for confluence – multiple signals aligning in the same direction. For example, a confirmed break above $47,017.33 accompanied by positive economic news and a weakening DXY would provide a much higher probability bullish setup than a simple price breach alone. Similarly, a clear break below $46,327.33, confirmed by falling inflation data and a rising DXY, would strengthen the bearish case. Patience and discipline in executing trades based on these confirmed setups are essential for navigating this uncertain market landscape.
Frequently Asked Questions: DowJones30 Analysis
What happens if DowJones30 breaks below the $46,327.33 support level?
A break below $46,327.33 on the daily chart would invalidate the neutral-to-bullish short-term sentiment and likely trigger a move towards the next support at $45,881.67. This scenario becomes more probable if accompanied by disappointing economic data or rising geopolitical tensions, reinforcing the daily chart's bearish trend.
Should I buy DowJones30 at current levels of $46,457 given the RSI is 45.44?
Buying at $46,457 with an RSI of 45.44 is a counter-trend move on the daily chart. While shorter timeframes show some strength, the daily RSI and ADX (36.36) suggest caution. A more prudent approach would be to wait for a confirmed break above $47,017.33 resistance or a test of lower support levels like $46,327.33, ideally with confirmation from other indicators.
Is the MACD's positive momentum on the daily chart a buy signal for DowJones30 at $46,457?
The daily MACD showing positive momentum is a conflicting signal against the bearish RSI (45.44) and strong daily ADX (36.36). While it hints at underlying buying interest, it requires confirmation. A true bullish signal would likely involve the MACD breaking above its signal line with increasing histogram values, coupled with price clearing resistance levels like $47,017.33.
How will upcoming US jobs and inflation data affect DowJones30 around $46,457?
Stronger-than-expected jobs data or accelerating inflation could pressure the Dow Jones around $46,457 by increasing Fed tightening expectations, potentially pushing DXY higher and equities lower. Conversely, weaker data might ease these concerns, providing a potential lift to the index if it signals a less aggressive Fed policy.
Track markets in real-time
AI-powered analysis, technical indicators and real-time price data.
Join Our Telegram Channel
Breaking market news, AI analysis and trading signals instantly.
Join Channel