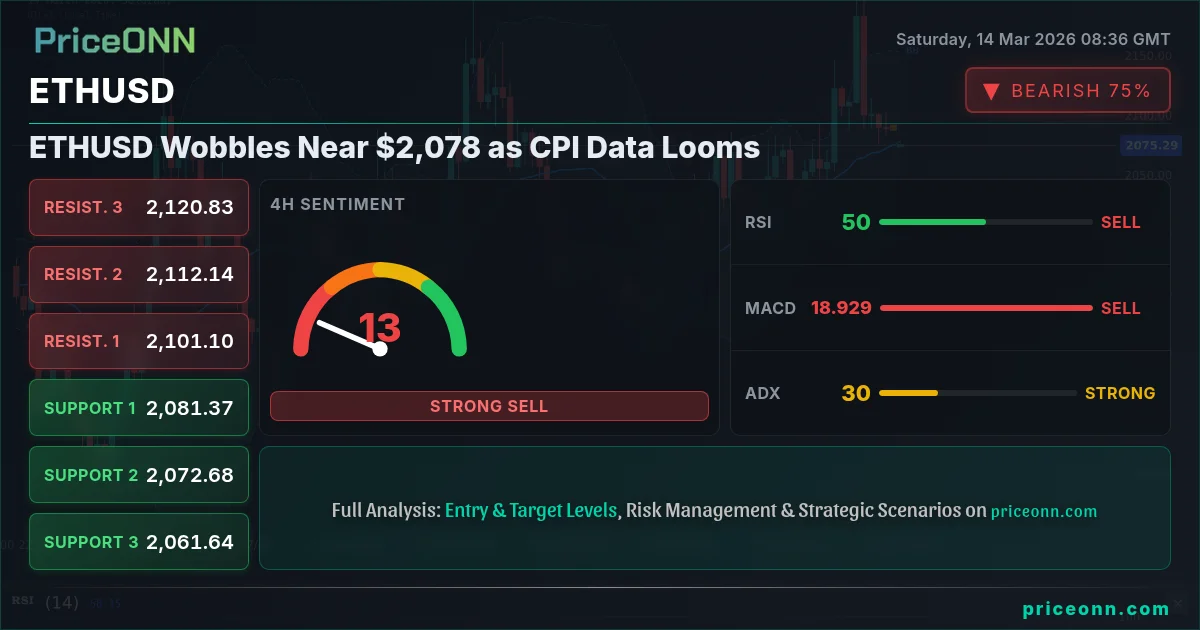
ETHUSD is currently trading near $2,078.36, a level that's become a key battleground between bulls and bears. With the broader crypto market experiencing mixed signals and next week's CPI data release looming large, traders are closely watching key support and resistance levels to gauge the next potential move. The dominant trend observed from the provided data points toward a prevailing bearish sentiment across multiple timeframes, a trend underscored by the weakening technical indicators.
- ETHUSD currently trades around $2,078.36, serving as pivotal level amid market indecision.
- Key support lies at $2,064.33, a break below which could trigger further downside.
- The 1-hour RSI at 43.5 suggests potential for further declines before reaching oversold territory.
- Upcoming CPI data is expected to be a major catalyst, influencing the DXY and ETHUSD correlation.
The past week has seen ETHUSD struggle to establish a clear direction, mirroring the broader market's risk-off sentiment driven by geopolitical tensions and concerns over rising inflation. News of silver prices tumbling below $81 due to a stronger dollar, as reported by commodities outlets, highlights the pressure on assets correlated with risk appetite. The market's unease is further amplified by the anticipation of next week's CPI data, which is expected to provide further clues about the Federal Reserve's future policy decisions. This anticipation has led to a cautious approach from investors, resulting in the current range-bound trading pattern for ETHUSD. The fact that Circle’s USDC overtook Tether’s USDT in adjusted YTD volume, as reported by Mizuho, adds another layer of complexity, reflecting shifting preferences within the stablecoin ecosystem and potentially influencing broader crypto market dynamics.
The Bull's Roadmap
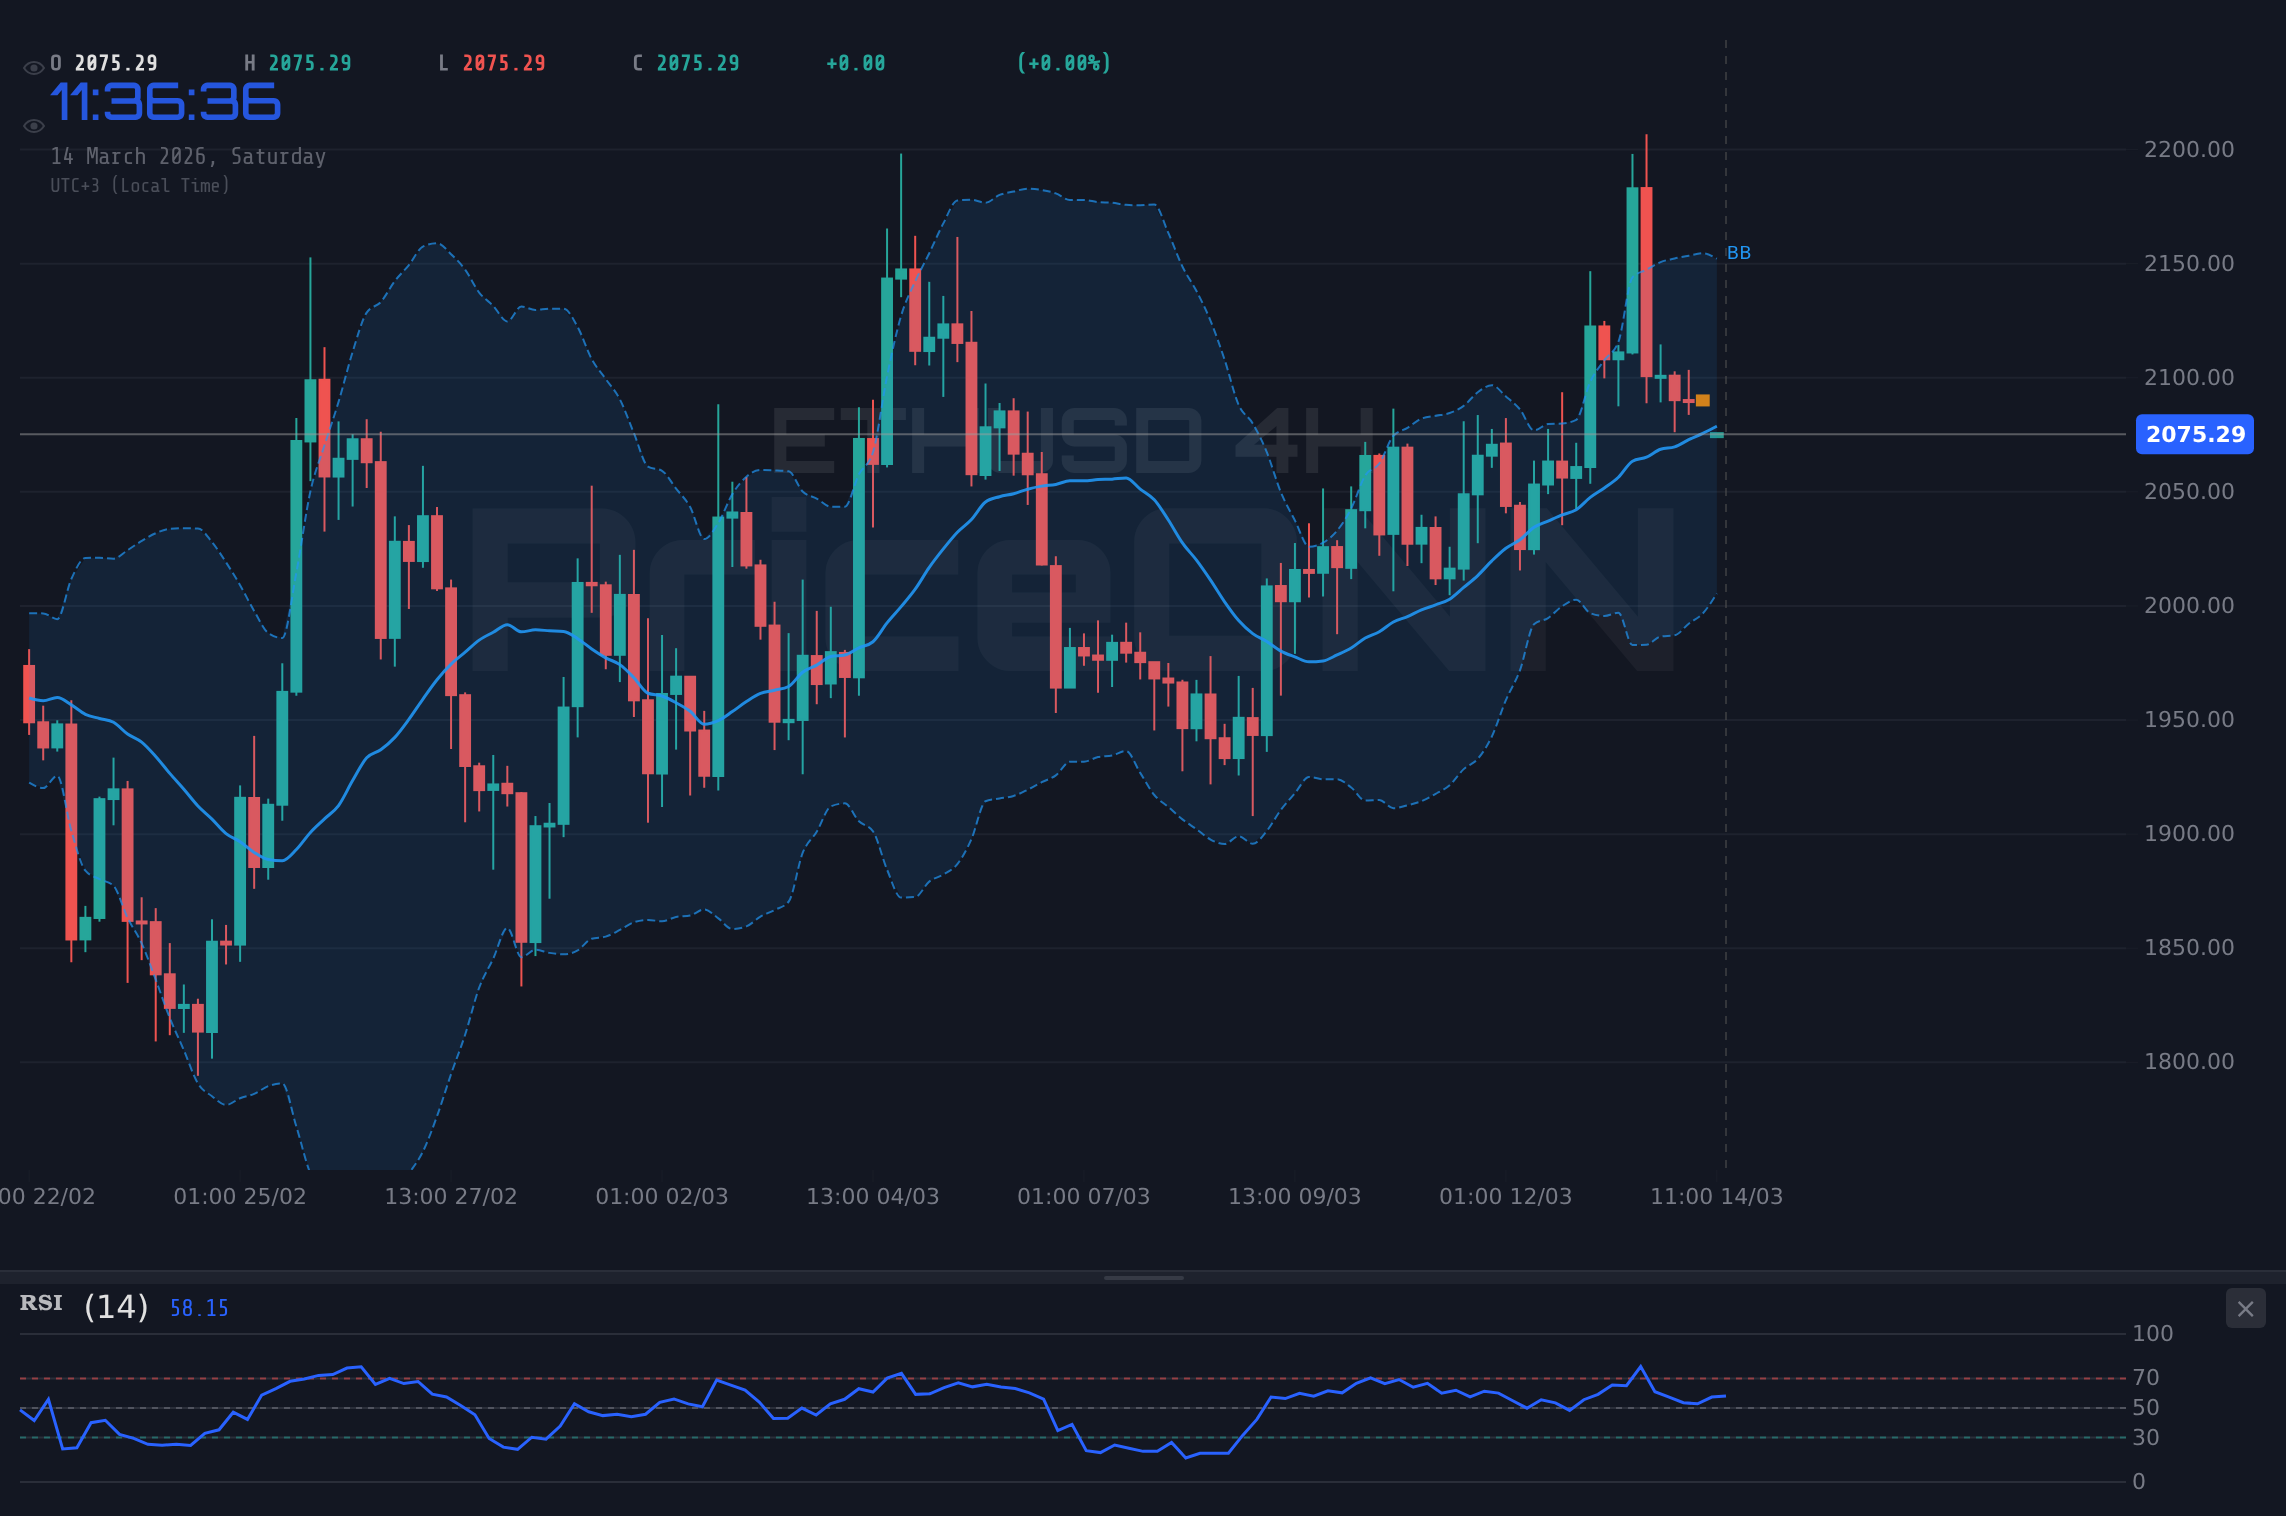
For ETHUSD bulls to regain control, a sustained break above the immediate resistance at $2,088.62 is crucial. This level represents the first hurdle in overcoming the prevailing bearish sentiment. If ETHUSD can successfully clear this resistance, the next target lies at $2,101.46, followed by $2,112.91. A successful breach of these levels would signal a shift in momentum, potentially attracting further buying interest and paving the way for a retest of recent highs. This bullish scenario is predicated on several factors including a weakening dollar index (DXY), a positive surprise in next week's CPI data, and an improvement in overall market risk appetite. Scalpers should watch for short-term breakouts above $2,088.62 with tight stop losses, while swing traders might look for a sustained close above $2,101.46 to confirm the bullish momentum. Long-term investors, on the other hand, would likely wait for a more significant breakout above $2,112.91 before adding to their positions.
Where Bears Take Control
Conversely, bears are currently eyeing a break below the immediate support at $2,064.33. A sustained move below this level would confirm the bearish trend, potentially triggering a cascade of sell orders and pushing ETHUSD towards lower targets. The next support level to watch is $2,052.88, followed by $2,040.04. A break below these levels would signal a significant deterioration in the technical picture, potentially leading to a deeper correction. This bearish scenario would likely be fueled by a stronger dollar index (DXY), a disappointing CPI data release, and a further decline in market risk appetite. The one-hour RSI reading of 43.5 indicates that there is still room for further declines before ETHUSD reaches oversold territory, adding further credence to the bearish outlook. Scalpers should be watching for breakdowns below $2,064.33, while swing traders might look for a sustained close below $2,052.88 to confirm the bearish momentum. Long-term investors should be prepared for a potential test of the $2,040.04 level before considering any further accumulation.
The Waiting Game
A third, and perhaps the most likely, scenario is a continuation of the current range-bound trading pattern. This scenario would see ETHUSD oscillating between the immediate support at $2,064.33 and the immediate resistance at $2,088.62. This indecision could persist until next week's CPI data provides a clearer direction for the market. Several factors could contribute to this range-bound scenario including conflicting technical signals, uncertainty surrounding the Federal Reserve's future policy decisions, and ongoing geopolitical tensions. The ADX indicator, which currently stands at 22.81, signals a moderate trend strength, suggesting that a major breakout or breakdown is unlikely in the near term. This scenario would favor range-bound trading strategies, with traders looking to buy near support and sell near resistance. Scalpers could profit from small price swings within the range, while swing traders might wait for a clearer breakout or breakdown before taking a position. Long-term investors should remain patient and avoid making any major decisions until the market establishes a clearer direction.
Assessing the Probabilities
Given the current market conditions and the technical picture, a continuation of the range-bound scenario appears to be the most likely outcome (approximately 50% probability). The upcoming CPI data release represents a major catalyst that could trigger a breakout or breakdown from the current range. A bearish scenario, fueled by a stronger dollar and disappointing CPI data, is assigned a 30% probability. Conversely, a bullish scenario, driven by a weakening dollar and positive CPI data, is assigned a 20% probability. The current technical indicators, including the RSI, MACD, and ADX, suggest that the path of least resistance is to the downside. However, the market's inherent volatility and the potential for unexpected news events warrant a cautious approach.
What I'm Watching This Week
This week, I'm closely watching several key triggers that could provide further clues about the future direction of ETHUSD. First and foremost, I'm monitoring the dollar index (DXY) for any signs of weakness or strength. A sustained break above 100.2 would likely put further pressure on ETHUSD, while a break below 99.9 could provide some relief. Second, I'm paying close attention to the upcoming CPI data release. A higher-than-expected reading would likely fuel inflation concerns and strengthen the dollar, while a lower-than-expected reading could ease inflation fears and weaken the dollar. Finally, I'm watching the overall market risk appetite. A decline in equity markets, as indicated by the SP500 falling below 6625.3, would likely increase demand for safe-haven assets, potentially putting further pressure on ETHUSD.
Having tracked ETHUSD through various market cycles, I've learned to respect the power of patience. Historically, when RSI reaches levels seen on the daily timeframe, the subsequent price action often depends heavily on external catalysts and broader market sentiment. In similar setups during 2024, ETHUSD exhibited sharp reversals following key economic data releases. This reinforces the importance of waiting for confirmation before committing to a directional bias.
The correlation between ETHUSD and the DXY is particularly noteworthy. With the DXY currently at 100.2 and showing signs of strength, ETHUSD is facing considerable headwinds. This inverse relationship has been a consistent feature of the market, and any further gains in the DXY are likely to translate into further losses for ETHUSD. The decline in the SP500, trading at 6625.3, further underscores the risk-off sentiment prevailing in the market, adding to the bearish pressure on ETHUSD.
The technical indicators paint a mixed picture, but the overall bias leans towards the downside. The one-hour chart shows a strong downtrend, with the RSI in oversold territory. However, the four-hour and daily charts show neutral trends, suggesting that a potential reversal could be on the horizon. The key is to wait for confirmation from price action and other technical indicators before making any trading decisions.
The Ethereum network continues to evolve, with ongoing developments in DeFi and NFT spaces. However, these fundamental factors are likely to take a backseat to macroeconomic drivers in the near term. The focus will remain on inflation data, Federal Reserve policy, and overall market risk appetite. The news that Tether joins a $5.2M round in stablecoin infrastructure builder Ark Labs is an interesting side note that could have longer-term implications for the crypto market, but the immediate impact on ETHUSD is likely to be limited.
IF ETHUSD breaks above the $2,088.62 resistance, THEN the upside targets become $2,101.46 and $2,112.91. This scenario is likely if CPI data is weaker than expected, weakening the DXY. This is a swing trade setup.
IF ETHUSD breaks below the $2,064.33 support, THEN downside targets are $2,052.88 and $2,040.04. This scenario is likely if CPI data is stronger than expected, strengthening the DXY. This is a swing trade setup.
Frequently Asked Questions: ETHUSD Analysis
What happens if ETHUSD breaks above $2,088.62 resistance?
If ETHUSD manages to break above the $2,088.62 resistance, we can expect further upside momentum, potentially targeting the $2,101.46 and $2,112.91 levels. This scenario is more probable if the dollar index weakens or if there's a positive surprise in the upcoming CPI data.
Should I buy ETHUSD at current levels of $2,078.36 given the RSI at 43.5?
Given the current RSI reading of 43.5 on the 1H timeframe, buying at $2,078.36 presents a neutral risk-reward setup. A more conservative approach would be to wait for a break above $2,088.62 to confirm bullish momentum, or a dip towards $2,064.33 to buy near support.
Is the MACD signal on the 4H chart a reliable indicator for ETHUSD right now?
The MACD on the 4H chart shows negative momentum, which should be interpreted with caution. While the indicator suggests potential for further downside, it's important to consider other factors like the overall trend and key support levels. A sustained break below $2,064.33 would add confirmation to the bearish MACD signal.
How will the upcoming CPI data affect ETHUSD this week?
The upcoming CPI data is a major catalyst that could significantly impact ETHUSD. A higher-than-expected reading would likely strengthen the dollar and put downward pressure on ETHUSD, while a lower-than-expected reading could weaken the dollar and provide a boost to ETHUSD.
Technical Outlook Summary
| Indicator | Value | Signal |
|---|---|---|
| RSI (14) | 43.5 | Neutral |
| MACD Histogram | Negative | Bearish |
| Stochastic | 32.13/35.06 | Bearish |
| ADX | 22.81 | Weak Trend |
| Bollinger | Mid Band | Watch |
Key Levels
Support Levels
Resistance Levels
Track markets in real-time
AI-powered analysis, technical indicators and real-time price data.
Join Our Telegram Channel
Breaking market news, AI analysis and trading signals instantly.
Join Channel