

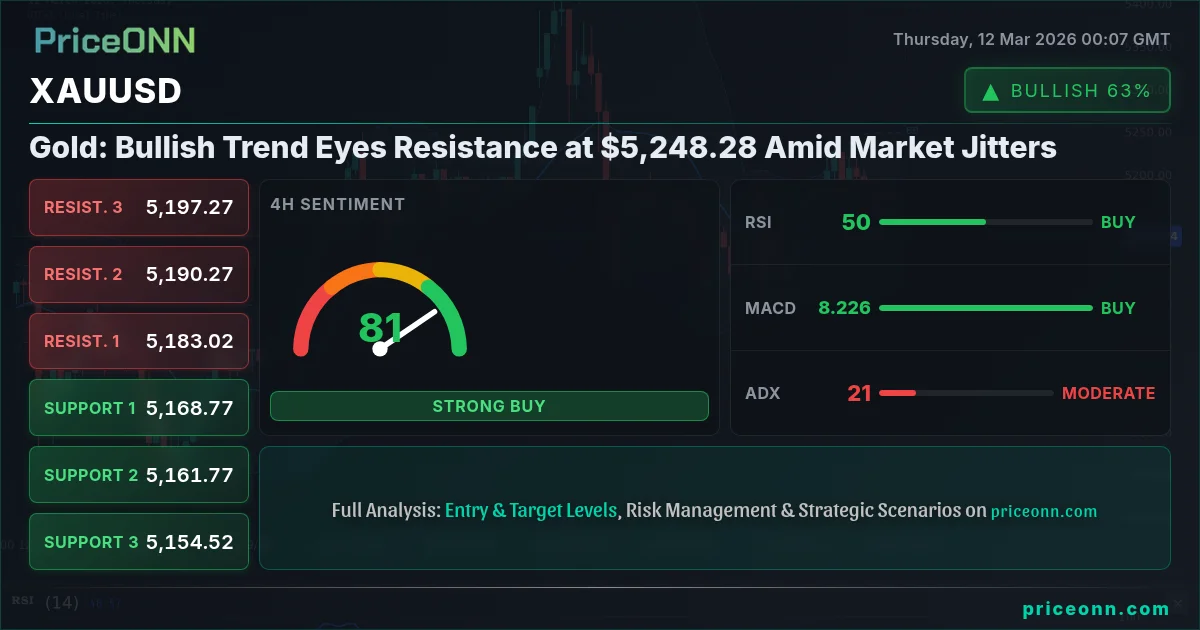
The surge in crude oil prices, with WTI eyeing $90 amid escalating geopolitical tensions, is stoking fears of inflation and subsequently impacting the demand for safe-haven assets like gold. As market participants grapple with these uncertainties, XAUUSD is currently trading at $5,133.26, navigating a complex landscape influenced by dollar strength and fluctuating risk sentiment.
- RSI at 33.28 on the 1H chart signals potential oversold conditions, but bearish momentum persists.
- Critical support lies at $5,118.33, a break below which could trigger further downside.
- MACD histogram shows negative momentum, indicating that the bears are still in control.
- DXY strength, currently at 99.23, continues to exert downward pressure on XAUUSD.
Having tracked XAUUSD through the 2024 rate cycle, it's evident that gold's movements are intricately linked to both real interest rates and geopolitical stability. The current market setup presents a fascinating interplay of these factors, with the dollar index (DXY) playing a pivotal role. As the DXY strengthens to 99.23, it exerts downward pressure on gold, making it more expensive for holders of other currencies. This inverse correlation is a key consideration for traders navigating the current market conditions.
From a technical perspective, the 1-hour chart presents a neutral trend, but with a bearish undertone. The RSI at 33.28 suggests the asset is approaching oversold territory, but with the MACD still showing negative momentum, any potential reversal may be short-lived. Traders should pay close attention to the support level at $5,118.33. A break below this level could open the door for further downside, targeting the next support at $5,097.74. Conversely, immediate resistance is seen at $5,170.83, a level that bulls need to overcome to regain control.
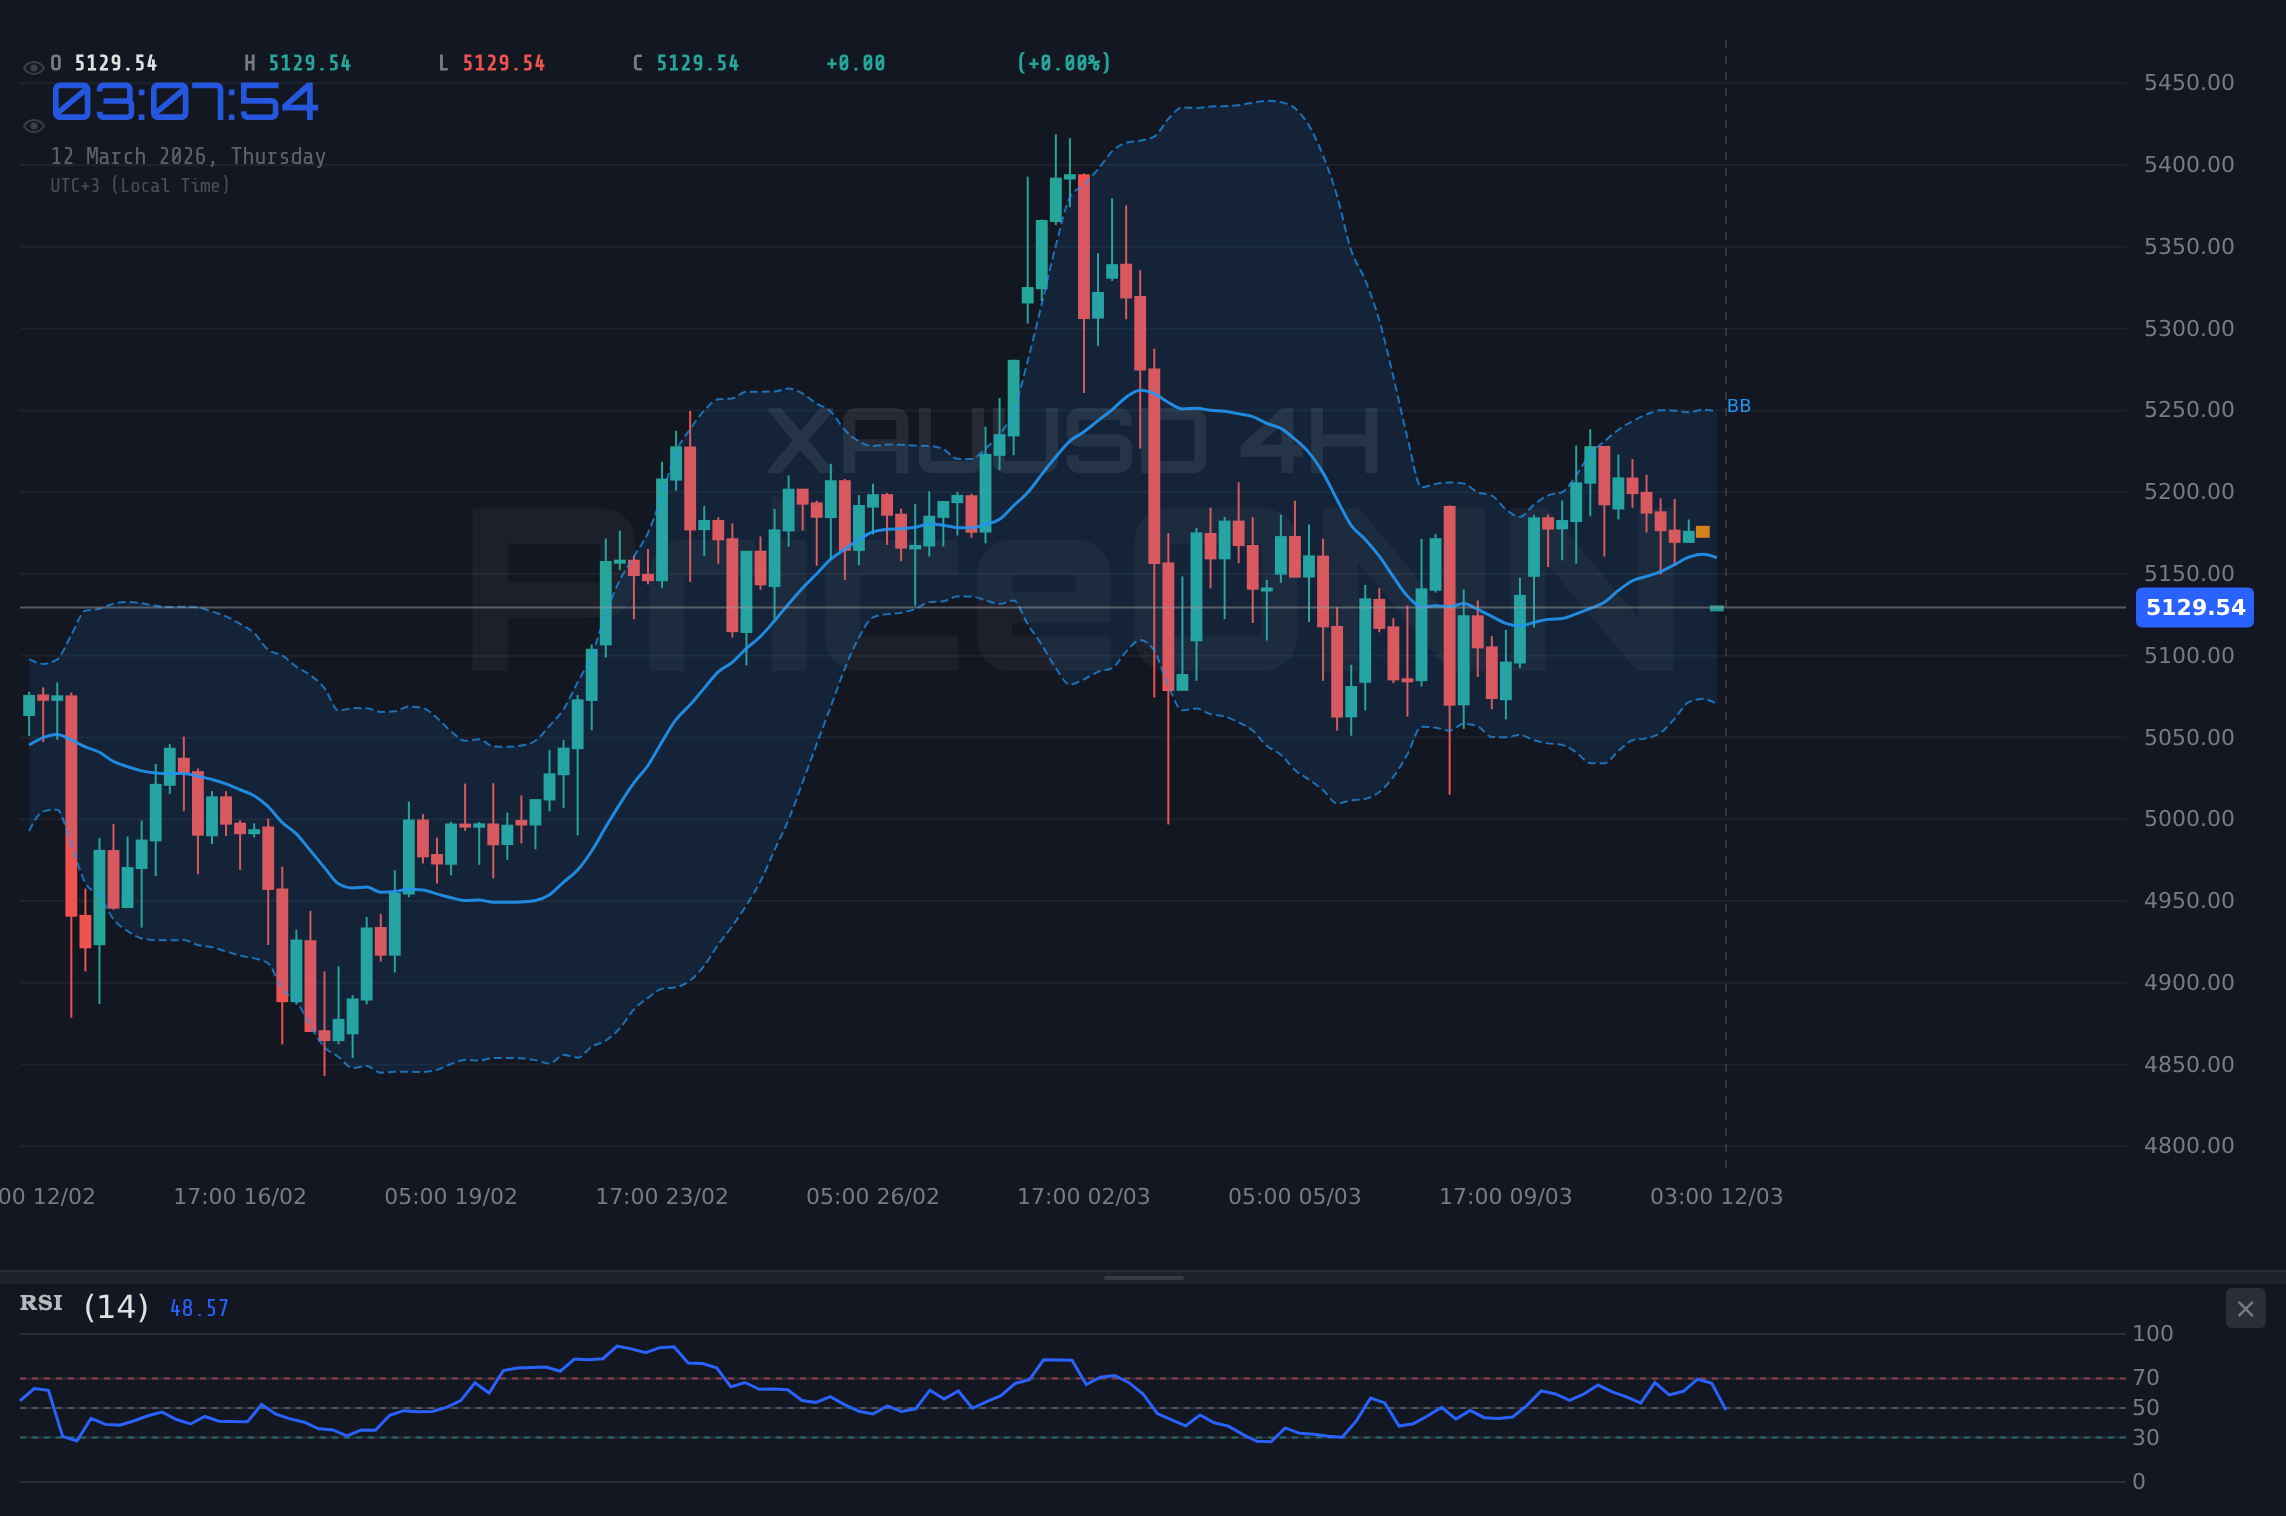
On the 4-hour timeframe, the trend shifts to bearish with 81% strength, reinforcing the short-term downward bias. The RSI at 45.35, while not yet oversold, indicates that the bears are firmly in control. Key levels to watch on this timeframe include support at $5,151.02 and resistance at $5,192.03. A decisive break below the support could accelerate the decline, while a move above the resistance would signal a potential trend reversal. For swing traders, patience is key. Waiting for a confirmed breakout or breakdown could provide a higher-probability entry point.
The daily chart paints a slightly different picture, with an overall bullish trend at 76% strength. However, it's crucial to note that the MACD is currently showing negative momentum, suggesting that the bullish trend may be losing steam. Key levels on this timeframe include support at $5,127.15 and resistance at $5,248.28. Long-term investors should view any pullback towards the support level as a potential buying opportunity, while keeping a close eye on the resistance as a key level to overcome for further upside.
One of the most recent breaking news stories is that crude oil prices are edging higher, eyeing the $90 mark, as geopolitical tensions involving Iran raise concerns about Eurozone stability. This is particularly relevant to gold, as rising oil prices tend to fuel inflation expectations, increasing demand for gold as an inflation hedge. This dynamic adds another layer of complexity to the XAUUSD analysis and should be closely monitored by market participants.
Historically, gold has served as a safe haven during times of economic uncertainty and geopolitical turmoil. Looking back at past instances of similar market conditions, we can observe that gold tends to outperform other asset classes when risk appetite declines. However, it's important to remember that past performance is not indicative of future results, and each market cycle presents its own unique challenges and opportunities. Currently, with the SP500 showing a daily decline of -1.04% and Nasdaq100 dropping -0.92%, the risk-off sentiment is clearly present and could support gold prices, as investors seek safer havens.
For scalpers, the key is to focus on the intraday volatility and capitalize on short-term price movements. With the ADX at 26.39 on the 1-hour chart, indicating a strong downtrend, scalpers may look for opportunities to short gold on any rallies towards resistance levels. However, it's crucial to manage risk effectively and use tight stop losses, as sudden reversals can occur in volatile market conditions. The Stochastic Oscillator, with K=25.16 and D=45.95, suggests potential oversold conditions, which could lead to a short-term bounce.
Swing traders should focus on the 4-hour timeframe, where the trend is bearish and the ADX is at 21.04, indicating a moderate downtrend. Waiting for a confirmed breakdown below the support at $5,151.02 could provide a high-probability entry point for a short position. Conversely, a move above the resistance at $5,192.03 would signal a potential trend reversal and could present an opportunity to go long. Risk management is paramount, and traders should always use appropriate stop-loss orders to protect their capital.
Long-term investors should take a broader view and focus on the daily chart, where the trend is bullish but showing signs of weakening. Any pullback towards the support level at $5,127.15 should be seen as a potential buying opportunity, as gold is likely to retain its value in the long run as a hedge against inflation and economic uncertainty. However, it's important to diversify your portfolio and not put all your eggs in one basket. The next resistance is at $5,248.28, which needs to be breached for further bullish momentum.
From an economic perspective, market participants are keenly awaiting the upcoming economic data releases, particularly the USD events scheduled for Friday, March 13. These include data related to employment and consumer sentiment, which could have a significant impact on the dollar and, consequently, on gold prices. Any weakness in the US economy could lead to a weaker dollar and higher gold prices, while stronger-than-expected data could have the opposite effect.
Trading gold involves significant risk and may not be suitable for all investors. Always use appropriate risk management techniques and never risk more than you can afford to lose. Be aware of the potential for sudden and unexpected price movements, and always use stop-loss orders to protect your capital.
Frequently Asked Questions: XAUUSD Analysis
What happens if XAUUSD breaks above $5,248.28 resistance?
If XAUUSD manages to decisively break above the $5,248.28 resistance level on the daily chart, it would signal a continuation of the bullish trend and open the door for further upside. The next resistance levels to watch would be $5,303.93 and $5,369.41.
Should I buy XAUUSD at current levels of $5,133.26 given the neutral RSI?
With the RSI at 53.03 on the daily chart, the market is neither overbought nor oversold, so caution is warranted. A potential buying opportunity may arise if the price pulls back towards the $5,127.15 support level, offering a better risk-reward ratio. Risk management is key in this scenario.
Is the negative MACD histogram a sell signal for XAUUSD right now?
The negative MACD histogram indicates bearish momentum on the daily chart, but it's essential to consider the overall bullish trend. It might suggest that the bullish trend is losing steam, but it doesn't necessarily mean it's time to sell. Look for confirmation from other indicators before making a decision.
How will the upcoming USD employment data affect XAUUSD this week?
The upcoming USD employment data could have a significant impact on XAUUSD. Stronger-than-expected data could lead to a stronger dollar and lower gold prices, while weaker-than-expected data could have the opposite effect. Market participants will be closely watching these releases.
Volatility creates opportunity-those prepared will be rewarded. By understanding the interplay of technical indicators, fundamental drivers, and geopolitical risks, traders can navigate the XAUUSD market with confidence and discipline. Remember, risk management is paramount, and patience is often rewarded.
Technical Outlook Summary
| Indicator | Value | Signal |
|---|---|---|
| RSI (14) | 53.03 | Neutral |
| MACD Histogram | Negative | Bearish |
| Stochastic | 37.27/36.44 | Bullish |
| ADX | 12.08 | Weak Trend |
| Bollinger | Middle Band | Watch |
Key Levels
Support Levels
Resistance Levels
Track markets in real-time
AI-powered analysis, technical indicators and real-time price data.
Join Our Telegram Channel
Breaking market news, AI analysis and trading signals instantly.
Join Channel