WTI Crude Oil Tests $104.78 Resistance; Key Levels and Market Sentiment Analyzed
WTI crude oil is challenging resistance at $104.78 amidst a strong uptrend. Explore key levels, technical signals, and market drivers shaping the outlook.
West Texas Intermediate (WTI) crude oil is currently trading at $99.28, showing a notable upward momentum with a 1.09% gain on the day, reaching up to $104.97. This surge places WTI firmly in bullish territory, particularly on the 1-hour and 4-hour charts, where the trend strength is rated at 97% and 96% respectively. The daily chart also exhibits a strong bullish trend (100% strength), with the price consolidating above the $99.28 mark. This upward movement is occurring within a broader context of rising energy prices, with Brent crude also showing strength, trading at $104.78. The market is keenly watching whether WTI can sustain its climb past the immediate resistance levels, especially as geopolitical tensions and supply-side dynamics continue to influence price action.
- WTI crude oil is trading at $99.28, with strong bullish momentum on 1H and 4H charts (97% and 96% trend strength).
- The critical resistance level to watch is $105.62 on the 1H chart, a break above which could target $106.28.
- On the daily chart, RSI at 82.92 signals extreme overbought conditions, suggesting a potential for pullback or consolidation.
- Geopolitical factors, particularly Middle East tensions and supply disruptions, are underpinning current oil prices.
The current price action for WTI crude oil at $99.28 presents an intriguing picture for traders and analysts. After a significant daily move of $1.13, pushing the price towards the upper end of its daily range ($96.61 - $104.97), the market is clearly in a bullish phase. The 1-hour and 4-hour timeframes both indicate strong upward trends, suggesting immediate buying pressure. However, the daily chart's reading of 100% trend strength, coupled with an RSI of 82.92, raises a flag for potential overheating. This suggests that while the trend is undeniably bullish, the market might be approaching a point where consolidation or a short-term correction could occur before the next significant move. Understanding the confluence of technical signals and underlying fundamental drivers is crucial for navigating this environment.
Navigating the Bullish Momentum: Technical Indicators in Focus
On the 1-hour timeframe, WTI's trend is overwhelmingly bullish, showing 97% strength. The price is trading above the middle Bollinger Band, which is expanding upwards, indicating increasing volatility and upward momentum. The Stochastic Oscillator is in overbought territory, with the %K line at 95.23 and %D line at 89.83, suggesting that the buying pressure might be reaching a crescendo. However, the ADX at 23.88 indicates a medium-strength trend, which might suggest that while the direction is clear, the conviction behind the move isn't yet at extreme levels. The RSI at 68.89 also points to a strong bullish sentiment but is not yet in the fully overbought zone, leaving some room for upward continuation. Immediate support on this timeframe is seen at $103.94, $103.28, and $102.77, while resistance lies at $105.11, $105.62, and $106.28. The overall signal for the 1-hour chart leans heavily towards 'BUY' (7 buys, 1 sell, 0 neutral), reinforcing the short-term bullish bias.
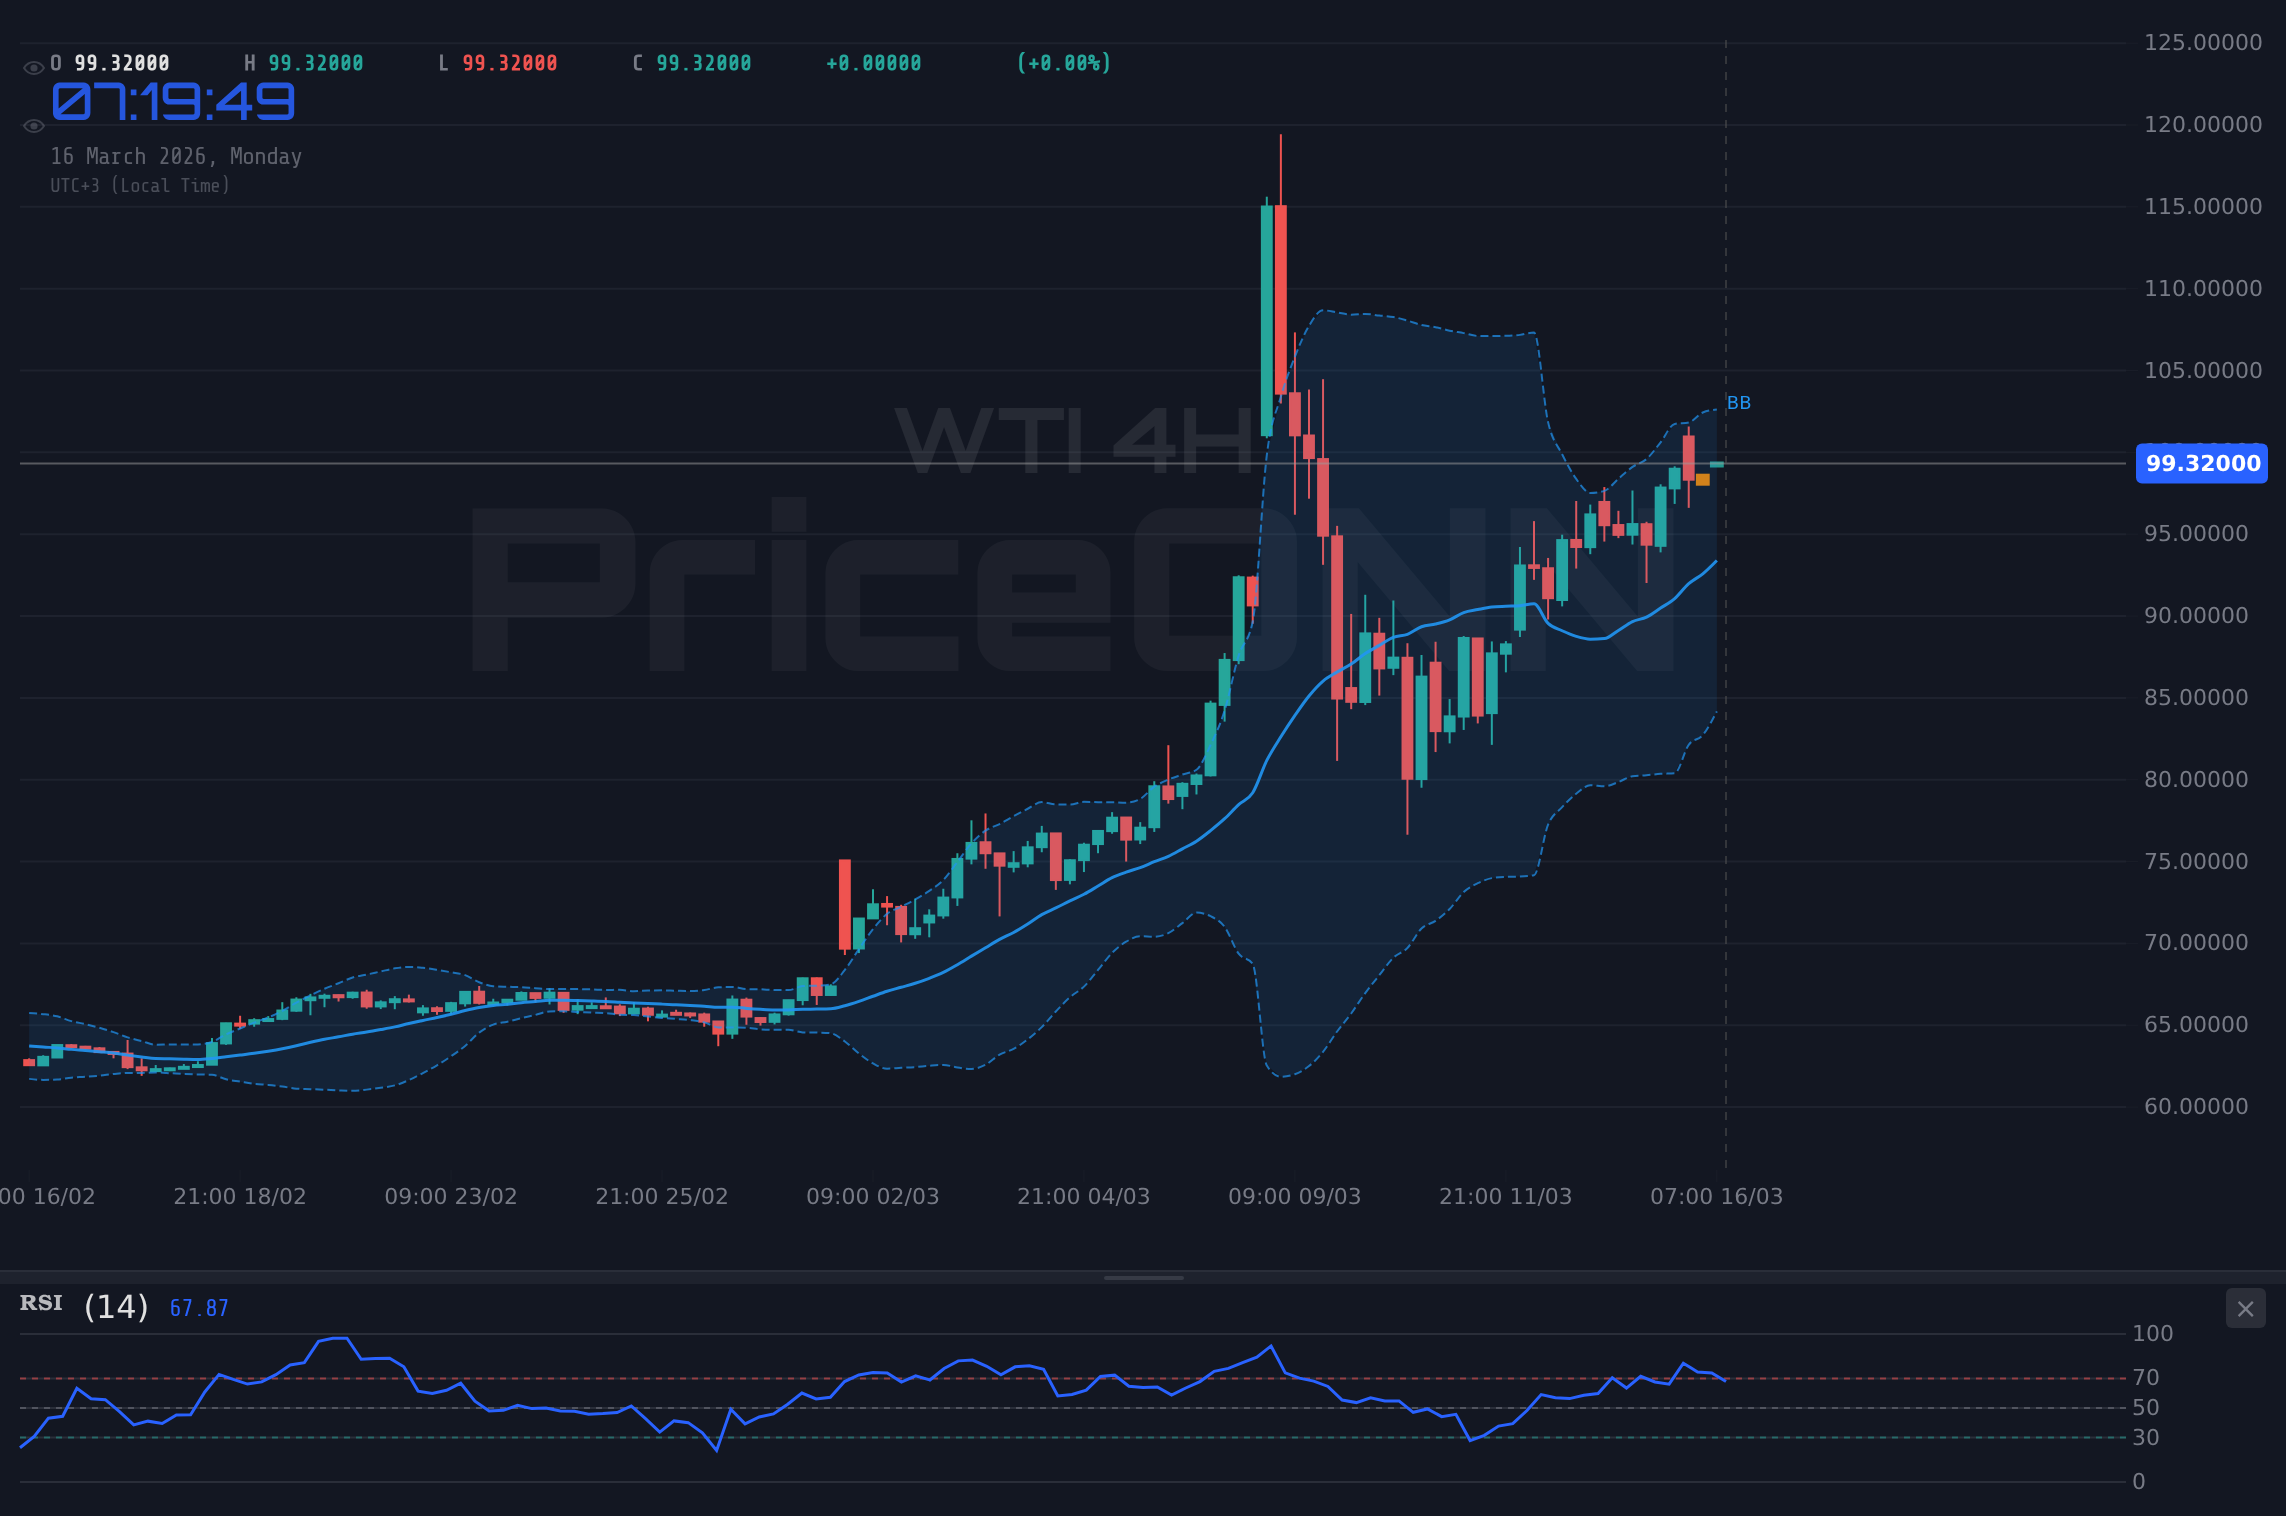
Shifting to the 4-hour chart, the bullish trend remains robust with 96% strength. WTI is comfortably trading above the middle Bollinger Band, which continues to slope upwards. The Stochastic Oscillator here is even more pronouncedly in overbought territory, with %K at 98.71 and %D at 85.6. This extreme reading suggests that the market may be due for a pause or reversal soon. The ADX at 22.08 confirms a medium-strength uptrend. The RSI reading of 63.2 sits in the upper half of the neutral zone, indicating strong upward momentum without being excessively overbought yet on this timeframe. Support levels are identified at $102.29, $100.94, and $100.2, while resistance is marked at $104.38, $105.12, and $106.47. The 4-hour chart also shows a strong 'BUY' signal (7 buys, 1 sell, 0 neutral), aligning with the short-term bullish outlook but with a stronger caution on the overbought Stochastic.
The daily perspective provides the most critical context. WTI's trend strength is at a perfect 100%, and the price is trading well above the middle Bollinger Band, which is widening and trending upwards. The RSI stands at a very high 87.83, firmly in the overbought zone. This indicates that the price has moved up significantly and rapidly, and a pullback or consolidation is statistically more probable. The Stochastic Oscillator shows %K at 60.21 and %D at 56.44, indicating a potential upward move but also showing signs of slowing momentum. However, the ADX at 57.84 signals a VERY STRONG uptrend, suggesting that despite the overbought RSI, the momentum behind the move is substantial and could continue to push prices higher before any significant reversal. The key daily support levels are $99.61, $95.58, and $93.5, while resistance is seen at $105.72, $107.8, and $111.83. The daily chart's 'BUY' signal (7 buys, 1 sell, 0 neutral) underscores the dominant bullish trend, even with the stark overbought RSI reading.
The extreme RSI reading of 87.83 on the daily chart is a significant warning sign. While the trend is strongly bullish, historical data suggests that such high RSI levels often precede price corrections. Traders should be mindful of this potential for a pullback, even as shorter timeframes show continued strength.
The MACD indicator also reinforces the bullish sentiment across all observed timeframes. On the 1-hour chart, the MACD histogram is positive and above the signal line, indicating bullish momentum. The 4-hour chart shows a similar pattern, with the MACD line firmly above the signal line and the histogram in positive territory. Even on the daily timeframe, the MACD is positive and trending upwards, suggesting that the underlying bullish momentum is still intact. This confluence of bullish MACD signals across different timeframes adds another layer of confirmation to the current uptrend. However, it's crucial to remember that indicators are lagging, and extreme readings, like the daily RSI, should not be ignored. The ADX values, particularly the very strong 57.84 on the daily chart, indicate that the current trend has significant power and is unlikely to reverse on a whim. This suggests that any pullback might be a correction within a larger uptrend rather than a full-blown reversal.
The MACD histogram on the 1-hour chart is positive, showing increasing bullish momentum. On the 4-hour chart, the MACD is also positive, reinforcing the upward move. However, on the daily chart, while the MACD is positive, its histogram has begun to narrow slightly, hinting at a potential deceleration in the pace of the rally. This divergence between shorter-term bullish signals and a slight daily MACD slowdown is a subtle but important point. It suggests that while the immediate pressure is to the upside, the very long-term strength might be plateauing, warranting a closer look at price action around key resistance levels.
Fundamental Undercurrents: Geopolitics and Supply Dynamics
The current rally in WTI crude oil is not solely driven by technical factors. Geopolitical tensions in the Middle East remain a significant underpinning factor. Reports indicate ongoing disruptions in the Strait of Hormuz and concerns over Qatar's LNG production halt, which indirectly impact the broader energy market sentiment. While one news item suggests WTI crude oil might rebound to $90 if the Iran war ends, this is juxtaposed against persistent supply chain issues. The fact that WTI is trading near resistance at $104.78, and indeed is currently priced at $99.28, indicates that these supply concerns are more dominant in the current market narrative than any potential de-escalation in regional conflicts. The market appears to be pricing in a continued supply tightness, which is supporting prices despite the strong daily RSI readings.
Furthermore, news regarding Saudi Arabia scaling back its ambitious NEOM project due to rising costs, with estimates now reaching $9 trillion, adds another layer to the fundamental picture. While a project of this magnitude could eventually impact future oil demand, its current revision suggests potential economic pressures or a strategic re-evaluation within Saudi Arabia. This might indirectly influence their production decisions or investment in future capacity, although the immediate impact on current supply is likely minimal. The focus remains on immediate supply and demand balances. The market seems to be factoring in the current tight supply situation, potentially overshadowing long-term demand projections influenced by large-scale infrastructure projects.
The correlation analysis with the US Dollar Index (DXY) and broader equity markets also provides valuable context. The DXY is currently trading at 99.93, showing a slight daily decline of 0.14%. On the daily chart, the DXY is in a strong uptrend (96% strength) with RSI at 71.46 in overbought territory, suggesting potential for a pullback in the dollar. Historically, a weaker dollar often correlates with higher oil prices as oil is priced in dollars. If the DXY experiences a correction, it could provide additional tailwind for WTI. Conversely, the S&P 500 (SP500) is showing a bullish move, currently at 6668.45 with a 0.66% gain. However, its 4-hour and daily charts indicate a downtrend (90% and 100% strength respectively), with RSI readings in the 40s. This mixed picture in equities suggests that risk appetite might be wavering despite the intraday gains, which could cap oil's upside if broader market sentiment turns negative. A risk-off environment typically supports safe-haven assets and can pressure commodities.
The economic calendar shows that on Friday, March 13th, 2026, several high-impact events occurred for GBP and USD. While the actual results are not provided, the previous data for USD included figures like 4.3% and 3% for unspecified indicators, and 6.542 for another. Without the actual and forecast numbers for these events, it's difficult to ascertain their precise impact. However, the fact that these were high-impact releases suggests they likely influenced market sentiment and currency valuations around that time. Upcoming economic data will be critical in shaping the outlook for oil prices, particularly any indicators related to inflation, growth, and employment in major economies. Central bank policy expectations, especially from the Federal Reserve, will also play a crucial role in dollar strength and, consequently, oil price dynamics.
The interplay between geopolitical supply disruptions and potential demand shifts due to global economic conditions creates a complex environment for WTI. While technicals suggest an overbought condition on the daily chart, fundamental factors continue to support upward price pressure.
Considering the overall market sentiment, the strong bullish trend in WTI is undeniable, supported by both technical indicators showing upward momentum and fundamental factors like supply concerns in the Middle East. However, the extreme overbought readings on the daily RSI (87.83) and the very strong ADX (57.84) suggest that the market might be due for a period of consolidation or a minor correction. The key levels to watch are the immediate resistance at $105.62 and $106.28 on the 1-hour chart, and the critical daily resistance at $105.72. A sustained break above these levels could signal a continuation of the rally, potentially targeting higher grounds. Conversely, a failure to break higher and a close below the daily support at $99.61 could indicate the start of a pullback, with the next significant support at $95.58.
The current price of $99.28 for WTI crude oil places it just below the psychological $100 mark, but more importantly, it is approaching significant resistance zones identified across multiple timeframes. The daily chart resistance at $105.72 is a crucial level. A break above this could open the door to further upside, potentially towards $107.80. On the shorter timeframes, resistance is seen at $105.11 and $105.62 (1H), and $104.38 and $105.12 (4H). The fact that the price is currently trading near these levels, combined with the overbought daily RSI, creates a scenario where a short-term pause or reversal is plausible. Traders will be looking for confirmation, perhaps a decisive close above $105.72, to signal a continuation of the bullish trend, or a breakdown below daily support around $99.61 to indicate a potential correction.
Forecasting the Next Move: Scenarios and Outlook
Looking ahead, the WTI crude oil market is at a critical juncture. The dominant bullish trend, supported by strong technical signals on shorter timeframes and fundamental supply concerns, suggests further upside potential. However, the extremely overbought conditions on the daily RSI (87.83) cannot be ignored. This creates a scenario where we could see a period of consolidation or a minor pullback before the uptrend resumes, or alternatively, a strong breakout above key resistance levels that validates the bullish momentum.
Bullish Scenario: If WTI successfully breaks and holds above the daily resistance at $105.72, this would invalidate short-term overbought signals and confirm the continuation of the uptrend. The immediate target would be the next resistance level at $107.80. This scenario is more likely if geopolitical tensions remain elevated or if upcoming economic data points towards sustained global demand. The ADX reading of 57.84 on the daily chart suggests that if a breakout occurs, it could be powerful and sustained.
Bearish Scenario: Conversely, if WTI fails to break above the $105.72 resistance and starts to pull back, the first significant support level to watch is $99.61. A decisive break below this level could trigger further downside, targeting the next support at $95.58. This scenario becomes more probable if the DXY strengthens significantly, or if there are signs of easing geopolitical tensions that reduce the risk premium in oil prices. The extremely high RSI also supports the possibility of a reversal if key support levels give way.
Given the current data, the immediate outlook remains cautiously bullish, with a strong emphasis on the key resistance levels. While the trend is strongly upward, the overbought daily RSI suggests traders should exercise caution and look for confirmation before entering new long positions. Patience may be rewarded as the market digests the current price action around resistance. The $99.28 price point is currently testing short-term resistance, and its ability to push through $104.78 and hold above $105.62 will be critical in determining the next phase of price discovery.
| Indicator | Value | Signal | Interpretation |
|---|---|---|---|
| RSI (14) | 87.83 | Bearish | Daily RSI extremely overbought, suggests potential pullback. |
| MACD | Positive | Bullish | MACD line above signal line, positive histogram indicates bullish momentum. |
| Stochastic | K:60.21, D:56.44 | Bullish | %K above %D, but slowing momentum may indicate consolidation soon. |
| ADX | 57.84 | Strong Trend | Very strong uptrend indicated, suggesting momentum could continue despite overbought RSI. |
| Bollinger Bands | Upper Band | Bullish Breakout | Price trading above upper band, confirming strong upward momentum. |
Frequently Asked Questions: WTI Analysis
What happens if WTI breaks above $105.72 resistance?
A sustained break above the daily resistance at $105.72 would confirm the continuation of the bullish trend. This could open the door for further upside, targeting the next key level at $107.80, especially if geopolitical supply concerns persist.
Should I buy WTI at current levels of $99.28 given the daily RSI at 87.83?
Buying at $99.28 requires caution due to the extremely overbought daily RSI of 87.83. While shorter timeframes show bullish momentum, a pullback is probable. A more prudent approach might be to wait for a confirmed break above $105.72 or a dip towards support levels like $99.61 for a better risk-reward ratio.
Is the ADX at 57.84 a buy signal for WTI right now?
An ADX of 57.84 indicates a very strong uptrend, which is a bullish signal in itself. However, it must be considered alongside other indicators. While it confirms the strength of the current move, the extremely high RSI suggests that this strong trend might be nearing a point of exhaustion or consolidation.
How will ongoing Middle East tensions affect WTI prices this week?
Elevated geopolitical tensions in the Middle East continue to support WTI prices by adding a risk premium related to potential supply disruptions. If these tensions escalate or persist, they are likely to keep upward pressure on oil prices, potentially aiding WTI's push towards higher resistance levels.
The market remains dynamic, and while the technical picture for WTI at $99.28 currently favors the bulls, the significant overbought conditions on the daily chart warrant attention. Patience and risk management are paramount. Monitoring the price action around the $105.72 resistance level will be key. A successful breach could extend the rally, while a failure might lead to a much-needed correction. Ultimately, disciplined trading, guided by both technicals and fundamentals, will be the most effective strategy in navigating these potentially volatile energy markets.
Track markets in real-time
AI-powered analysis, technical indicators and real-time price data.
Join Our Telegram Channel
Breaking market news, AI analysis and trading signals instantly.
Join Channel