Have you ever watched silver's price action and felt like you're on a rollercoaster? Today, XAGUSD is testing traders' nerves, currently priced at $84.49. The question is, will this key support level hold, or are we headed for further declines? Understanding the forces at play is crucial for making informed trading decisions. The current silver price XAG/USD is influenced by a complex interplay of factors, ranging from the dollar's strength to geopolitical tensions. Let's delve into what's driving this price movement and what traders should watch.
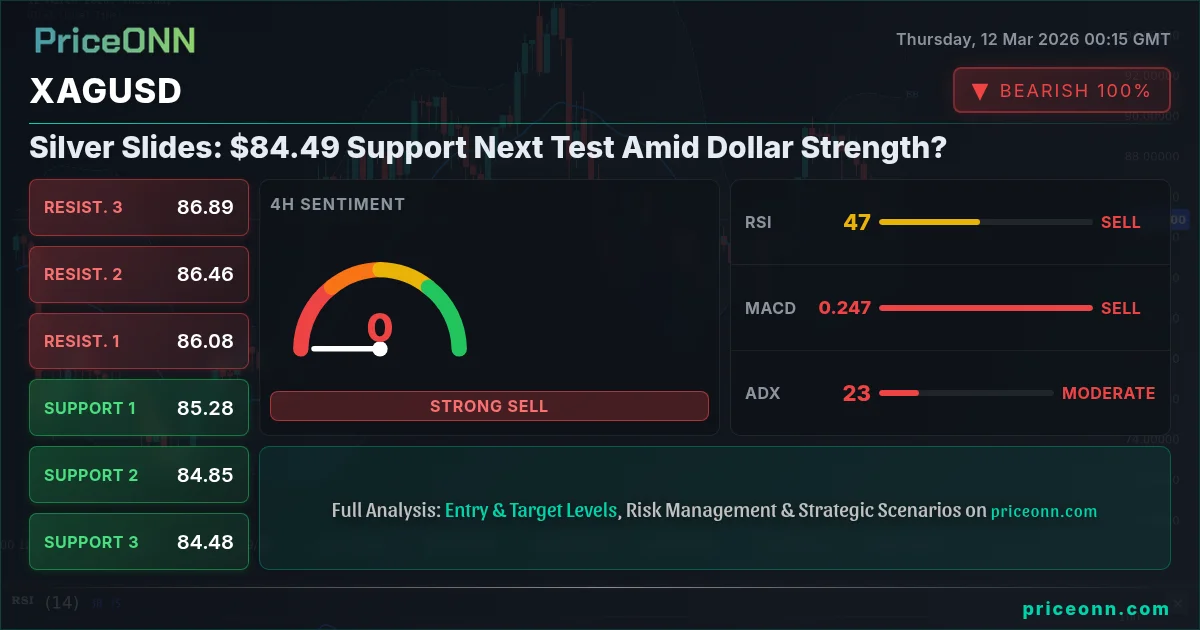
- XAGUSD faces downward pressure as the DXY rises to 99.25, impacting precious metal valuations.
- Critical support lies at $84.37 on the 1-hour chart, a level to watch closely for a potential bounce or breakdown.
- Stochastic oscillator signals oversold conditions on the 4-hour timeframe, suggesting possible exhaustion of the selling pressure.
- Upcoming US economic data releases could act as a catalyst, influencing XAGUSD's correlation with the dollar.
Silver's price volatility is nothing new. Remember the surge above $86 earlier this month? That was driven by strong investment demand. Now, the tables have turned, and the market is testing the downside. As Zeynep Arslan, a trading psychology specialist, I understand the emotional challenges you face when markets move against you. It's crucial to remain calm and objective, focusing on the data and your trading plan. This article will dissect the current technical picture and offer potential scenarios to navigate these choppy waters.
Why $84.37 is the Line in the Sand
The immediate support level to watch is $84.37, as identified on the 1-hour chart. A break below this level could open the door for further declines toward $83.82 and potentially $83.07. The 1-hour RSI at 32.68 suggests that silver is approaching oversold territory, but this doesn't guarantee an immediate reversal. Remember, markets can remain oversold for extended periods. The ADX on the 1-hour chart is at 35.47, indicating a strong downtrend. Now, this is where it gets interesting! While the RSI suggests potential for a bounce, the strong ADX reading tells us that the bears are still in control. This divergence requires careful consideration.
Scalpers should be closely monitoring the $84.37 level for potential shorting opportunities on a break. Swing traders might want to wait for a confirmed break below this level before entering short positions. Long-term investors might view this pullback as an opportunity to accumulate silver at lower prices, but they should be prepared for further volatility. Historically, silver has shown a strong correlation with gold, but industrial demand percentages for silver can sometimes decouple. The current environment is no different. The current silver price XAG/USD march 2 2026 is something that traders are constantly searching for.
The Bull's Roadmap: Recapturing $85.66
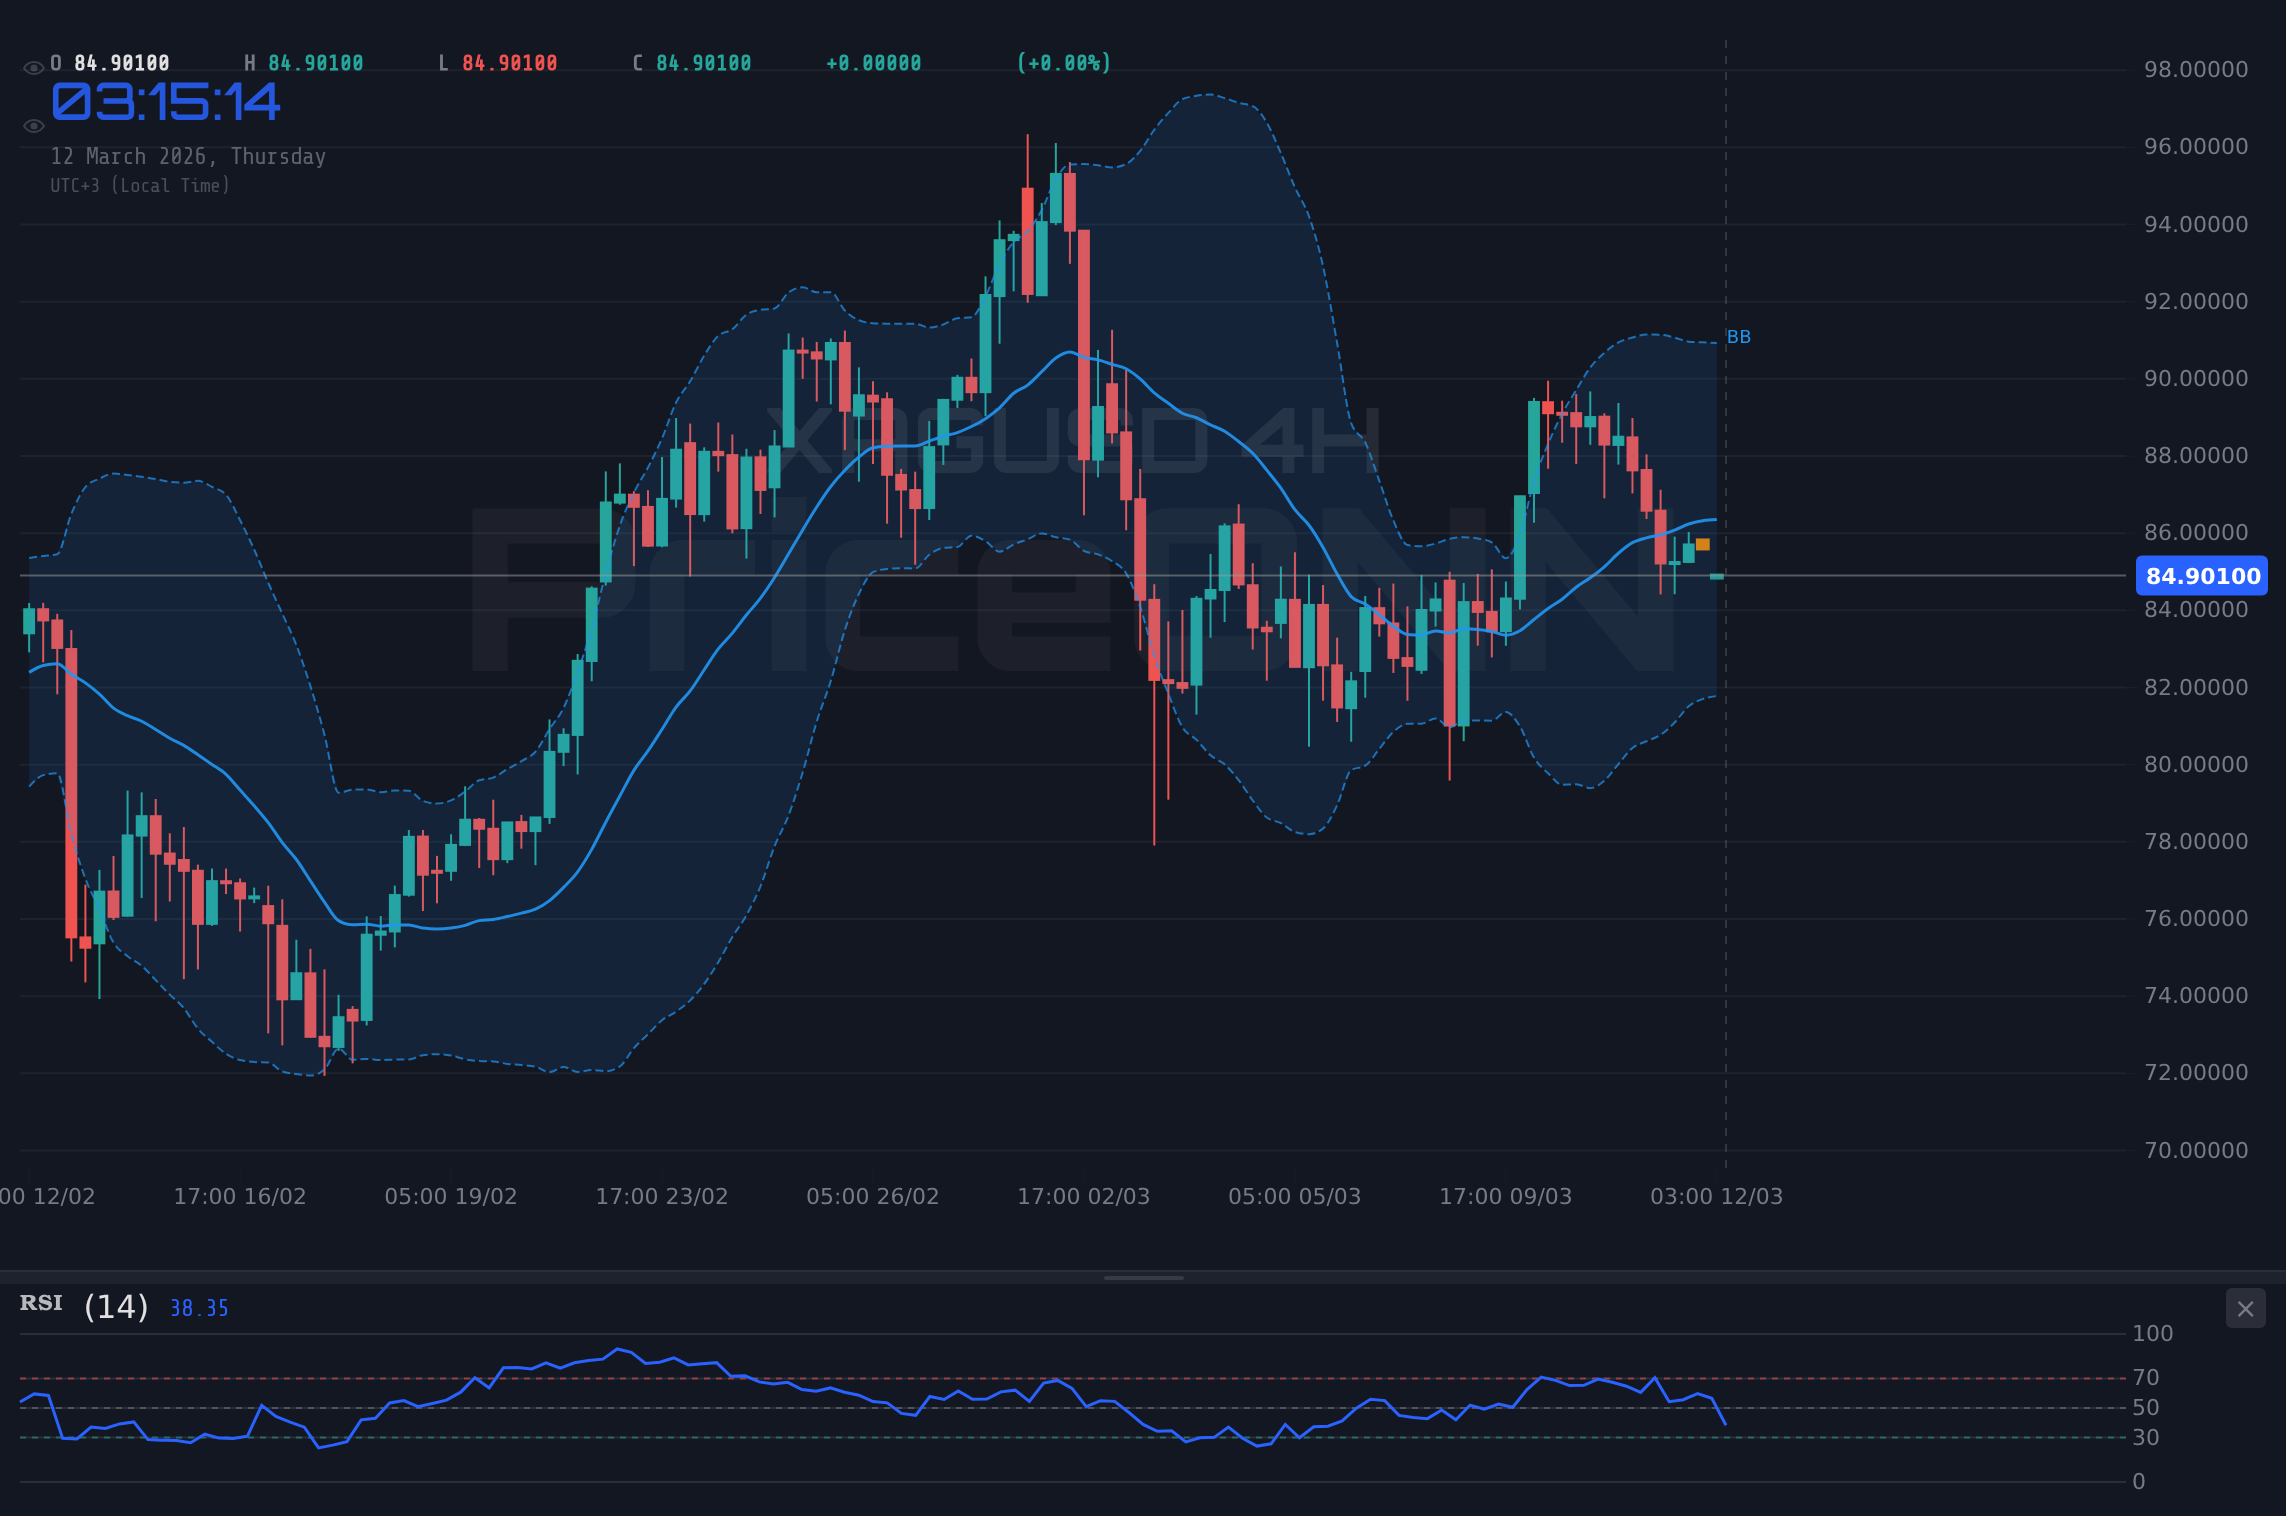
For the bulls to regain control, XAGUSD needs to recapture the $85.66 resistance level on the 1-hour chart. This would signal a potential shift in momentum and open the door for a move toward $86.41 and potentially $86.95. The stochastic oscillator on the 1-hour chart is currently showing a bearish signal, but a crossover above the signal line would be an early indication of bullish momentum. This is exactly where you need to pay attention! If XAGUSD can break above $85.66 and the stochastic oscillator confirms the bullish crossover, we could see a rapid move higher. The 4-hour RSI at 43.61 is still in neutral territory, but a move above 50 would add further confirmation to the bullish thesis.
The recent news that crude oil is eyeing $90 as Iran tensions threaten Eurozone stability could indirectly support silver prices. Rising energy prices tend to fuel inflation, which can increase demand for precious metals as a hedge. However, the strengthening dollar is currently offsetting this effect. The forexprostr gümüş is something that Turkish traders are looking for.
Where Bears Take Control: A Breakdown Below $84.37
If XAGUSD fails to hold the $84.37 support, the bears are likely to press for further declines. A confirmed break below this level could trigger a sharp sell-off toward $83.82 and potentially $83.07. The ADX on the 1-hour chart suggests that the downtrend is already strong, and a break below $84.37 could accelerate the decline. Look, this level is absolutely critical- A sustained move below it would confirm that the bears are firmly in control. The MACD on the 1-hour chart is currently showing negative momentum, further supporting the bearish scenario.
Swing traders should be prepared to enter short positions on a confirmed break below $84.37, with targets at $83.82 and $83.07. Scalpers can look for shorting opportunities on intraday bounces, but they should be mindful of the oversold RSI conditions. Long-term investors should exercise caution and avoid adding to their positions until the bearish momentum subsides. The current silver price XAG USD is very sensitive to the dollar.
The Waiting Game: Range-Bound Consolidation
It's also possible that XAGUSD could enter a period of range-bound consolidation between $84.37 and $85.66. This scenario would likely play out if the dollar's strength stabilizes and risk sentiment remains neutral. The ADX on the 4-hour chart is currently at 22.15, suggesting a moderate downtrend, but this could weaken further if XAGUSD enters a period of consolidation. In this scenario, patience will be rewarded. Traders should avoid taking aggressive positions and wait for a clear breakout or breakdown before committing to a direction.
Long-term investors might consider using this period of consolidation to dollar-cost average into silver, but they should be prepared for further volatility. The key to successful trading is to adapt to the market conditions and avoid forcing trades. Manage your risk, wait for your setup- the market always gives a second chance. We have to be smart about this. The current silver price XAG/USD live needs to be constantly monitored.
Most Likely Scenario: Bearish Pressure Prevails (60% Probability)
Given the current technical picture and the strength of the dollar, the most likely scenario is that bearish pressure will prevail, leading to a break below $84.37. The ADX is at a high level which is a signal of a strong trend. The strong downtrend on the 1-hour and 4-hour charts, combined with the negative momentum on the MACD, suggests that the bears are firmly in control. However, the oversold RSI conditions warrant caution, and traders should be prepared for potential bounces. I estimate a 60% probability of this scenario playing out over the next few days.
The current silver price volatile run is something that has been happening for a while. This is because of a number of different reasons. One of the reasons is because of the increased demand for silver. Another reason is because of the increased supply of silver. The current silver price XAGUSD is one of the most important things to keep in mind.
Key Triggers to Watch This Week
Several key triggers could influence XAGUSD's price action this week. On the economic front, the US data on Friday is likely to be closely watched by traders. Strong data could further bolster the dollar and weigh on silver, while weak data could provide some relief. Geopolitical tensions in the Middle East also remain a key risk factor. Escalation of the conflict could increase demand for safe-haven assets, potentially supporting silver prices. Finally, traders should monitor the price action in gold for clues about the overall precious metals complex.
If XAGUSD breaks above $85.66 resistance, fueled by a weakening dollar, the next target is $86.41, followed by $86.95. This requires a significant risk-on sentiment shift and weaker-than-expected US data.
A break below $84.37 support, driven by a stronger dollar, could trigger a sharp sell-off towards $83.82 and $83.07. This is contingent on continued risk-off sentiment and stronger-than-expected US data.
Technical Outlook Summary
| Indicator | Value | Signal |
|---|---|---|
| RSI (14) | 32.68 (1H) | Oversold Watch |
| MACD Histogram | Negative (1H) | Bearish |
| Stochastic | K=13.48, D=30.02 (1H) | Bearish |
| ADX | 35.47 (1H) | Strong Downtrend |
| Bollinger | Lower Band (1H) | Watch |
Key Levels
Support Levels
Resistance Levels
Frequently Asked Questions: XAGUSD Analysis
What happens if XAGUSD breaks below $84.37 support?
A break below $84.37 could trigger a sharp sell-off, potentially leading to targets at $83.82 and $83.07. The ADX indicates strong downtrend, reinforcing the bearish outlook.
Should I sell XAGUSD at current $84.49 levels given the oversold RSI?
While the RSI suggests oversold conditions, the strong downtrend indicated by the ADX warrants caution. Wait for a confirmed break below $84.37 before considering short positions.
Is the MACD signal on the 1-hour chart a reliable indicator for XAGUSD?
The negative MACD momentum on the 1-hour chart supports the bearish scenario, but it should be used in conjunction with other indicators and key levels for confirmation.
How will the US data release affect XAGUSD this week?
Strong US data could further strengthen the dollar, putting downward pressure on XAGUSD. Conversely, weak data could weaken the dollar and provide some relief for silver prices.
Track markets in real-time
AI-powered analysis, technical indicators and real-time price data.
Join Our Telegram Channel
Breaking market news, AI analysis and trading signals instantly.
Join Channel