
WTI Crude Oil Tests $99.33: A Critical Juncture for Traders
WTI crude oil hovers around $99.33, showing mixed signals across timeframes. Is a breakout imminent or a retracement on the cards? Analysis follows.
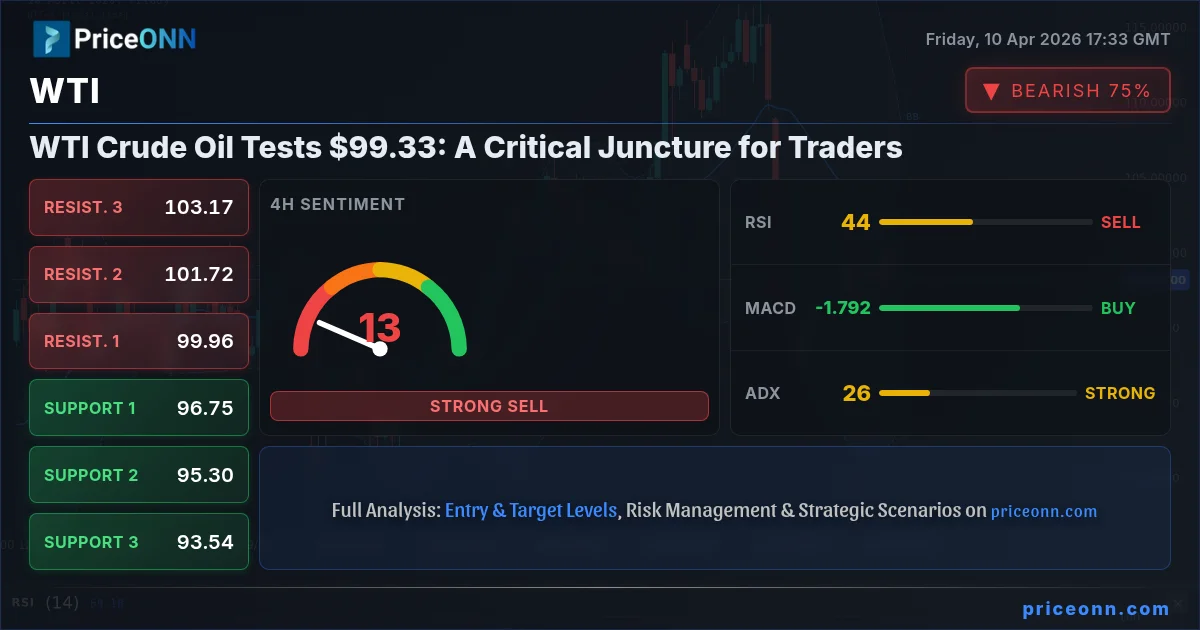
The energy markets are at a fascinating crossroads, and WTI crude oil, currently trading at $99.33, is right in the thick of it. After a notable surge of 1.44% on the day, pushing the price from a low of $97.06 to a high of $100.42, the market is now digesting this move. This isn't just another price fluctuation; it's a moment where traders need to pay close attention to the confluence of technical indicators and potential market drivers. The question on everyone's mind is whether this upward momentum has legs or if we're seeing a temporary pause before a potential pullback. Having tracked WTI through various cycles, I can tell you that price action around these psychologically significant levels often dictates the next major directional move.
- WTI crude oil is trading at $99.33, with a daily gain of 1.44% following a volatile range.
- Technical indicators present a mixed picture: 1H shows a bullish lean, while 4H and 1D lean towards caution or consolidation.
- Key resistance at $101.00 needs to be watched closely for a potential continuation of the bullish trend.
- Geopolitical tensions and inflation concerns remain underlying factors influencing crude oil prices.
The daily chart for WTI paints a compelling, albeit complex, picture. While the overall trend is classified as bullish with a 100% strength reading, the ADX at 45.67 suggests a very strong trend is in play, which can sometimes precede exhaustion or significant reversals. The RSI(14) is sitting at 54.77, firmly in neutral territory but with a slight upward bias, indicating room for further gains without immediate overbought conditions. However, the MACD is showing negative momentum with the histogram below the signal line, and the Stochastic Oscillator's K line (26.91) is well below the D line (63.24), signaling a potential bearish divergence and risk of a pullback. This divergence between the RSI's neutral stance and the MACD/Stochastic's bearish lean on the daily chart is precisely where nuanced analysis is crucial. It's not a clear buy or sell signal; rather, it highlights a market at a potential inflection point.
Diving into the shorter timeframes, the 1-hour chart provides a more immediate tactical view. Here, the trend is neutral with 50% strength, but the 'General Signal' leans towards 'BUY' (7 buys, 1 sell, 0 neutral). The RSI(14) at 54.18 is neutral, MACD shows positive momentum, and the Stochastic K line (50.5) is above the D line (36.25), suggesting a potential continuation of upward movement. The ADX is a mere 9.47, indicating a very weak trend, which often means that the current price action might be more noise than signal, or it could precede a significant breakout. The Bollinger Bands are hovering above the middle band, also hinting at a slightly bullish bias in this immediate timeframe. This short-term bullish sentiment contrasts with the longer-term daily indicators, creating a scenario ripe for volatility.
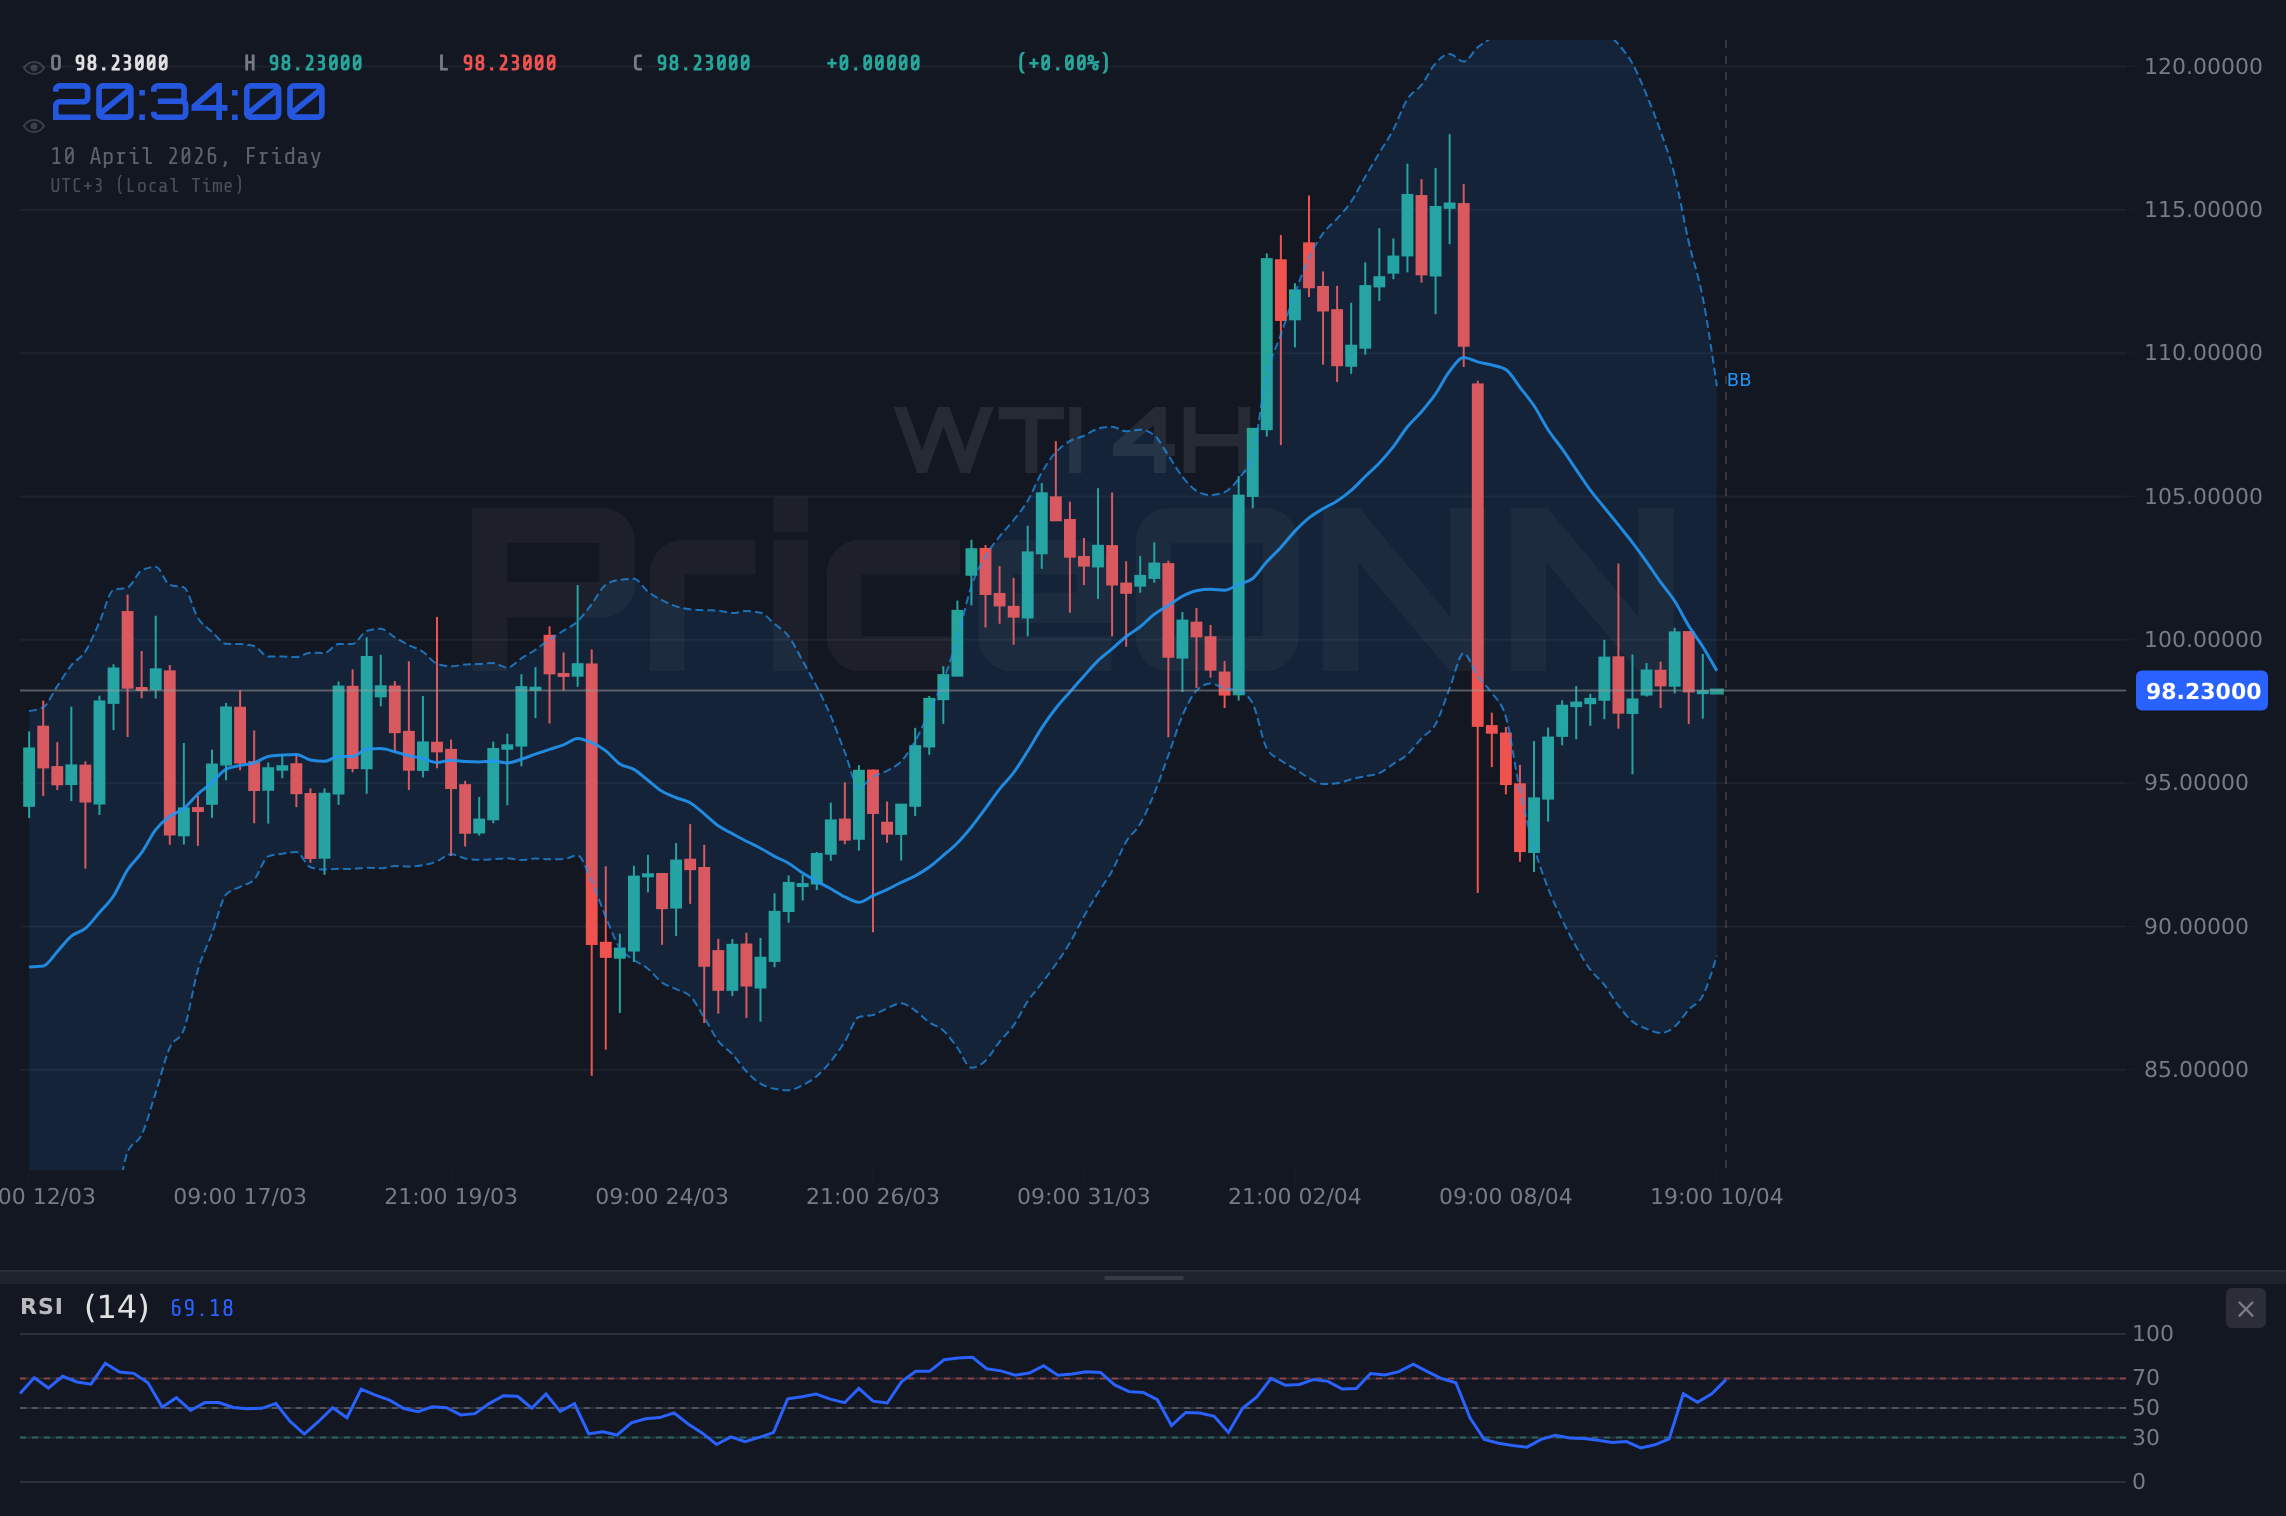
The 4-hour chart adds another layer to this multi-timeframe analysis. The trend is currently neutral with 50% strength, but the 'General Signal' leans towards 'SELL' (3 buys, 5 sells, 0 neutral). The RSI(14) at 45.74 is in neutral territory with a downward bias, suggesting some selling pressure might be building. MACD is positive, which is a conflicting signal, but the Stochastic K line (58.27) is below the D line (60.51), indicating a potential downward move or consolidation. The ADX at 26.88 points to a strong downtrend, which is a significant indicator that the short-term bullishness might be facing headwinds. The Bollinger Bands are below the middle band, reinforcing the bearish lean on this timeframe. This is where the narrative gets really interesting: the daily chart is technically bullish but showing divergence, the 1-hour is neutral-to-bullish but in a weak trend, and the 4-hour is showing stronger bearish signals.
Navigating the $99.33 Level
The current price of $99.33 sits precariously between key psychological and technical levels. On the daily chart, immediate resistance looms at $101.36, followed by $104.16 and $106.61. These are significant levels that have historically dictated major price swings. Conversely, support is found at $96.11, $93.66, and $90.86. The current price action is hovering above the mid-point of this daily range, suggesting that while upside potential exists, the overhead resistance is a formidable barrier. For traders, the $99.33 level itself acts as a pivot. A sustained hold above this point, especially if it breaks through the 1-hour resistance of $99.26 and begins to challenge the $100.42 daily high, could signal continuation. However, a failure to hold $99.33 and a subsequent drop below the 4-hour support at $98.86 would likely invalidate the short-term bullish thesis and open the door for a test of lower levels.
Let's consider the broader market context. The DXY (Dollar Index) is currently at 98.43, showing a slight daily increase. Historically, a stronger dollar tends to put pressure on oil prices, as crude is often priced in dollars. If the DXY continues to climb, it could act as a headwind for WTI, even if other factors are supportive. The SP500 is trading at 6572.87, up 0.74%, indicating a generally positive risk appetite in equities. This correlation suggests that a risk-on environment is currently favorable for commodities like oil. However, the Nasdaq100 is showing a more mixed picture, with a neutral signal on the daily chart despite a bullish trend on 4H. This mixed equity performance adds a layer of uncertainty, implying that the market might not be fully committed to a risk-on narrative, which could impact oil's trajectory.
Geopolitical tensions remain a constant undercurrent for crude oil prices. While specific news regarding the Strait of Hormuz was mentioned, suggesting potential disruptions, the broader geopolitical landscape is always a factor. Any escalation in the Middle East, or significant developments in major oil-producing regions, can rapidly shift market sentiment and drive prices higher due to supply disruption fears. Conversely, news of easing tensions or a de-escalation could lead to profit-taking, especially if prices have already rallied significantly. The recent news mentioning potential ceasefire talks between Israel and Hamas, and an easing of US-Iran tensions, could be interpreted as a factor that might dampen immediate supply-risk premiums, potentially capping upside momentum for WTI, especially if combined with strong US inventory data.
Examining the economic calendar, while specific high-impact events for today (April 10th) are not detailed with actual figures, the general context of inflation concerns is paramount. Upcoming US CPI and PPI data, mentioned in the recent news, are critical. If inflation data comes in hotter than expected, it could fuel further interest rate hike expectations from the Federal Reserve. While higher rates can strengthen the dollar and pressure oil, they can also signal a robust economy with strong demand, which is bullish for oil. Conversely, cooler inflation could lead to expectations of Fed easing, potentially weakening the dollar and supporting oil prices. The market's reaction will depend heavily on the Fed's interpretation and forward guidance, making upcoming economic releases and central bank commentary crucial for WTI's direction.
Trade Scenarios for WTI at $99.33
Bearish Scenario: Retracement Below $99.33
55% ProbabilityBullish Scenario: Breakout Above $100.42
35% ProbabilityNeutral Scenario: Consolidation Around $99.33
10% ProbabilityFrequently Asked Questions: WTI Analysis
What happens if WTI breaks below $98.86 support?
A close below $98.86 on the 4-hour chart would invalidate the immediate bullish outlook. This could trigger a sell-off targeting $97.64 and potentially $96.11, as seen in the bearish scenario.
Should I buy WTI at current levels of $99.33 given the mixed signals?
Buying at $99.33 requires caution due to conflicting indicators on different timeframes. A confirmation above $100.42 offers a higher-probability bullish setup targeting $101.36, while a break below $98.86 suggests caution and potential downside.
Is the RSI at 54.77 a sell signal for WTI right now?
An RSI of 54.77 on the daily chart is neutral, indicating neither overbought nor oversold conditions. While it has an upward bias, it doesn't provide a strong sell signal on its own and needs confirmation from other indicators like MACD or Stochastic, which are showing bearish divergence.
How will upcoming US inflation data affect WTI this week?
Hotter-than-expected US inflation could strengthen the dollar, potentially capping WTI's upside, or signal strong demand, supporting oil. Cooler data might weaken the dollar and support oil prices. The market's reaction will depend on Fed expectations tied to the data.
Track markets in real-time
AI-powered analysis, technical indicators and real-time price data.
Join Our Telegram Channel
Breaking market news, AI analysis and trading signals instantly.
Join Channel