
WTI Trades Near $103: Powell Speaks, Bulls Charge - Technical Outlook
WTI crude oil hovers near $103.15 as traders digest Powell's comments and geopolitical tensions. Technicals show a strong uptrend on daily charts, but 1H indicators hint at caution.
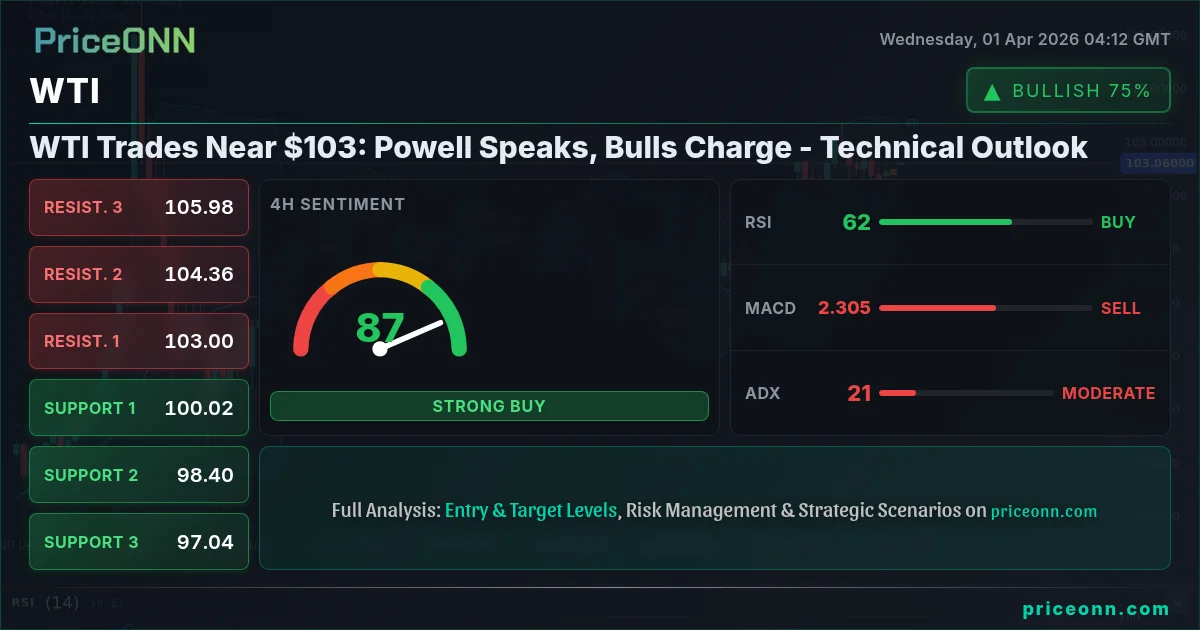
WTI crude oil is currently navigating a critical juncture, trading just above the significant psychological mark of $103.15. This price point is not merely a number; it represents a battleground where bullish momentum, fueled by escalating geopolitical tensions and a hawkish Federal Reserve stance, clashes with the inherent volatility of the energy markets. Traders worldwide are scrutinizing every tick, every indicator, and every word from central bankers to decipher the next likely move. With the daily chart painting a picture of robust upward momentum, the immediate 1-hour signals suggest a period of consolidation or even a short-term pullback might be on the horizon before the next significant directional move. Understanding this delicate balance is key for any trader looking to capitalize on the opportunities presented in this dynamic market.
- WTI crude is trading around $103.15, a key psychological level.
- Daily charts show a strong uptrend (ADX 58.82), but 1H indicators signal caution.
- Key support is identified at $102.06, with resistance looming at $104.31.
- Powell's comments and geopolitical risks are driving market sentiment and correlation with DXY.
The energy landscape is a complex tapestry woven with threads of supply, demand, geopolitical risk, and monetary policy. Currently, the narrative for WTI is dominated by two powerful forces: the persistent upward pressure from global supply chain concerns and Middle East tensions, and the cautious undertone introduced by central bank rhetoric. While Brent crude is eyeing $120 according to some projections, WTI's immediate path is being shaped by a confluence of technical signals and macro-economic undercurrents. The daily chart analysis reveals a strong bullish trend, with the Average Directional Index (ADX) at a formidable 58.82, indicating significant trending power. This suggests that the prevailing direction is likely to continue, barring any sharp reversals. However, the shorter timeframes present a more nuanced picture, demanding a closer look at the immediate trading dynamics.
Navigating the Immediate WTI Landscape: A Tale of Two Timeframes
On the 1-hour chart, WTI presents a mixed signal, a common characteristic of markets consolidating after a significant move or ahead of major catalysts. The Relative Strength Index (RSI) at 52.42 hovers in neutral territory, suggesting neither overbought nor oversold conditions, but it's showing a slight upward eğilim. This indicates that buyers are still present, but the aggressive push seen in longer timeframes might be temporarily subdued. The Moving Average Convergence Divergence (MACD) is currently below its signal line, hinting at potential negative momentum in the short term, a divergence from the stronger bullish signals on the daily chart. Bollinger Bands are trading above the middle band, supporting a bullish bias, but the stochastic oscillator, with %K at 83.08 and %D at 53.9, shows a strong bullish signal, with %K well above %D, suggesting upward momentum is building. Despite this, the ADX at 17.5 on the 1-hour chart indicates a weak trend, meaning any short-term moves might lack sustained follow-through, making it a zone where price action traders need to be particularly vigilant for confirmation.
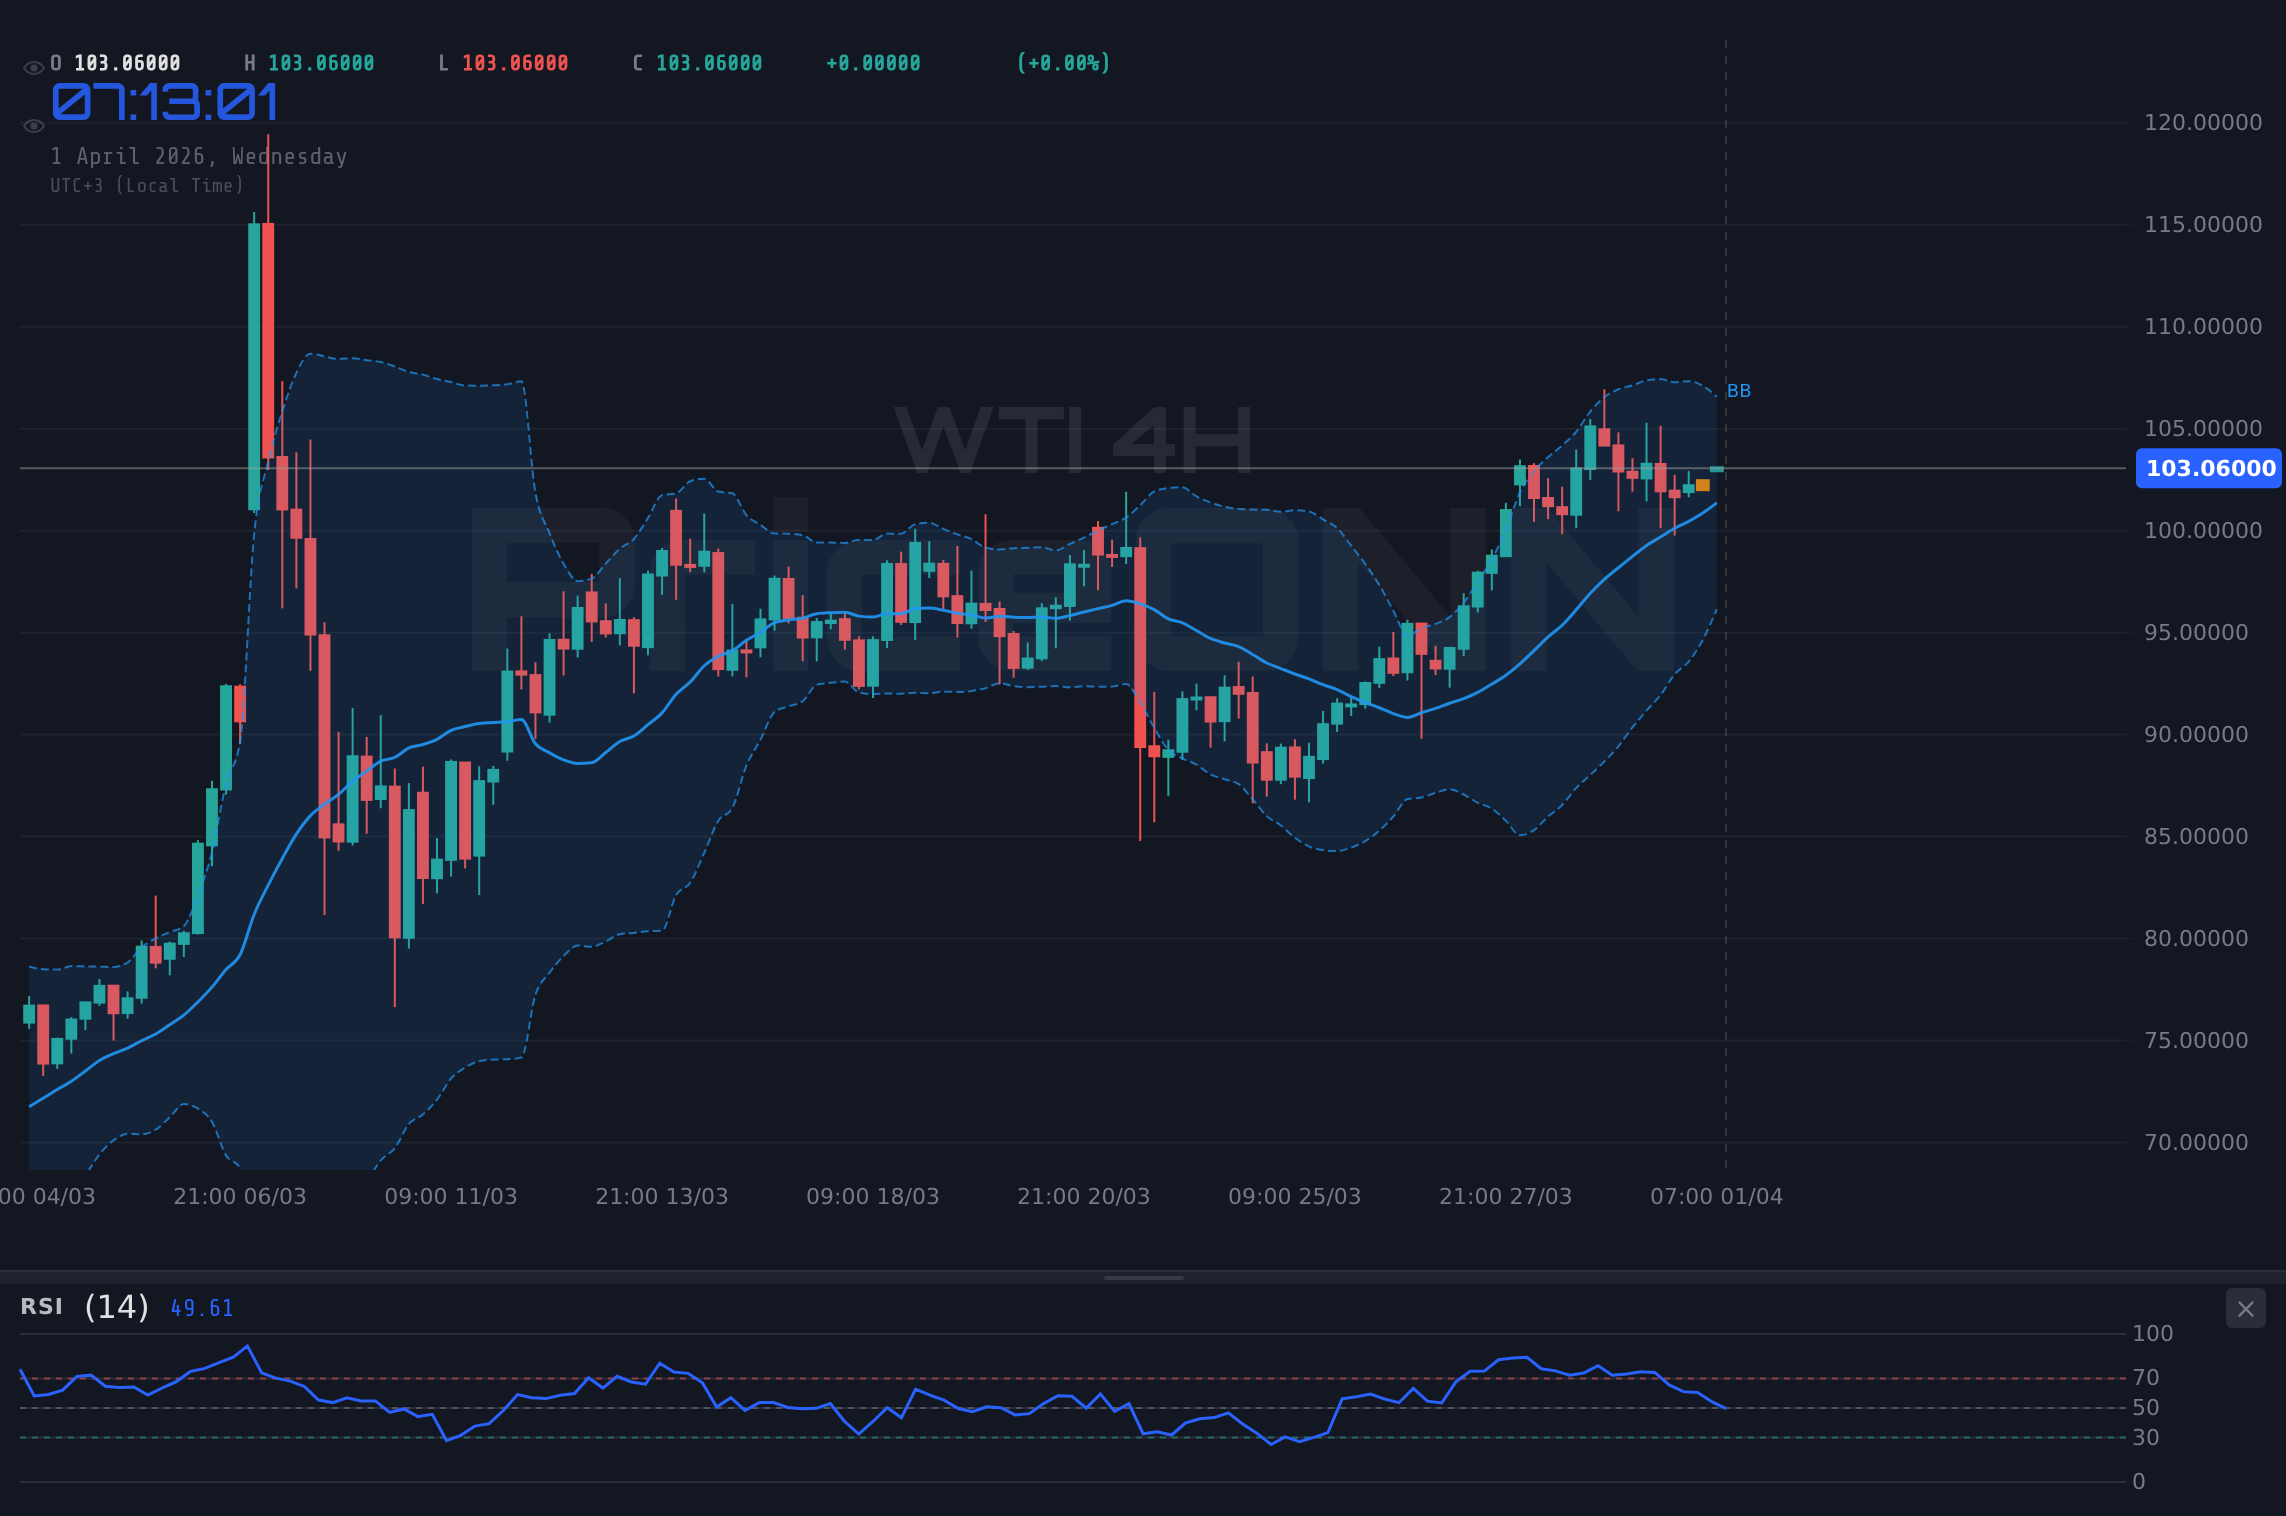
The 4-hour timeframe offers a slightly more encouraging perspective for the bulls, aligning more closely with the daily trend. Here, the RSI stands at 61.55, firmly in the neutral zone and exhibiting a rising eğilim, which supports further upside potential. The MACD, while still below its signal line, shows signs of potentially crossing over, suggesting that bearish momentum might be waning. The price is trading above the middle Bollinger Band, a bullish sign, and the stochastic oscillator (%K at 34.36, %D at 46.87) is in oversold territory, presenting a bullish signal as %K is below %D, hinting at a potential bounce. The ADX at 21.19 suggests a moderately trending market, stronger than the 1-hour but still not exhibiting the conviction seen on the daily chart. This suggests that the 4-hour timeframe is in a transitional phase, where the short-term choppiness might be giving way to a more sustained move, but confirmation is still needed.
The Daily Conviction: WTI's Bullish Trajectory
Transitioning to the daily timeframe, the picture for WTI becomes significantly clearer and more compellingly bullish. The ADX reading of 58.82 is exceptionally high, signaling a very strong trend. This isn't just a minor uptick; it's indicative of sustained directional movement that typically requires significant counter-forces to reverse. The RSI at 66.07, while approaching overbought territory, is still within a range that has historically supported further price appreciation in strong uptrends. It suggests that buyers are still actively participating without pushing the market into extreme overvaluation territory just yet. The MACD is positive and above its signal line, confirming bullish momentum. Crucially, the price is trading above the middle Bollinger Band, and the stochastic oscillator is showing a bullish signal with %K at 85.76 and %D at 65.27, indicating strong upward momentum and a potential continuation of the rally. This confluence of indicators on the daily chart paints a robust picture of an uptrend that, barring unforeseen shocks, is likely to persist.
The support and resistance levels on the daily chart further define the potential path forward. With immediate support found at $102.06, $98.62, and $95.61, the downside appears to be relatively well-defended. These levels represent areas where buying interest has historically emerged, potentially halting or reversing downward price action. On the upside, resistance levels at $103.56, $104.31, and $105.79 are the immediate hurdles for the bulls. A decisive break and hold above the $103.56 resistance, especially with strong volume, could signal the next leg higher, targeting $104.31 and potentially $105.79. The strength of the current trend, as indicated by the ADX, suggests that such a breakout is a plausible scenario if catalysts align.
Macroeconomic Currents and Geopolitical Winds
The price action in WTI cannot be viewed in isolation. The broader macroeconomic environment plays a crucial role. The Dollar Index (DXY) is currently trading around 99.6, showing a slight upward movement on the 1H and 4H charts, but a stronger bullish trend on the daily. A strengthening dollar typically exerts downward pressure on dollar-denominated commodities like oil, as they become more expensive for holders of other currencies. However, in the current climate, the correlation might be nuanced. The prevailing narrative of inflation and geopolitical risk can sometimes override the dollar's influence, especially when oil prices are driven by supply-side disruptions rather than just demand strength. The fact that WTI is showing bullish strength despite a generally firming dollar suggests that supply-side concerns are the dominant factor right now.
Geopolitical tensions in the Middle East remain a significant overhang, keeping oil prices elevated. Reports of escalating tensions and potential disruptions to supply routes are a constant background factor, acting as a floor for prices. Any flare-up in conflicts or new threats to oil-producing regions can trigger rapid price spikes. Furthermore, the ongoing discussions around energy security and the transition to greener sources add another layer of complexity. While the long-term trend might lean towards renewables, the immediate reliance on fossil fuels means that supply-side constraints, whether geopolitical or logistical, will continue to be a primary driver of short-term price action. The news that Brent crude is projected to peak at $120 per barrel due to these tensions underscores the sensitivity of the market to such events.
Central bank policies, particularly those of the Federal Reserve, also cast a long shadow. Comments from Fed officials, like Chair Powell, regarding inflation and interest rate trajectories are closely watched. If Powell's recent remarks signal a continued hawkish stance, it could lead to higher interest rates, potentially dampening economic growth and, consequently, oil demand. However, the market seems to be pricing in a resilient economy, capable of absorbing higher rates while still supporting commodity prices. The interplay between inflation expectations, central bank actions, and geopolitical supply shocks creates a complex environment where oil prices can remain elevated even amidst tightening monetary policy.
Trading Scenarios for WTI: Charting the Path Forward
Given the current technical and fundamental backdrop, several scenarios are plausible for WTI. The strength of the daily trend suggests that any pullbacks could be buying opportunities, provided key support levels hold. However, the mixed signals on shorter timeframes caution against aggressive entries without confirmation. The immediate price action around $103.15 is crucial. A failure to hold this level could trigger a cascade towards the next support, while a decisive breakout above near-term resistance could accelerate the move higher.
Bullish Scenario: Sustained Uptrend Continuation
65% ProbabilityNeutral Scenario: Consolidation Around $103
25% ProbabilityBearish Scenario: Short-Term Reversal
10% ProbabilityThe bullish scenario hinges on the continued strength observed in the daily timeframe. A decisive close above the immediate resistance at $103.56, confirmed by increasing volume and positive MACD movement on the 1-hour chart, would validate this outlook. This would likely target the next resistance levels at $104.31 and potentially extend towards $105.79. Conversely, a breakdown below the crucial support at $102.06, especially if accompanied by a surge in selling volume and negative indicator divergence, would invalidate the bullish thesis and open the door for a move towards the $100.02 and $98.62 levels. The neutral scenario anticipates a period of range-bound trading, where WTI oscillates between the aforementioned support and resistance levels, reflecting indecision in the market ahead of clearer signals or major catalysts.
The current ADX of 21.19 on the 4-hour chart suggests that while a trend exists, it's not yet overwhelmingly strong, leaving room for consolidation. This makes the neutral scenario a plausible outcome in the short term. However, the overwhelming strength of the daily ADX (58.82) cannot be ignored. This suggests that any consolidation is likely to be a pause rather than a reversal, and the path of least resistance remains to the upside. Traders should remain vigilant for confirmation signals, particularly a sustained break above $103.56, which would align all timeframes towards a bullish continuation.
The Path Ahead: What to Watch for in WTI
Looking forward, several factors will dictate WTI's trajectory. Firstly, the ongoing geopolitical situation in the Middle East remains paramount. Any escalation or de-escalation will have immediate price implications. Secondly, central bank policy continues to be a critical driver. Further hawkish commentary from the Federal Reserve could weigh on oil demand expectations, while signs of easing inflation or a pause in rate hikes could support a more bullish outlook for commodities. The correlation with the DXY will also be a key factor to monitor; a sustained weakening of the dollar could provide additional tailwinds for WTI.
From a technical standpoint, the $103.15 level is the immediate focus. A hold above this price is crucial for maintaining the bullish short-term bias. Traders will be watching for a confirmed breakout above $103.56, supported by strong volume and positive momentum indicators across multiple timeframes. Conversely, a decisive break below $102.06 would signal a shift in sentiment and potentially initiate a deeper correction. The strength of the daily trend remains the dominant factor, suggesting that dips are likely to be shallow and short-lived, presenting potential buying opportunities for those with a longer-term perspective.
Frequently Asked Questions: WTI Analysis
What happens if WTI breaks above the $103.56 resistance level?
A confirmed break above $103.56, especially with strong volume, would likely trigger a move towards the next resistance at $104.31. This would validate the bullish scenario, supported by the strong daily uptrend indicated by the ADX at 58.82.
Should I buy WTI at current levels around $103.15 given the mixed 1H signals?
Buying at current levels requires caution due to mixed 1H indicators. A more prudent approach would be to wait for confirmation, such as a daily close above $103.56 or a clear bounce from the $102.06 support, aligning with the stronger daily trend.
Is the RSI at 52.42 a sell signal for WTI on the 1H chart?
An RSI of 52.42 on the 1-hour chart is considered neutral, not a sell signal. It indicates that the market is balanced, with neither buyers nor sellers having a clear upper hand in the immediate short term. Further confirmation would be needed for a directional trade.
How will Fed comments affect WTI this week, given the DXY's trend?
Hawkish Fed commentary could strengthen the DXY (currently trending up daily) and potentially pressure WTI by reducing demand expectations. However, strong geopolitical risks might override this effect, keeping WTI supported if supply fears persist.
| Indicator | Value | Signal | Interpretation |
|---|---|---|---|
| RSI (14) | 52.42 | Neutral | Slight upward eğilim, balanced momentum |
| MACD | -0.15 | Bearish | Below signal line, potential short-term weakness |
| Stochastic | K:83.08, D:53.9 | Bullish | Strong upward momentum signal |
| ADX | 17.5 | Weak Trend | Lack of strong directional conviction on 1H |
| Bollinger Bands | Above Mid | Bullish | Price above middle band suggests upward bias |
Track markets in real-time
AI-powered analysis, technical indicators and real-time price data.
Join Our Telegram Channel
Breaking market news, AI analysis and trading signals instantly.
Join Channel