
WTI Trades Near $112.38 Amid Inflation Fears; Key Levels to Watch
WTI crude oil holds near $112.38, with traders navigating inflation concerns and geopolitical risks. Technicals suggest a strong trend.
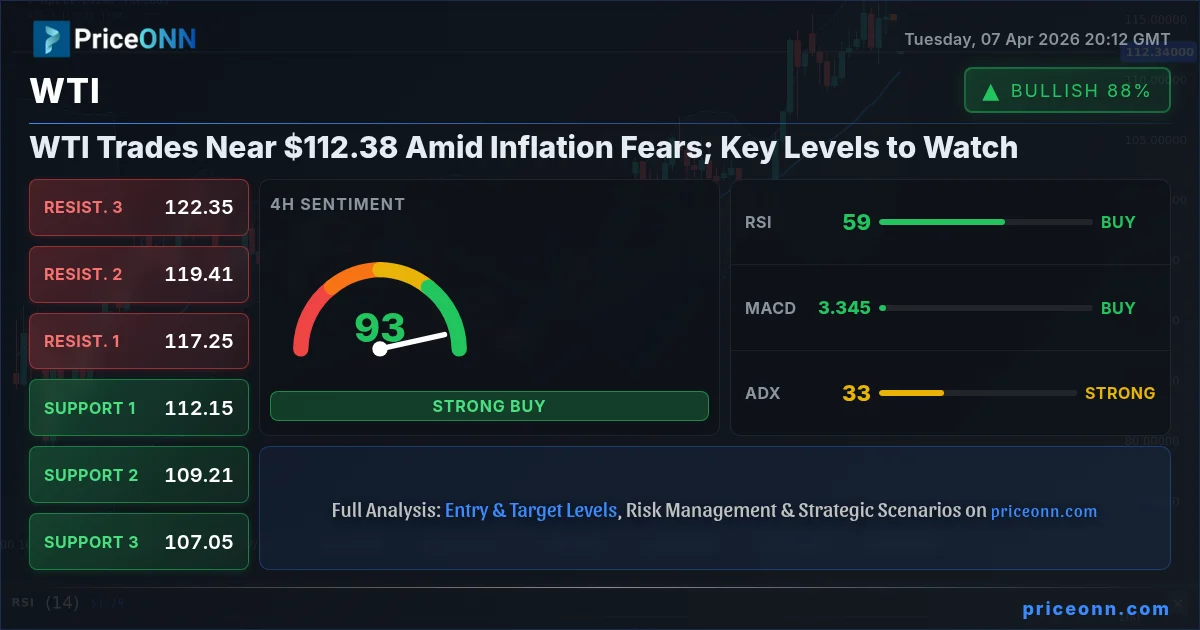
Crude oil prices, particularly for WTI, are currently hovering around the critical $112.38 mark. This level is more than just a price point; it's a battleground where inflation fears, geopolitical tensions, and the underlying strength of the oil trend are being weighed. The market sentiment is complex, with a strong upward trend indicated by ADX readings, yet lingering uncertainties keep traders on edge. Understanding the interplay between these factors is paramount for navigating the volatile energy markets.
- WTI is trading near $112.38, showing a strong upward trend with an ADX of 32.94.
- Critical support is at $109.26, while resistance looms at $115.77.
- RSI at 44.11 indicates bearish momentum on the 1H chart, contrasting with the daily's bullish signals.
- Geopolitical tensions and inflation fears are the primary drivers influencing WTI's price action.
The intraday technicals for WTI present a somewhat mixed picture, a common occurrence in these highly sensitive commodity markets. On the 1-hour chart, the Relative Strength Index (RSI) stands at 44.11, suggesting a bearish momentum is currently in play. This indicates that while the broader trend might be bullish, short-term traders might be seeing some profit-taking or hesitation. However, this is immediately contrasted by the 4-hour chart, where the RSI reads 58.74, still within the neutral zone but leaning towards bullish sentiment, indicating potential for upward movement. The divergence between these short-term timeframes highlights the need for a multi-timeframe approach.
The Moving Average Convergence Divergence (MACD) further adds layers to this analysis. On the 1-hour timeframe, the MACD histogram is negative, reinforcing the short-term bearish sentiment observed with the RSI. This suggests that sellers have had a slight edge in the immediate past. However, the 4-hour MACD shows positive momentum with the MACD line above the signal line, aligning with the higher RSI reading and suggesting that the underlying strength might still be present. This conflict between short-term bearish signals and medium-term bullish indications is precisely where careful analysis and risk management become crucial.
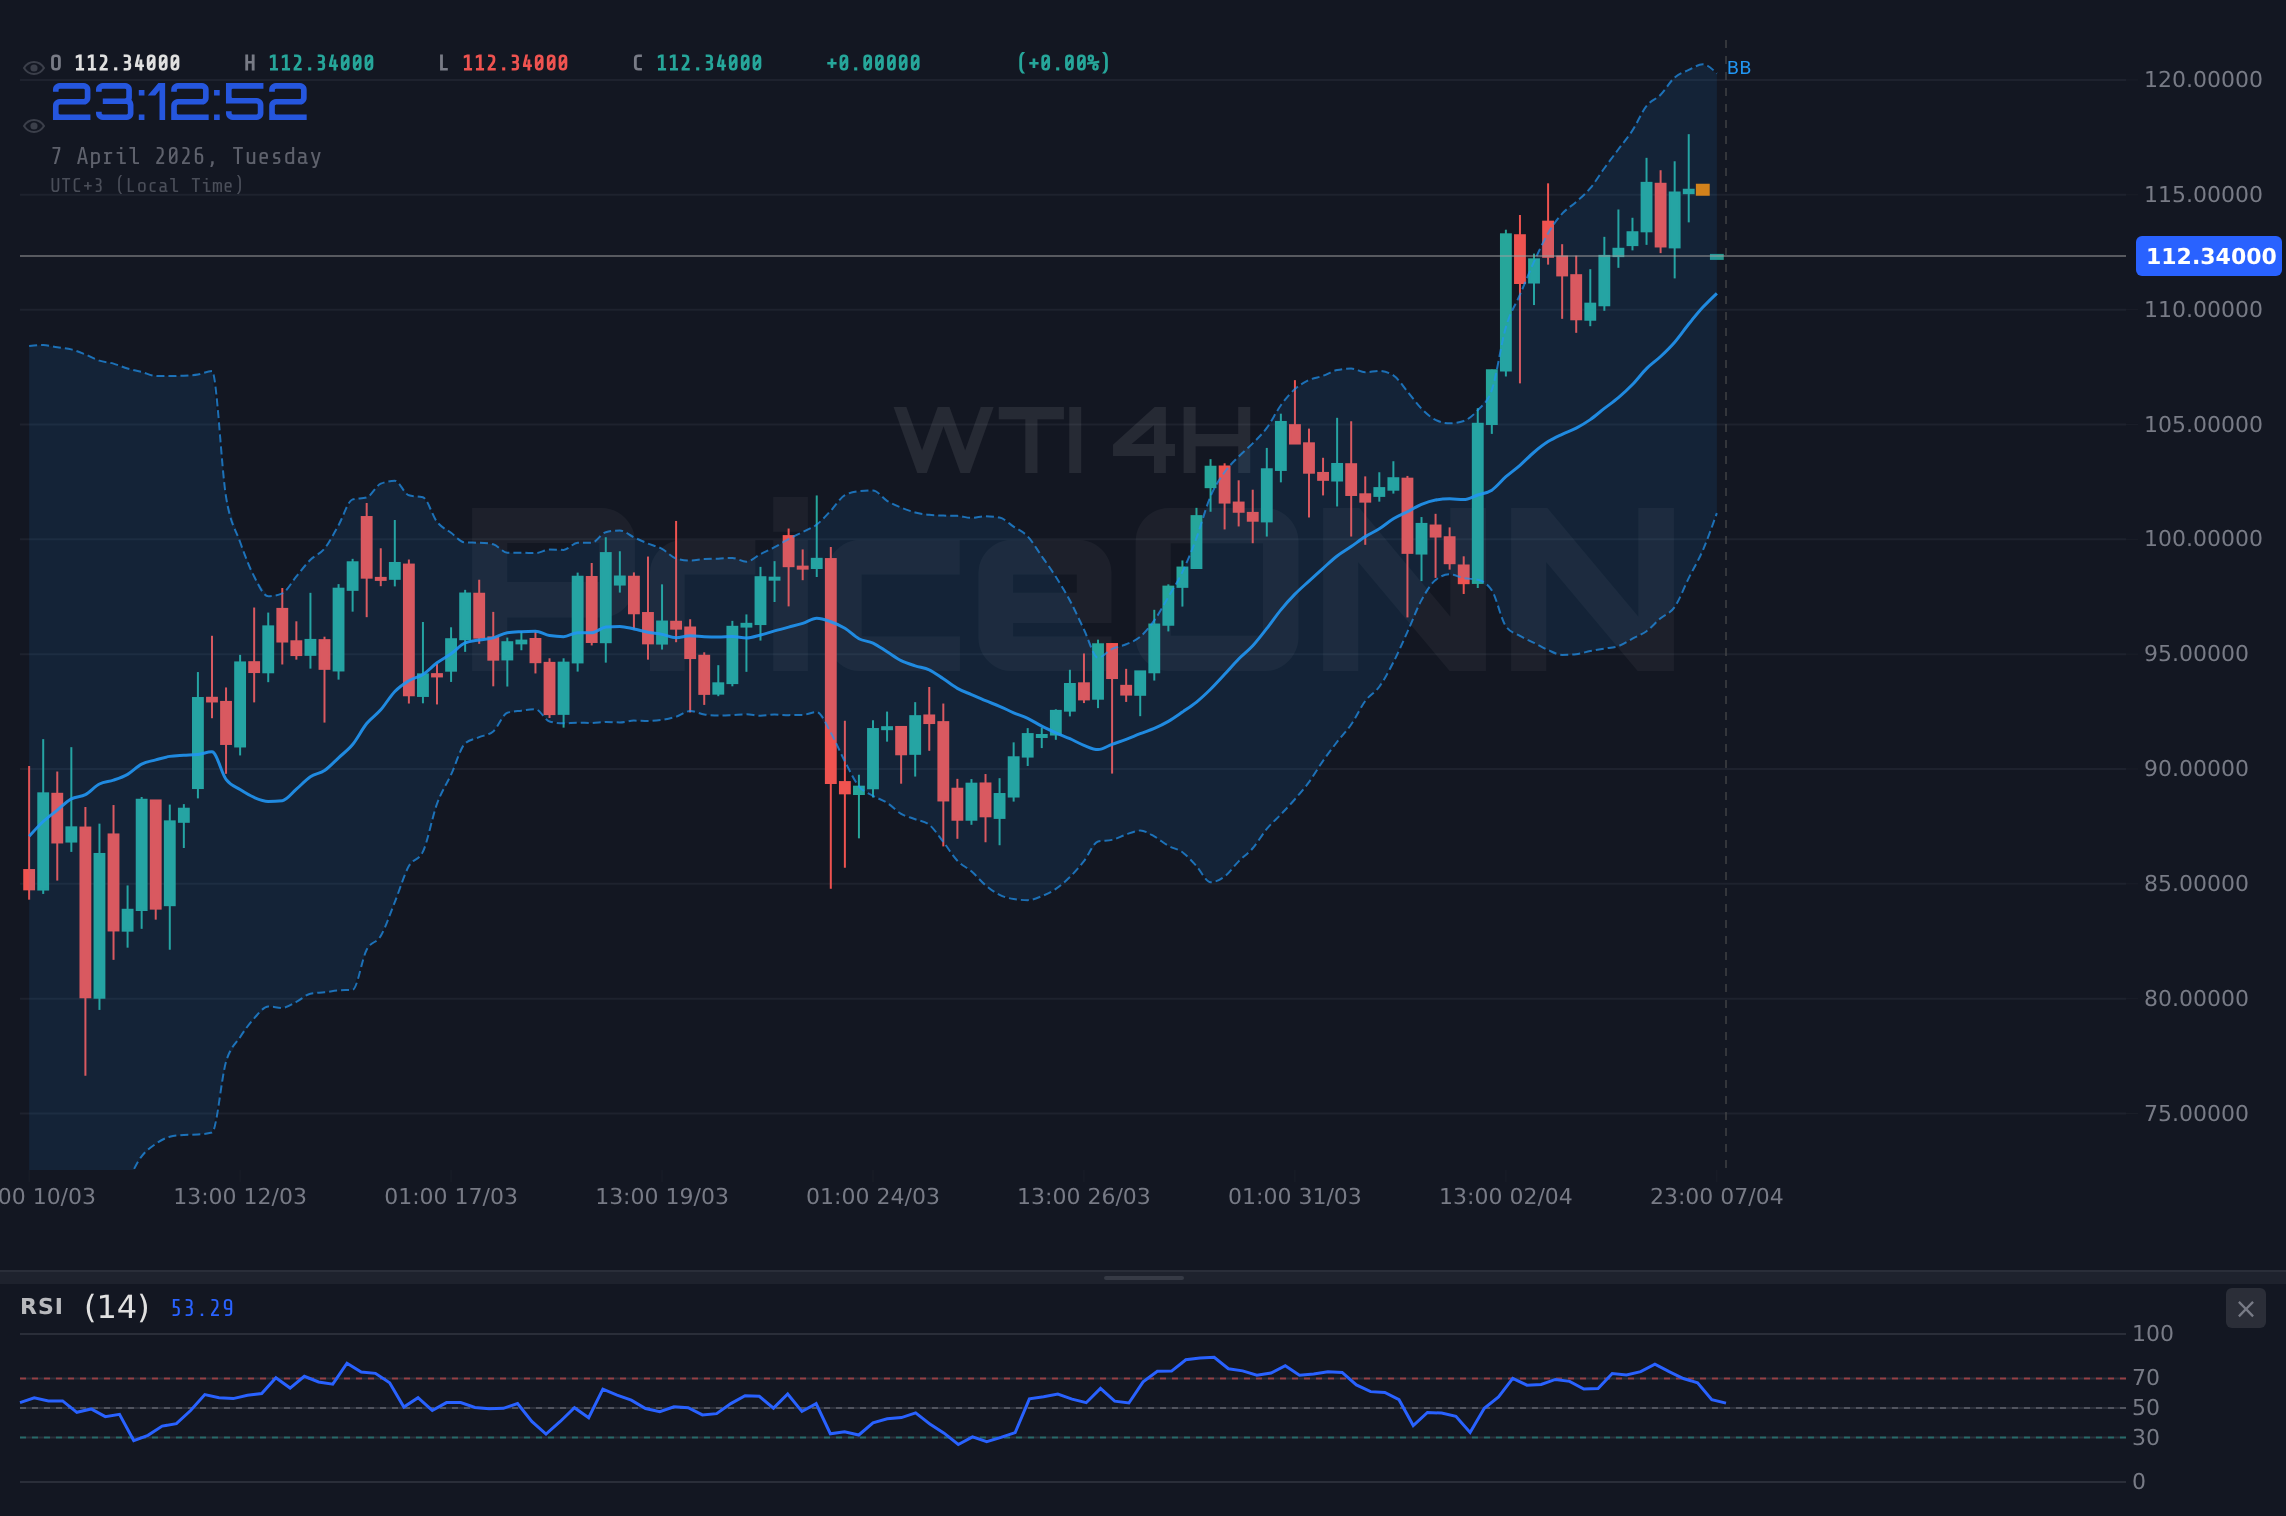
On the 1-day chart, the picture becomes clearer, leaning towards a bullish outlook. The RSI is at 70.04, firmly in overbought territory. While this can sometimes signal a potential reversal, in a strong uptrend, it can also indicate sustained buying pressure. The MACD on the daily chart also shows positive momentum, with the MACD line above its signal line. This alignment across multiple indicators on the daily chart suggests that the broader trend remains upward, despite any short-term pullbacks or consolidations observed on lower timeframes. This is the kind of confluence that traders look for when identifying significant market direction.
The Average Directional Index (ADX) provides vital information about trend strength. On the 1-hour chart, the ADX is at 23.39, indicating a moderately strong downward trend in that immediate timeframe, aligning with the bearish RSI and MACD readings. However, the 4-hour ADX at 32.94 and the daily ADX at a robust 59.22 paint a very different story. These higher readings signify a very strong upward trend, suggesting that the short-term bearish signals might just be temporary noise within a larger, powerful move. A daily ADX above 50 is exceptionally strong, indicating sustained momentum that could push prices higher.
Bollinger Bands offer another perspective on WTI's price action. On the 1-hour chart, WTI is trading below the lower band, which, combined with the bearish indicators, suggests a potential oversold condition or a significant breakout to the downside. However, this is immediately contradicted by the 4-hour and daily charts, where WTI is trading above the middle band and, on the daily, even approaching the upper band. This suggests that the price action on the 1-hour chart might be an anomaly or a short-lived dip within a prevailing bullish structure. The daily chart's position relative to the Bollinger Bands is particularly telling, indicating that the upward momentum is substantial.
The current price of $112.38 is situated between key technical levels that traders are closely watching. On the downside, the first significant support level is found at $109.26. A break below this level would be a strong bearish signal, potentially invalidating the current uptrend and opening the door for further declines towards the next support at $105.87. Conversely, immediate resistance is encountered at $115.77. A decisive move above this level, especially with strong volume, would confirm the continuation of the bullish trend and could target the subsequent resistance at $118.89. These levels are not arbitrary; they represent areas where significant buying or selling pressure has historically emerged.
Considering the strength of the daily trend, as indicated by the ADX and Bollinger Band readings, a bullish bias seems more appropriate, albeit with caution due to short-term divergences. The overall market sentiment, influenced by ongoing geopolitical tensions and persistent inflation fears, continues to support higher energy prices. While the 1-hour chart might suggest short-term weakness, the longer-term picture points towards potential upside. The key will be how WTI reacts to the immediate resistance level of $115.77. A break above this could trigger a significant rally.
The Dollar Index (DXY) often moves inversely to commodities like WTI. Currently, the DXY is showing a mixed signal across different timeframes: a bearish trend on the 1-hour and 4-hour charts, but a strong bullish trend on the daily. If the DXY strengthens significantly, as suggested by its daily trend, it could exert downward pressure on WTI prices. However, if the geopolitical situation escalates, demand for safe-haven assets like oil might override dollar strength, creating a decoupling effect. Currently, with DXY at 99.39, the dollar's influence is somewhat subdued on the hourly and 4-hour charts but remains a factor to monitor for the longer term.
Geopolitical developments, particularly those impacting supply routes or production capabilities, remain a significant wild card for WTI. Any news suggesting supply disruptions in major oil-producing regions could send prices soaring rapidly, potentially bypassing established resistance levels. Conversely, any de-escalation of tensions or signs of increased production from major players could lead to a swift correction. Traders are constantly monitoring headlines for shifts in global risk sentiment, which directly translates into volatility in the oil market. The current geopolitical climate amplifies this sensitivity.
From a fundamental perspective, inflation remains a persistent concern globally. Rising energy costs are a significant contributor to overall inflation, creating a complex feedback loop. Central banks are caught between trying to control inflation and supporting economic growth. If inflation continues to be 'red hot', as some Fed officials have indicated, it could force more aggressive monetary tightening, which typically dampens economic activity and, consequently, oil demand. However, supply-side constraints, exacerbated by geopolitical issues, might keep prices elevated even amidst slowing demand, leading to a stagflationary environment.
When developing a trading strategy for WTI around the $112.38 level, it's essential to consider multiple scenarios. A breakout above $115.77, confirmed by strong volume and bullish momentum across multiple timeframes, would present a clear long opportunity. The stop-loss could be placed below the breakout level or a key intraday support, managing risk effectively. On the flip side, a decisive close below $109.26 would signal a bearish reversal, prompting short positions with targets at lower support levels. The neutral scenario involves price consolidating between $109.26 and $115.77, offering range-trading opportunities but requiring tighter risk controls.
The current trading environment for WTI demands a disciplined approach. While the daily technicals lean bullish, the short-term indicators and the ever-present geopolitical risks warrant caution. Traders should prioritize risk management, ensuring that any positions taken are appropriately sized and have clearly defined stop-loss levels. Waiting for confirmation, such as a clear break of key resistance or support levels, is often more rewarding than trying to anticipate the market's next move prematurely. The energy markets are known for their rapid shifts, and adaptability is key.
Looking ahead, upcoming economic data releases, particularly those related to inflation and employment in major economies like the US and Europe, will be critical. Any surprises in these reports could significantly sway market sentiment and impact oil prices. Furthermore, any new developments on the geopolitical front, especially concerning major oil-producing nations or key shipping lanes, could trigger substantial price movements. The confluence of these factors makes WTI a dynamic and potentially profitable, yet high-risk, trading instrument.
Bearish Scenario: WTI Retreats Below Key Support
55% ProbabilityNeutral Scenario: Sideways Consolidation
25% ProbabilityBullish Scenario: WTI Breaks Resistance
20% ProbabilityFrequently Asked Questions: WTI Analysis
What happens if WTI breaks below $109.26 support?
A break below the $109.26 support level, particularly on the daily chart, would signal a bearish reversal. This could lead to further downside pressure, targeting the next key level at $105.87, as market sentiment shifts away from the current bullish trend.
Should I buy WTI at current levels near $112.38 given the strong daily trend?
Buying at $112.38 requires careful risk management. While the daily trend is strong (ADX 59.22), short-term indicators show bearish divergence. Consider waiting for a confirmed break above $115.77 resistance, or a pullback to a more favorable support level like $109.26, before entering a long position.
Is the RSI at 70.04 on the daily chart a sell signal for WTI?
An RSI of 70.04 on the daily chart is considered overbought. In a strong uptrend, however, this can persist. While it suggests caution and potential for a short-term pullback, it's not an immediate sell signal on its own. Look for confirmation from other indicators like MACD or price action failing to hold higher levels.
How will ongoing geopolitical tensions affect WTI prices this week?
Escalating geopolitical tensions, especially concerning supply routes or production in key regions, could rapidly drive WTI prices higher, potentially breaking through resistance levels like $115.77. Conversely, any de-escalation might lead to a price correction, as speculative premiums diminish.
Track markets in real-time
AI-powered analysis, technical indicators and real-time price data.
Join Our Telegram Channel
Breaking market news, AI analysis and trading signals instantly.
Join Channel