
WTI Trades Near $96.26; Key Data Looms Amidst Shifting Geopolitics
WTI crude oil hovers near $96.26. Technicals show a strong downtrend on 1H/4H, but daily suggests a potential reversal. Key data releases and geopolitical shifts to watch.
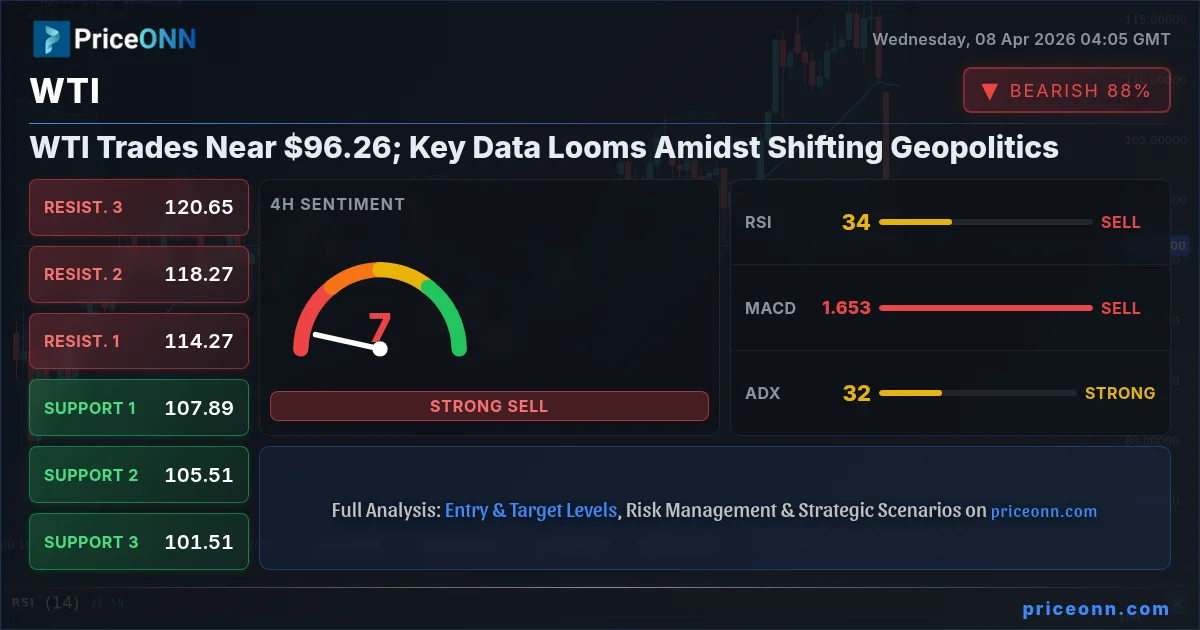
WTI crude oil is currently navigating a critical juncture, trading near the $96.26 mark. This price point arrives amidst a complex interplay of technical signals and evolving geopolitical narratives. While short-term charts suggest a bearish momentum, the daily outlook presents a more nuanced picture, hinting at potential consolidation or even a shift in trend. Traders are closely watching key data releases and the geopolitical landscape, both of which are poised to significantly influence WTI's trajectory in the coming days. The current environment demands a data-driven approach, focusing on specific levels and indicators to discern the most probable path forward.
- WTI crude oil is trading at $96.26, showing a strong downtrend on the 1-hour and 4-hour charts with ADX at 41.49 and 32.14 respectively.
- The daily chart, however, presents a mixed signal with RSI at 52.28 and a strong ADX of 56.18, indicating a powerful trend that is currently facing resistance.
- Key support levels for WTI are identified at $95.90 (1H), $95.33 (1H), and $94.60 (1H), while resistance is eyed at $97.20 (1H), $97.93 (1H), and $98.50 (1H).
- Geopolitical tensions in the Middle East and the resulting impact on oil prices are a significant factor, alongside upcoming economic data that could sway market sentiment.
The 1-hour chart for WTI paints a decidedly bearish picture, a narrative strongly supported by technical indicators. The Average Directional Index (ADX) is reading a robust 41.49, confirming a powerful downtrend. This is further underscored by the Relative Strength Index (RSI) at 20.23, firmly entrenched in oversold territory. This typically signals that selling pressure has been intense, and while it doesn't guarantee an immediate reversal, it suggests the market is ripe for a potential bounce. The Moving Average Convergence Divergence (MACD) histogram is also firmly in negative territory, reinforcing the bearish momentum. The Stochastic Oscillator, with K at 21.65 and D at 18.41, shows a slight uptick, hinting at a potential short-term pause in the selling, but still deeply within the oversold zone. This confluence of indicators on the 1H timeframe suggests that short-term traders might be looking for opportunities to fade any rallies, expecting further downside pressure.
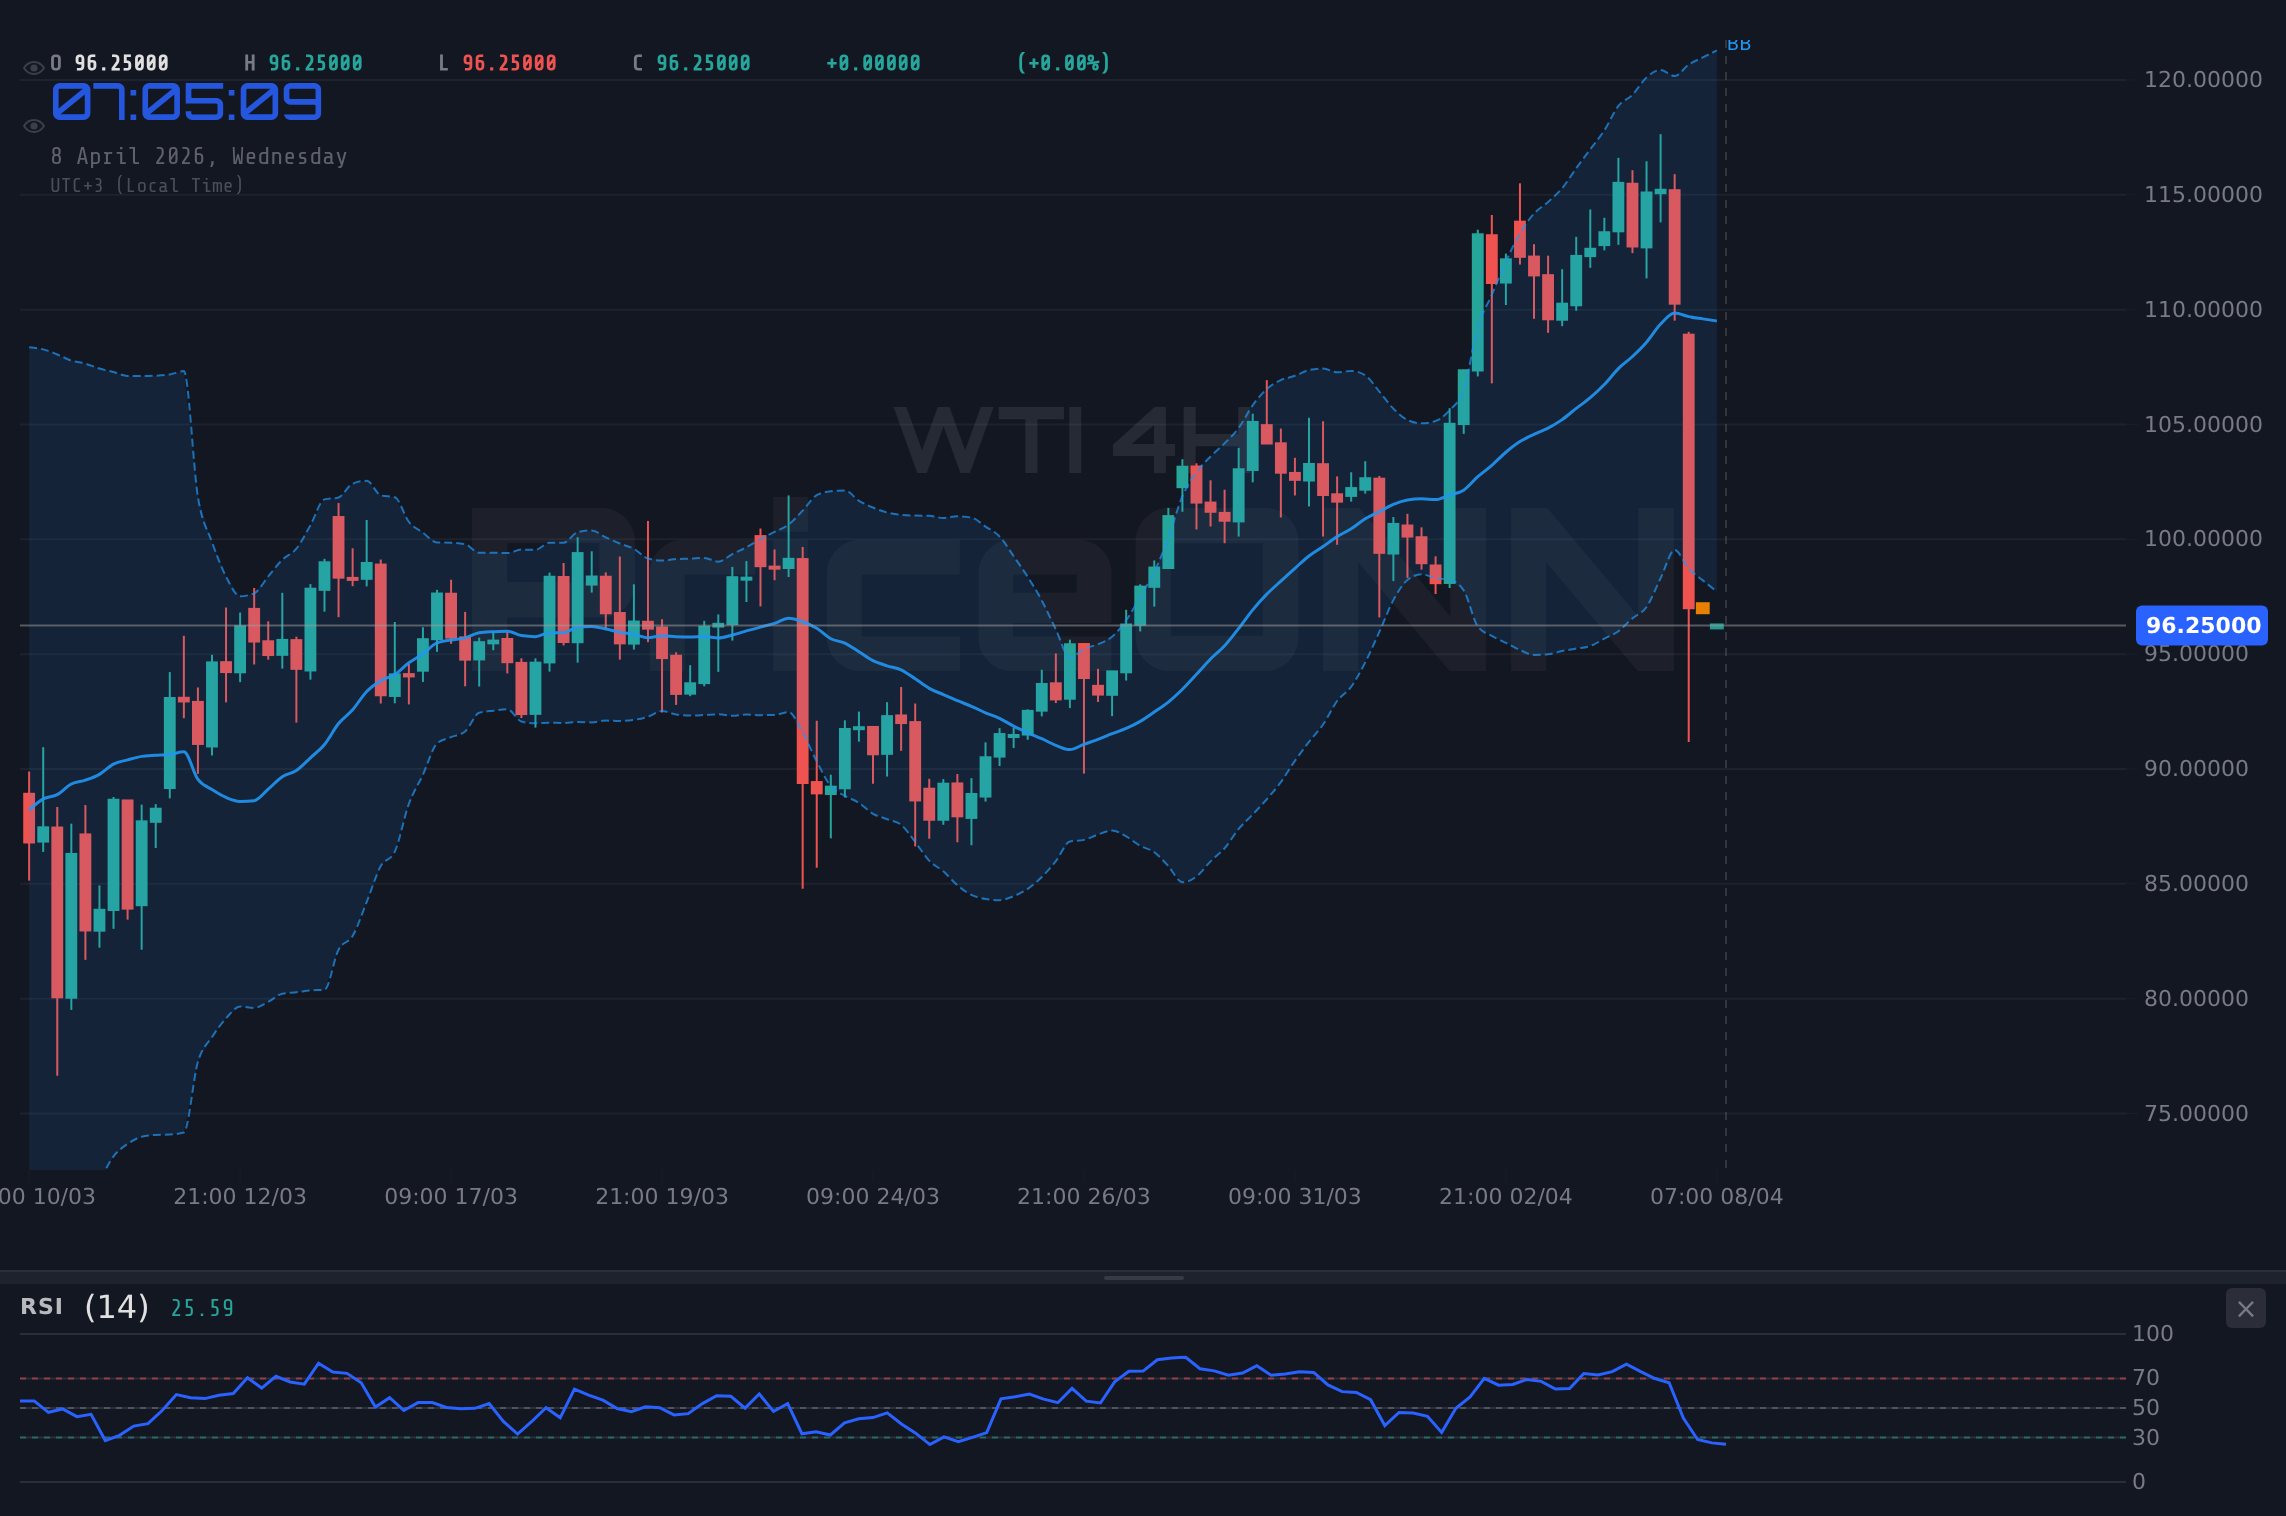
However, zooming out to the 4-hour timeframe introduces a layer of complexity to the WTI outlook. While the trend is still classified as bearish with an ADX of 32.14, the strength of this trend is slightly diminished compared to the 1-hour chart. The RSI here sits at 33.54, still in oversold territory but less extreme than the 1-hour reading. The MACD remains negative, but the histogram shows less pronounced selling pressure. The Stochastic Oscillator presents a conflicting signal; K (34.32) is below D (62.38), indicating a continued bearish bias, yet the divergence could suggest that the downward momentum is waning. Bollinger Bands are hugging the lower band, consistent with a strong downtrend, but a close proximity to the middle band could signal a potential shift if the price can reclaim it. The overall picture on the 4H chart is one of a strong downtrend that might be facing some headwinds, suggesting that while bears are in control, the conviction might be starting to waver.
The daily chart for WTI offers the most intriguing perspective, presenting a significant divergence from the shorter timeframes. Despite the strong bearish signals on the 1H and 4H, the daily ADX is reading a formidable 56.18, which technically indicates an extremely strong trend. However, the directionality of this trend is complex. The RSI at 52.28 hovers just above the neutral 50 mark, suggesting a balance between buyers and sellers, or a market waiting for a clear catalyst. The MACD is negative, but the histogram has shown a notable reduction in bearish momentum, and the signal line is showing signs of flattening. The Stochastic Oscillator, with K at 63.16 and D at 79.88, is displaying a bearish crossover (%K
This multi-timeframe analysis highlights a critical tension: short-term bearish momentum versus a potentially stabilizing or even bullish undertone on the daily chart. The current price of $96.26 sits precariously close to significant support levels identified on the 1-hour timeframe, specifically around $95.90 and $95.33. A break below these levels would likely accelerate the bearish trend seen on the shorter timeframes, potentially targeting $94.60. Conversely, if WTI can hold these support levels and begin to reclaim higher ground, the daily chart's neutral-to-bullish lean could come into play. Resistance on the 1-hour chart is capped at $97.20, followed by $97.93 and the psychological $98.50 level. A decisive move above $97.20, confirmed by increasing volume and positive shifts in shorter-term indicators, could signal the start of a counter-trend rally.
The recent news flow adds another layer of complexity. Reports indicate that gold prices surged above $4,750 following a delay in a potential Iran-US strike, which initially eased geopolitical jitters. However, other reports highlight persistent geopolitical tensions and a weakening US Dollar Index (DXY), which typically supports oil prices. The DXY itself is currently trading around 98.66, showing a bearish trend on the 1-hour chart but a mixed picture across timeframes. A sustained drop in the DXY often correlates with a rise in commodities like WTI. Furthermore, news regarding US crude oil inventories spiking by 10 million barrels could exert downward pressure, a factor that has historically influenced WTI prices significantly. This inventory data, combined with geopolitical uncertainties, creates a volatile environment where price action needs to be monitored very closely.
Considering the ADX readings across timeframes – a strong 41.49 on 1H, 32.14 on 4H, and a very strong 56.18 on 1D – it's clear that a powerful trend is in play. However, the conflicting signals from RSI and Stochastic across these timeframes suggest that the market might be at an inflection point. The high ADX on the daily chart, despite a neutral RSI, could indicate a strong trend that is either consolidating before a major move or experiencing a period of exhaustion. If the daily trend strength is indeed signaling a powerful move, the question becomes its direction. Given the oversold conditions on shorter timeframes and the neutral RSI on the daily, a bounce from current levels is a plausible scenario, especially if geopolitical tensions de-escalate further or if upcoming economic data proves supportive.
The economic calendar, while not featuring immediate high-impact events directly impacting WTI today, holds significance for the broader market sentiment. Upcoming data releases for USD, particularly those related to inflation and employment, will shape expectations for Federal Reserve policy. A weaker-than-expected US economic outlook or a more dovish tone from the Fed could weaken the dollar, potentially boosting WTI prices. Conversely, strong economic data could lead to a strengthening dollar and increased risk aversion, putting pressure on oil. The correlation between WTI and the DXY is a key element to watch; a significant move in either direction could provide clues about the broader market's risk appetite and its impact on commodity prices.
From a trading perspective, the $96.26 level presents a challenging environment. The strong bearish signals on shorter timeframes suggest caution for long positions. However, the potential for a daily chart reversal, coupled with oversold conditions on the 1H RSI, might present a contrarian buying opportunity for those willing to accept higher risk. The key will be confirmation – a clear break above immediate resistance levels like $97.20, or a decisive hold of the $95.90 support followed by a strong upward move. Without such confirmation, the path of least resistance appears to be downwards in the very short term, but the longer-term picture remains open to interpretation.
The prevailing trend strength indicated by the ADX across all timeframes is undeniable. On the 1-hour chart, the ADX at 41.49 clearly signals a robust downtrend. This is corroborated by the MACD histogram being deeply negative and the RSI sitting at 20.23, signaling extreme oversold conditions. The Stochastic Oscillator, while showing a slight %K rise, remains in deeply oversold territory. This suggests that any short-term rallies are likely to be met with selling pressure as traders look to fade the move. The immediate support level to watch is $95.90. A breach of this level would confirm the bearish bias on the 1-hour timeframe and could lead to a rapid decline towards $95.33 and potentially $94.60. Resistance remains capped near $97.20, with a more significant hurdle at $97.93.
Transitioning to the 4-hour timeframe, the ADX moderates slightly to 32.14, still indicating a strong trend, but with less conviction than the 1-hour. The RSI at 33.54 remains oversold, and the MACD histogram is negative, though less pronounced. The Stochastic Oscillator's %K value is below %D, reinforcing the bearish sentiment. However, the gap between the K and D lines is narrowing, which could suggest momentum is slowing. The price action is currently hovering near the lower Bollinger Band, a typical characteristic of a strong downtrend. A hold above the $95.33 support level is crucial here. If this level holds, a move back towards the middle Bollinger Band, around $96.90, becomes a possibility, although breaking the immediate resistance at $97.20 would be the first hurdle.
The daily chart presents the most compelling case for a potential shift or at least a pause in the bearish momentum. The ADX at 56.18 is exceptionally high, indicating an extremely strong trend, but the RSI at 52.28 suggests this trend is not overwhelmingly directional at this very moment, or it's consolidating after a strong move. The MACD histogram is narrowing, and the RSI is holding steady above 50. While the Stochastic shows a bearish crossover, it is moving away from the upper extreme. This confluence suggests that while the daily trend is technically strong, it might be entering a phase of consolidation or a potential reversal. The key resistance level on the daily chart is $97.20, followed by $97.93 and $98.50. A sustained move above $97.20, especially if accompanied by positive shifts in shorter-term indicators and favourable geopolitical news, could signal the beginning of a reversal.
Geopolitical developments continue to cast a long shadow over the oil markets. Reports of a potential de-escalation between Iran and the US, as suggested by the brief surge in gold prices, could theoretically reduce risk premiums associated with oil supply disruptions. However, other intelligence points to persistent regional tensions, which would naturally support higher oil prices. This dichotomy creates uncertainty. Furthermore, the US Dollar Index (DXY), currently showing bearish signals on the 1-hour chart at 98.66, often moves inversely to oil prices. A continued weakening of the dollar could provide a tailwind for WTI, especially if it coincides with supportive inventory data or a reduction in geopolitical risk premiums. The interplay between these factors is crucial for determining WTI's short-to-medium term direction.
The critical support at $95.90 on the 1-hour chart is the immediate focal point. A break below this level, confirmed by increased volume and bearish momentum across shorter timeframes, would likely trigger further selling, targeting $95.33 and potentially $94.60. On the flip side, holding this support and seeing a move back above $97.20 would be the first sign of a potential bullish reversal. This would need to be confirmed by a shift in daily indicators and sustained positive geopolitical news. The market is currently balanced between the strong downtrend signals on shorter timeframes and the potential for stabilization or reversal suggested by the daily chart and external factors like geopolitical risk and dollar weakness.
The strong ADX readings are a testament to the prevailing trend's power, but the conflicting RSI and Stochastic signals across different timeframes suggest a market at a crossroads. On the 1-hour chart, the RSI at 20.23 is deeply oversold, and while the MACD histogram is negative, it's narrowing. This suggests that the selling pressure might be exhausting itself, making the $95.90 support level a critical point to defend. A failure to hold this level would invalidate any immediate reversal hopes and reinforce the bearish trend. However, if $95.90 holds and price begins to climb, traders will look for confirmation above $97.20, which would then target $97.93 and potentially $98.50.
Looking at the 4-hour chart, the ADX at 32.14 still points to a strong trend, but the RSI at 33.54 and the narrowing MACD histogram suggest a loss of downward momentum. The Stochastic oscillator shows a bearish crossover, but the K line is rising, indicating potential for a bounce. The key here is the price action relative to the $95.33 support level. If this level holds, it could pave the way for a move back towards the $96.90 area (middle Bollinger Band) and potentially challenge the $97.20 resistance. A decisive break below $95.33, however, would reinforce the bearish outlook, targeting $94.60.
The daily chart, with its exceptionally high ADX of 56.18, signifies a powerful trend, but the RSI at 52.28 and the narrowing MACD histogram suggest that this trend may be losing steam or consolidating. This creates a scenario where the market could be coiling for a significant move. If geopolitical tensions ease and supportive economic data emerges, WTI could break above the daily resistance at $97.20, targeting $97.93 and then $98.50. Conversely, if supply concerns resurface or if economic data disappoints, the downtrend from shorter timeframes could reassert itself, potentially pushing prices back towards the daily support levels around $93.84.
The current price action around $96.26 is a battleground between the strong short-term bearish momentum and the potential for a daily trend reversal. The high ADX readings suggest that whichever direction the market breaks, it's likely to be a strong move. Traders should be on alert for confirmation signals. A break above $97.20, supported by positive news and improving daily indicators, could signal a bullish reversal targeting $98.50. Conversely, a decisive break below $95.90, especially on increased volume, would likely confirm the bearish trend, with $94.60 as the next logical target. The geopolitical landscape and upcoming economic data will be critical catalysts in determining the outcome.
Bearish Scenario: Trend Continuation
65% ProbabilityNeutral Scenario: Consolidation & Volatility
25% ProbabilityBullish Scenario: Reversal Attempt
10% ProbabilityFrequently Asked Questions: WTI Analysis
What happens if WTI breaks below the $95.90 support level on the 1-hour chart?
A break below $95.90 would likely confirm the bearish trend seen on shorter timeframes, potentially triggering a sell-off towards $95.33 and $94.60. This scenario is given a 65% probability, especially if volume increases on the break.
Should I buy WTI at current levels near $96.26 given the oversold RSI on the 1-hour chart?
Buying at current levels carries risk due to the strong bearish trend on shorter timeframes. A high-conviction buy signal would require confirmation above $97.20 resistance, with a 10% probability assigned to a successful reversal attempt from these levels.
Is the RSI at 20.23 on the 1-hour chart a direct buy signal for WTI?
An RSI reading of 20.23 indicates extreme oversold conditions, suggesting selling pressure may be exhausting. However, it's not a standalone buy signal; confirmation through price action, like holding $95.90 support or breaking above $97.20 resistance, is crucial.
How will upcoming economic data potentially affect WTI prices around $96.26?
Upcoming US economic data, particularly inflation and employment figures, will influence Fed policy expectations. Weaker data could weaken the dollar and support WTI, while stronger data might strengthen the dollar and pressure oil, creating volatility around the $96.26 level.
| Indicator | Value | Signal | Interpretation |
|---|---|---|---|
| RSI (14) | 20.23 | Oversold | Extreme selling pressure on 1H, potential for bounce. |
| MACD Histogram | - | Negative | Bearish momentum persists but may be waning. |
| Stochastic | K: 21.65, D: 18.41 | Oversold | Deeply oversold, potential for divergence or bounce. |
| ADX | 41.49 | Strong Trend | Powerful downtrend on 1H. |
| Bollinger Bands | Lower Band Breach | Bearish | Price trading below lower band suggests strong selling. |
Navigating the WTI market at $96.26 requires a keen eye for detail and a disciplined approach. The strong short-term bearish signals are undeniable, but the potential for a daily chart reversal cannot be ignored. The interplay of technical indicators, geopolitical events, and economic data creates a dynamic environment. By focusing on the specific price levels and trigger conditions outlined, traders can position themselves to capitalize on the most probable outcomes while effectively managing risk. Remember, in trading, preparedness and adherence to a well-defined plan are paramount for success.
Track markets in real-time
AI-powered analysis, technical indicators and real-time price data.
Join Our Telegram Channel
Breaking market news, AI analysis and trading signals instantly.
Join Channel