Brent: The Downtrend Begins to Crack
A 19% Collapse, Then a Quiet Turn
Few markets swung as violently in 2026 as crude oil. In April 2026, the shutdown of the Strait of Hormuz sent Brent to its loftiest per barrel readings since 2022, igniting fears of a sustained supply shock. Then the script flipped.
By the close of May, the rally had unraveled. Prices shed roughly 19% over the month, the steepest monthly decline since the depths of the pandemic. The trigger was not a barrel of supply but a round of diplomacy: ceasefire talks between the United States and Iran drained the geopolitical premium that had inflated quotes only weeks earlier.
Supply dynamics piled on the pressure. OPEC+ agreed to lift output by 188,000 barrels per day in June, adding fresh weight to a market already retreating from its highs. Traders, understandably, stayed defensive.
Here is the catch. Even a signed agreement may not erase the underlying threat. Risks to tanker movement through the strait have not vanished, and any hint of stalled or collapsing negotiations could pull the risk premium right back into the price. Pricing data confirms that the market is treating calm as conditional, not permanent.
Reading the Four-Hour Chart
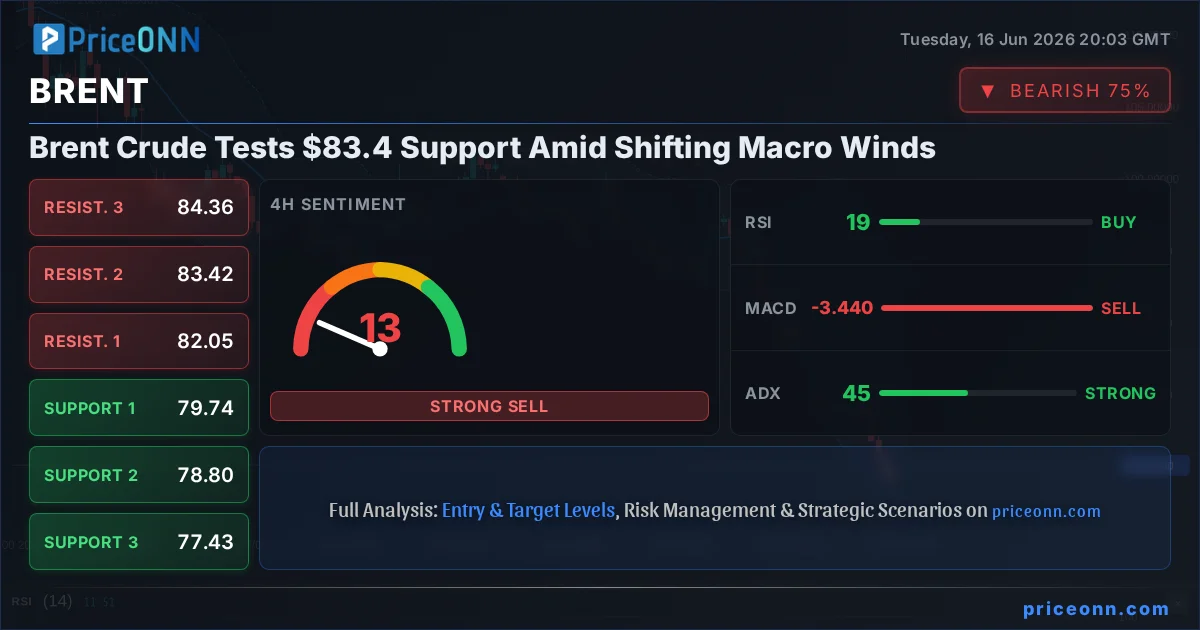
On the four-hour timeframe, Brent (XBRUSD) has carved out a short-term downtrend that took shape after the reversal on 30 April, with the move beginning from the 114.5 region. The selling found a floor late in May around the 93 zone, a level that lined up with green support before buyers stepped back in.
That recovery is now running into a test. Price is pressing against the descending trendline and probing the upper edge of the current profile at 99.600, treating it as support rather than a ceiling. The profile itself runs between 95.400 and 99.600.
The point of control, the band where the heaviest trading clustered during the reversal phase, sits in the 96.950 to 97.150 area. Above the profile, the first meaningful obstacle is 101.800; clearing and holding over the profile would likely turn that level into the next battleground. Slip back beneath 99.600, and the point of control becomes the logical cushion for another attempt higher.
Momentum is leaning constructive. The RSI and its moving averages read 57, 55 and 49, with the indicator riding above both averages and their upward slope hinting at firming short-term bullish drive.
What Smart Money Is Watching
The deciding variable for the weeks ahead is straightforward: the trajectory of US-Iran diplomacy. Progress keeps the risk premium suppressed and favors range trading; any sign of breakdown could reignite a sharp geopolitical bid. Trading desks note that the 5 June US labour market report adds another layer, since softer or stronger employment data reshapes expectations for energy demand.
For positioning, the assets to track extend well beyond the barrel. WTI tends to move in lockstep with Brent and offers a cleaner read on US balances. The USD/CAD pair remains tightly bound to crude given Canada's export exposure, and a falling oil price often lifts the loonie's counterpart. Energy equities and broader inflation expectations also sit in the blast radius, since cheaper crude eases input costs across the economy.
The opportunity, and the risk, both live at the trendline. A confirmed break and hold above the profile would tilt the short-term bias higher toward the 101.800 zone. A rejection that drags price back under 99.600 keeps the recovery fragile and hands control back to sellers. This is a decision point, and the next clean signal will likely set the tone.
Track markets in real-time
Empower your investment decisions with AI-powered analysis, technical indicators and real-time price data.
Join Our Telegram Channel
Get breaking market news, AI analysis and trading signals delivered instantly to your Telegram.
Join ChannelFollowing the tariffs, investors were also expecting the US dollar to strengthen. The Bank of England has not ruled out a rise in the repo rate. The US dollar has recorded its best two-day rally since the start of the armed conflict in the Middle East. At that time, it rose on strong demand for […] The post The Fed Drove the Dollar to Its Previous Peaks appeared first on ActionForex.
(RTTNews) - Gold prices fell sharply on Friday and were on track for a third weekly loss amid expectations that central banks including the Federal Reserve will raise interest rates to curb inflation.
The European Central Bank may have delivered its June rate hike, but its policymakers are already making the case for why the tightening cycle may not be over. Speaking in Paris today, Chief Economist Philip Lane dismissed suggestions that the ECB should have paused this month, arguing that “it would be very hard to make […] The post ECB’s Lane Says Staying at 2% Was Not an Option, Wunsch Signals Hike Risk appeared first on ActionForex.
EUR/USD fell on Friday to its lowest level since 31 March 2026 and is holding near 1.1457. The US dollar is being supported by rapidly growing expectations of further Federal Reserve policy tightening following more hawkish-than-expected signals from the regulator. This week, the Fed left interest rates unchanged. However, the updated forecasts showed that half […] The post EUR/USD Loses Ground as Market Sentiment Favours the US Dollar appeared first on ActionForex.
EUR/GBP’s advance this week is telling a bigger story than simple Euro strength. What markets are really pricing is a fading belief that the Bank of England will need to deliver significantly more tightening than the European Central Bank. For months, Sterling benefited from the assumption that sticky UK inflation would eventually force policymakers into […] The post EUR/GBP Gains as Markets Scale Back BoE Tightening Expectations, More Upside Ahead appeared first on ActionForex.
Japan’s core consumer inflation remained unchanged at 1.4% yoy in May, matching expectations and staying below the Bank of Japan’s 2% target for a fourth consecutive month. Headline CPI edged up from 1.4% yoy to 1.5% yoy. The closely watched core-core measure, which excludes both fresh food and energy, slowed from 1.9% yoy to 1.8% […] The post Japan Core Inflation Holds at 1.4%, Fuel Subsidies Continue to Suppress Price Pressures appeared first on ActionForex.
New Zealand recorded a goods trade surplus of NZD 800m in May, slightly below expectations of NZD 875m, as strong export growth was more than offset by an even larger increase in imports. Goods exports rose NZD 1.4b, or 18% yoy, to NZD 8.9b, while imports climbed NZD 1.7b, or 26% yoy, to NZD 8.1b. […] The post New Zealand Exports Jump 18%, But Faster Import Growth Limits Trade Surplus appeared first on ActionForex.
Key insights from the week that was. The RBA Monetary Policy Board (MPB) unanimously decided to leave the cash rate unchanged at 4.35% this week, as widely expected. However, in the subsequent communications, the MPB clearly leaned against the idea that the hiking cycle is definitively over. After emphasising that both headline and underlying inflation […] The post Cliff Notes: Policy Matters appeared first on ActionForex.
Since establishing the all‑time high on October 6, 2025 at $126,272, Bitcoin (BTCUSD) has entered a pronounced corrective phase. The Elliott Wave sequence from that peak suggests further downside potential, with the extreme area projected between $41,411 and $52,204. In the short term, the decline from the May 6, 2026 high concluded at $59,081, marking […] The post Elliott Wave Analysis: Bitcoin’s (BTCUSD) Countertrend Bounce Set to Fail appeared first on ActionForex.
The Bank of England kept rates on hold in a 7-2 vote split, as widely expected. The economy is slowing, the labour market is cooling and, so far, inflation worries have not materialised. We expect an unchanged Bank Rate for the coming year, with risks tilted towards a hike this year and potential for lower […] The post Bank of England Review – On Hold as Hawkish Arguments Remain Scarce appeared first on ActionForex.
Market Overview The crypto market capitalisation fell 2.6% over the day to $2.2T, following a global sell-off of risky assets triggered by hawkish comments from the new Fed Chair, Warsh. However, after the initial sell-off, buyers appear to be returning to the markets, in line with a recovery in risk appetite in the equity market. […] The post Bitcoin at $64K: Sell-Off Triggered by Hawkish Comments from the New Fed Chair appeared first on ActionForex.
GBPUSD is attempting to stabilise near 1.3317 on Thursday morning. The pound sterling barely reacted on Wednesday to weaker-than-expected UK inflation data. Investors preferred to take a wait-and-see approach ahead of today’s labour market statistics and the Bank of England meeting. However, GBP still had to respond to movements in the US dollar following the […] The post GBPUSD Awaits Bank of England Meeting Near April Lows appeared first on ActionForex.