Crude Oil (Cl_F): High-Probability Sell Setup at the Blue Box Area
Unpacking the Crude Oil Sell-Off at the Blue Box
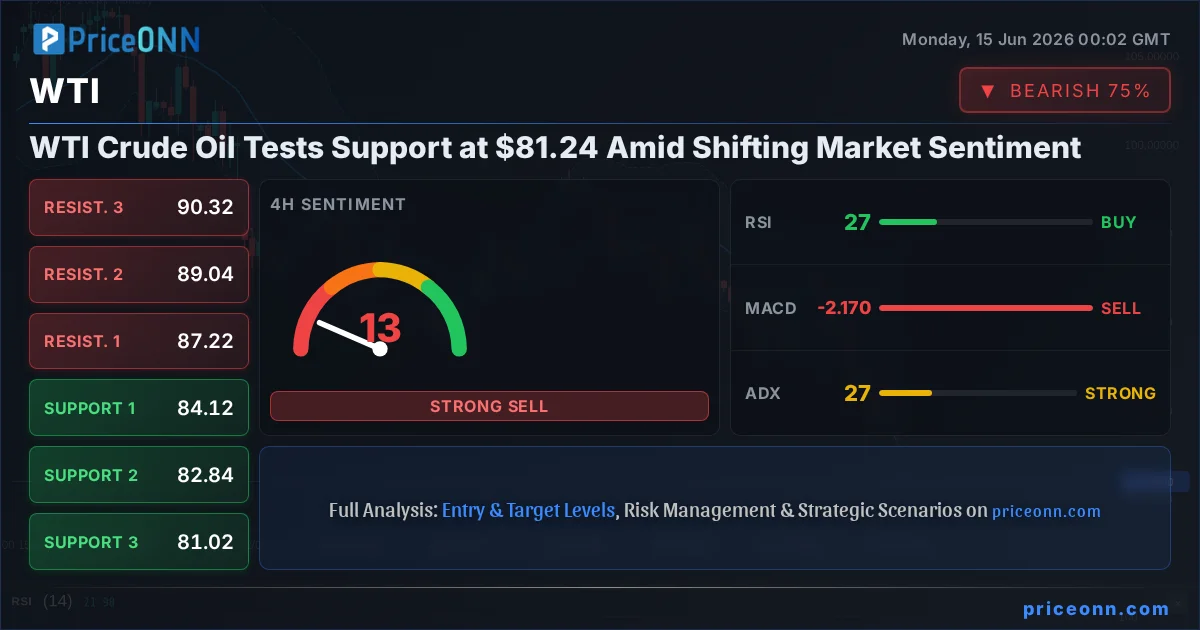
The trajectory of Crude Oil Futures (CL_F) has presented a compelling technical picture, particularly concerning a recent encounter with a significant resistance area. For those attuned to market dynamics, the price action following the 109.67 high has hinted at ongoing downward pressure. This pressure intensified as the commodity ascended into a specifically identified 'Blue Box' selling zone, a level where institutional sellers have historically shown a strong presence.
The immediate aftermath of reaching this zone, specifically between 91.43 and 93.96, saw sellers step in decisively. This reaction aligns with a recognized Elliott Wave pattern, suggesting a corrective phase that could lead to further price depreciation. The prevailing market sentiment, as indicated by this technical setup, favors short positions over long ones, anticipating a substantial pullback from this critical juncture.
Market data shows that the commodity is charting a clear three-wave correction, characteristic of a Zig Zag pattern within the broader Elliott Wave framework. The extreme zone for this pattern, identified as 91.43-93.96, has now been tested and has yielded a notable seller response. This suggests that the bullish momentum may be waning, opening the door for a renewed bearish trend.
The strategy advocated involves favoring short trades initiated from the Blue Box area. The expectation is for a minimum three-wave retracement from this selling zone, consistent with the primary bearish trend. A key risk management technique involves moving the stop loss to break-even once the price decline reaches the 50% Fibonacci retracement level against the 'b' wave low. Partial profit-taking at this stage would further de-risk the trade.
It's a crucial distinction to understand that this analysis is not solely reliant on Elliott Wave theory. A comprehensive approach integrates higher-time-frame cycle analysis, which reveals an incomplete market structure as a primary driver of price action. This is further augmented by correlation studies and a deep understanding of the broader market context. Advanced techniques for identifying incomplete bullish and bearish sequences are central to the educational content provided to members.
The visual cues on the charts are designed for clarity. A red bearish stamp coupled with a blue box signifies a selling opportunity, while a green bullish stamp with a blue box indicates a buying setup. Charts marked with black stamps are deemed untradable, simplifying decision-making for traders.
Did you know that approximately 90% of traders struggle due to a lack of understanding of market patterns? Mastering these patterns, particularly the nuanced Elliott Wave sequences, is what separates successful traders from the rest. The official trading strategy for navigating three, seven, or eleven swing patterns, along with equal leg formations, is detailed in educational videos available to members.
The recent price action on June 13, 2026, confirmed the seller's dominance within the 91.43–93.96 Blue Box. The subsequent decline to new lows solidified the bearish outlook. Members who acted on the short trade recommendation are now in a profitable position, having already secured their positions by moving stops to break-even.
Market Ripple Effects
The confirmed rejection of crude oil at the 91.43–93.96 resistance zone carries significant implications beyond the CL_F contract itself. This bearish signal from a key commodity could influence broader market sentiment and impact correlated assets. Traders and investors should closely monitor several interconnected markets.
Firstly, the US Dollar Index (DXY) often exhibits an inverse correlation with oil prices. A sustained dip in crude could potentially provide a tailwind for the dollar, especially if it signals a broader slowdown in global economic activity or a shift in inflation expectations. Conversely, a weakening dollar could offer some support to oil prices, creating a complex interplay.
Secondly, energy sector equities, particularly major oil producers and service companies, are directly exposed. A confirmed bearish trend in oil prices would likely translate into pressure on these stocks, affecting indices like the S&P 500 Energy Sector ETF (XLE). Investors might anticipate reduced earnings and dividends, leading to sell-offs.
Thirdly, inflation expectations are intrinsically linked to energy costs. A significant decline in crude oil prices could help temper inflation concerns, potentially influencing central bank policy expectations. This could indirectly affect bond yields and interest rate-sensitive assets. For instance, a perceived easing of inflationary pressures might lead to a reassessment of future rate hikes by the Federal Reserve.
Finally, emerging market currencies that are heavily reliant on commodity exports, such as the Canadian Dollar (CAD), will likely feel the impact. A sustained drop in oil prices could weaken these currencies, affecting their trade balances and overall economic stability. The key risk to monitor is whether this sell-off is a short-term correction within a larger uptrend or the beginning of a more prolonged bear market, which would have far-reaching consequences across global financial markets.
Track markets in real-time
Empower your investment decisions with AI-powered analysis, technical indicators and real-time price data.
Join Our Telegram Channel
Get breaking market news, AI analysis and trading signals delivered instantly to your Telegram.
Join ChannelPlatinum (PL) surged to fresh record highs in late January, marking a potential inflection point toward a long‑term secular bull market. This article explores the metal’s extended outlook and the evolving Elliott Wave framework that underpins its advance. Platinum (PL) Monthly Elliott Wave Chart The monthly Platinum chart highlights a decisive breakout into record territory, […] The post Platinum Elliott Wave View: Double Three Correction in Play appeared first on ActionForex.
Hello traders. In this technical article we’re going to take a quick look at the Elliott Wave charts of Dow Jones Futures published in members area of the website. As our members know, we have had many high-probability trading setups recently. YM_F is one of them.Dow Jones futures made a pullback that unfolded as an […] The post Dow Jones Futures ($Ym_F) Elliott Wave: Trading Setup Explained appeared first on ActionForex.
SpaceX’s success and geopolitics are driving the S&P 500 higher. Investors are hoping for future Fed rate cuts. Rumours of an imminent end to the conflict in the Middle East, SpaceX’s successes, positive news from the US economy and a decline in the likelihood of the Fed tightening policy have allowed the S&P 500 to […] The post S&P 500: on Track for a Recovery appeared first on ActionForex.
• The Bank of Japan is ready to raise the overnight rate. • Speculators are closing out their long positions on the US dollar. The US dollar opened with a downside gap, which is unlikely to be closed any time soon. Donald Trump announced a deal with Iran and the reopening of the Strait of […] The post The Yen: Time for a Hike! appeared first on ActionForex.
The Eurozone recorded a EUR 1.0bn deficit in goods trade with the rest of the world in April, a sharp deterioration from the EUR 8.7bn surplus recorded a year earlier. While exports continued to grow, stronger import demand more than offset the gains, highlighting the impact of rising external purchases on the region’s trade position. […] The post EU and Eurozone Trade Balances Slip Into Deficit Amid Strong Import Growth appeared first on ActionForex.
After months of uncertainty and escalating tensions, the United States and Iran have reached a peace agreement that includes the reopening of the Strait of Hormuz. The deal appears solid for now, though markets remain cautious - particularly given President Trump’s unpredictable track record, which leaves room for potential reversals. This shift in the geopolitical […] The post Bitcoin Analysis: Iran Peace Deal Sparks Hope - Is Bitcoin Ready to Bounce? appeared first on ActionForex.
The EURUSD pair is starting Monday’s trading session near 1.1468. This week, global financial markets will closely monitor two pivotal drivers: the prospects of a US-Iran nuclear deal and the upcoming Federal Reserve meeting. Any signs of progress in the negotiations could strip the geopolitical premium out of oil prices, subsequently weakening safe-haven demand for […] The post EUR/USD Ahead of the New Week: Expecting High Volatility appeared first on ActionForex.
The biggest geopolitical breakthrough of 2026 may have just given Gold the catalyst it needed. Gold opened the week with a bullish gap and surged back above 4,300 after Washington and Tehran announced a formal Memorandum of Understanding to end their months-long war. The agreement, brokered through intensive mediation by Pakistan and Qatar, includes: Ceasefire: […] The post Gold’s Bullish Reversal Takes Shape After US-Iran Breakthrough, 4366 Key Test Ahead appeared first on ActionForex.
Will the Fed Blink? Markets Enter High-Stakes Week of Global Rate Decisions Markets are entering a week where almost every major central bank is expected to stand still. Yet it could still become one of the most volatile policy weeks of the year. Decisions from the Federal Reserve, Bank of Japan, Reserve Bank of Australia, […] The post Will the Fed Blink? Markets Enter High-Stakes Week of Global Rate Decisions appeared first on ActionForex.
April’s manufacturing and wholesale reports on Monday and retail sales on Friday should support the Bank of Canada’s (and our) outlook of Canada’s growth resuming in Q2 after Q1’s contraction. Statistics Canada’s advanced estimate is a 4.6% rise in manufacturing sales, and a 0.6% increase in retail sales. Part of these reflect higher petroleum prices. […] The post April’s Manufacturing, Wholesale and Retail Data to Point to Canada’s Growth Rebound appeared first on ActionForex.
At its policy meeting on 11 June, the ECB raised its deposit rate by 25 basis points to 2.25%. This automatically raises the refinancing rate to 2.40% and the marginal lending rate to 2.65%. This decision was unanimous, based entirely on the forecasts of the Eurosystem’s economists and advocated by ECB Chief Economist Lane. The […] The post The ECB’s Interest Rate Hike Is More Than an Insurance Hike, but No Signal for a Start of a Tightening Cycle appeared first on ActionForex.
As the chart shows, the US Dollar Index (DXY) has gained more than 4% from its January lows, with the move accelerating from February 2026 onwards. Today, the dollar finds itself at a technically and fundamentally critical point, one that could define the near-term direction not only of the greenback itself, but of equity indices, […] The post US Dollar Index Analysis: Dollar at a Crucial Point, What’s Next? appeared first on ActionForex.