Santacruz Silver Mining (SCZM) Shares Enter Oversold Territory

Silver Miner Enters Technical Sell-Off Zone
The market saw a significant downturn for Santacruz Silver Mining Ltd (SCZM) shares on Thursday, pushing the stock into what technical analysts define as oversold territory. The price touched a low of $6.90 during the trading session, signaling a potential shift in momentum.
This designation of "oversold" is derived from the Relative Strength Index (RSI), a widely followed momentum oscillator. The RSI operates on a scale from 0 to 100, with readings below 30 typically indicating that an asset has been sold off too rapidly and may be due for a price rebound.
Examining the stock's performance over the past year reveals a stark contrast between its recent lows and its peak. SCZM has traded as low as $0.2626 and reached a high of $17.645 within the last 52 weeks. The current trading price of $7.49 represents a notable decline from its yearly zenith and a 4.6% drop on Thursday alone.
This rapid descent into oversold conditions often captures the attention of traders looking for potential buying opportunities, though it also underscores underlying selling pressure. The question for many investors will be whether this technical signal precedes a reversal or simply marks a pause in a larger downtrend.
Reading Between the Lines
The recent price action in Santacruz Silver Mining (SCZM) shares, pushing them below the critical 30 RSI threshold, paints a picture of accelerated selling pressure. While technical indicators like the RSI are not crystal balls, they serve as valuable tools for identifying potential turning points in market sentiment. A sustained move into oversold territory can sometimes precede a period of consolidation or a bounce back, but it can also confirm the strength of a prevailing bearish trend.
The sharp decline on Thursday, resulting in a 4.6% loss for the day, suggests that market participants are actively taking profits or cutting losses, perhaps reacting to broader market sentiment or specific news impacting the silver mining sector. The proximity of the current price to the lower end of its 52-week range, $0.2626, highlights the dramatic volatility inherent in commodity-linked equities.
For investors and traders, this technical reading presents a dual-edged sword. On one hand, oversold conditions can signal that an asset is undervalued relative to its recent trading history, potentially offering an attractive entry point for those with a longer-term bullish outlook on silver or the company itself. On the other hand, it could be a warning sign of deeper fundamental issues or a signal that further downside is imminent before any meaningful recovery can take hold.
Market Ripple Effects
The technical downturn in SCZM shares, while specific to the company, can offer broader insights into the sentiment surrounding the silver market and related assets. A pronounced drop in a silver miner's stock can sometimes echo across the sector, potentially influencing other precious metal miners and even the price of silver itself, though the correlation is not always direct.
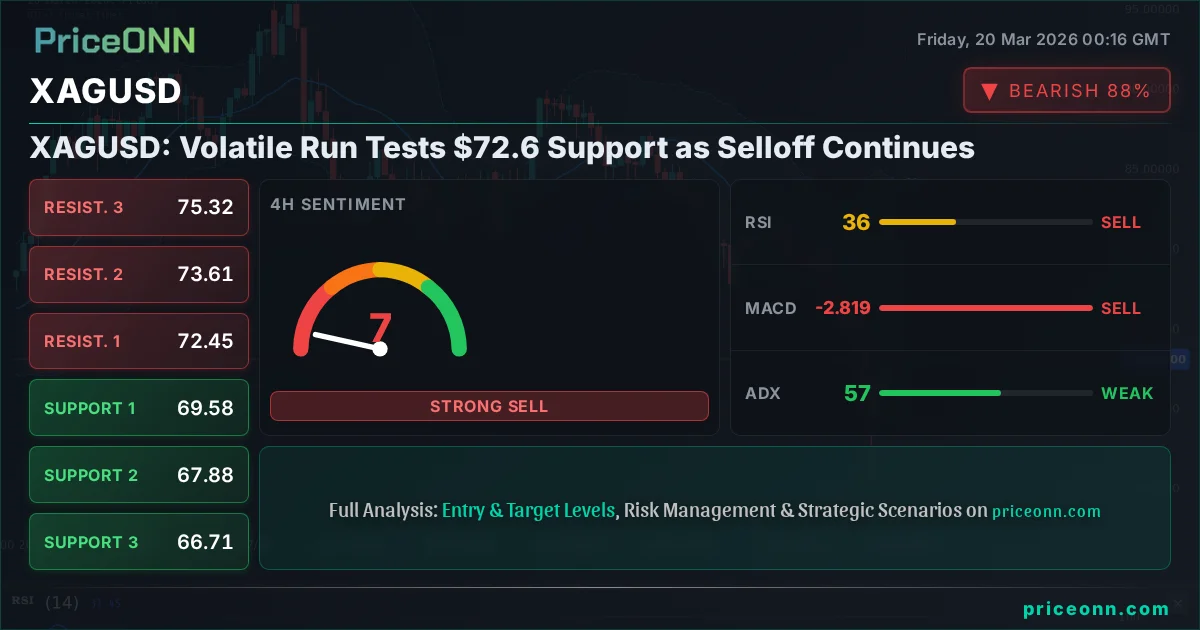
Traders will be closely watching how silver prices (XAGUSD) react in the short term. If silver holds steady or begins to rally, it could provide a tailwind for SCZM and its peers, potentially validating the oversold signal as a precursor to a rebound. Conversely, if silver continues to face headwinds, it would add further pressure on mining stocks like Santacruz.
Furthermore, the performance of SCZM could be influenced by broader macroeconomic factors, particularly movements in the US Dollar Index (DXY). A strengthening dollar often puts downward pressure on dollar-denominated commodities like silver, which could exacerbate the selling pressure on miners. Investors should also monitor the performance of broader equity indices, such as the S&P 500, as significant risk-off sentiment in the general stock market can spill over into commodity-related equities.
The key levels to watch for SCZM are not just the RSI reading but also the psychological support around the $6.90 mark and the aforementioned 52-week low. A failure to hold these levels could signal a deeper correction, while a sustained move back above the $8.00 level might indicate the start of a technical recovery.
Track markets in real-time
Empower your investment decisions with AI-powered analysis, technical indicators and real-time price data.
Join Our Telegram Channel
Get breaking market news, AI analysis and trading signals delivered instantly to your Telegram.
Join Channel