
AUDUSD Tests Support at $0.69105 Ahead of Crucial US Data
AUDUSD hovers around $0.69105 as traders await key US economic releases. Technical indicators show mixed signals, with support levels holding firm for now.
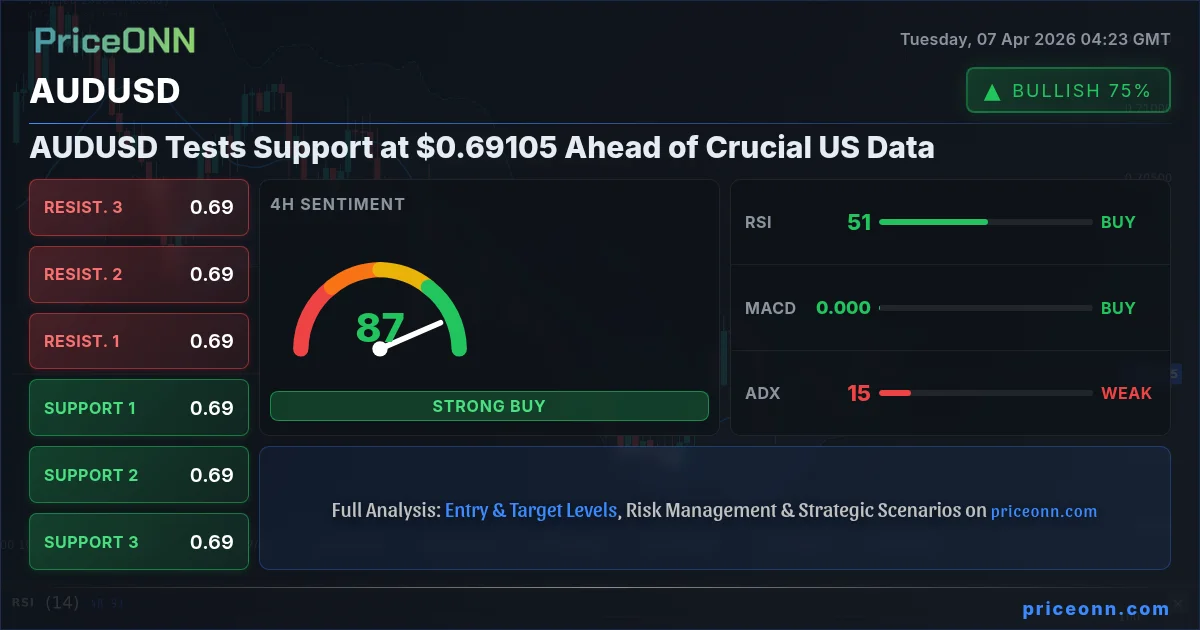
The Australian Dollar is currently trading at $0.69105, finding itself at a critical juncture as it tests key support levels ahead of a wave of significant US economic data. This Australian Dollar today analysis highlights the delicate balance in play, with traders closely watching for any shifts in momentum that could signal the next major move. The current price action suggests a market holding its breath, waiting for a catalyst to break the prevailing consolidation.
- AUDUSD is trading around $0.69105, testing support levels amid mixed technical signals.
- The 1-hour RSI is at 48.64, indicating a slight bearish inclination, while the 4-hour RSI at 51.28 suggests neutrality.
- Key support for AUDUSD lies at $0.69001, with the immediate resistance seen at $0.69111.
- Traders are anticipating upcoming US economic data releases, which could significantly influence the AUDUSD pair's direction.
The AUDUSD pair is currently navigating a technically interesting landscape. On the 1-hour chart, the trend is neutral with a power score of 50%, reflecting indecision. However, the RSI(14) at 48.64 leans towards a bearish sentiment, suggesting that while the price is holding, the underlying momentum might be waning. This is further supported by the MACD, which shows negative momentum with the MACD line below its signal line. The Bollinger Bands on this timeframe are also showing a pattern of the price trading above the middle band, indicating a slight upward bias in the short term, but the overall picture is one of caution.
Digging deeper into the 1-hour technicals, the Stochastic Oscillator presents a slightly more optimistic view, with the %K line at 34.46 and the %D line at 34.48, showing a nascent upward crossover, though still in oversold territory. This divergence between RSI and Stochastic often signals a potential shift, but confirmation is key. The ADX, a measure of trend strength, stands at 17.46, confirming what many traders are observing: a lack of a strong trend. This environment is ripe for range-bound trading or a sharp move once a catalyst emerges. The general signal on this timeframe leans towards 'SELL' (2 Buy, 6 Sell, 0 Neutral), emphasizing the caution required.
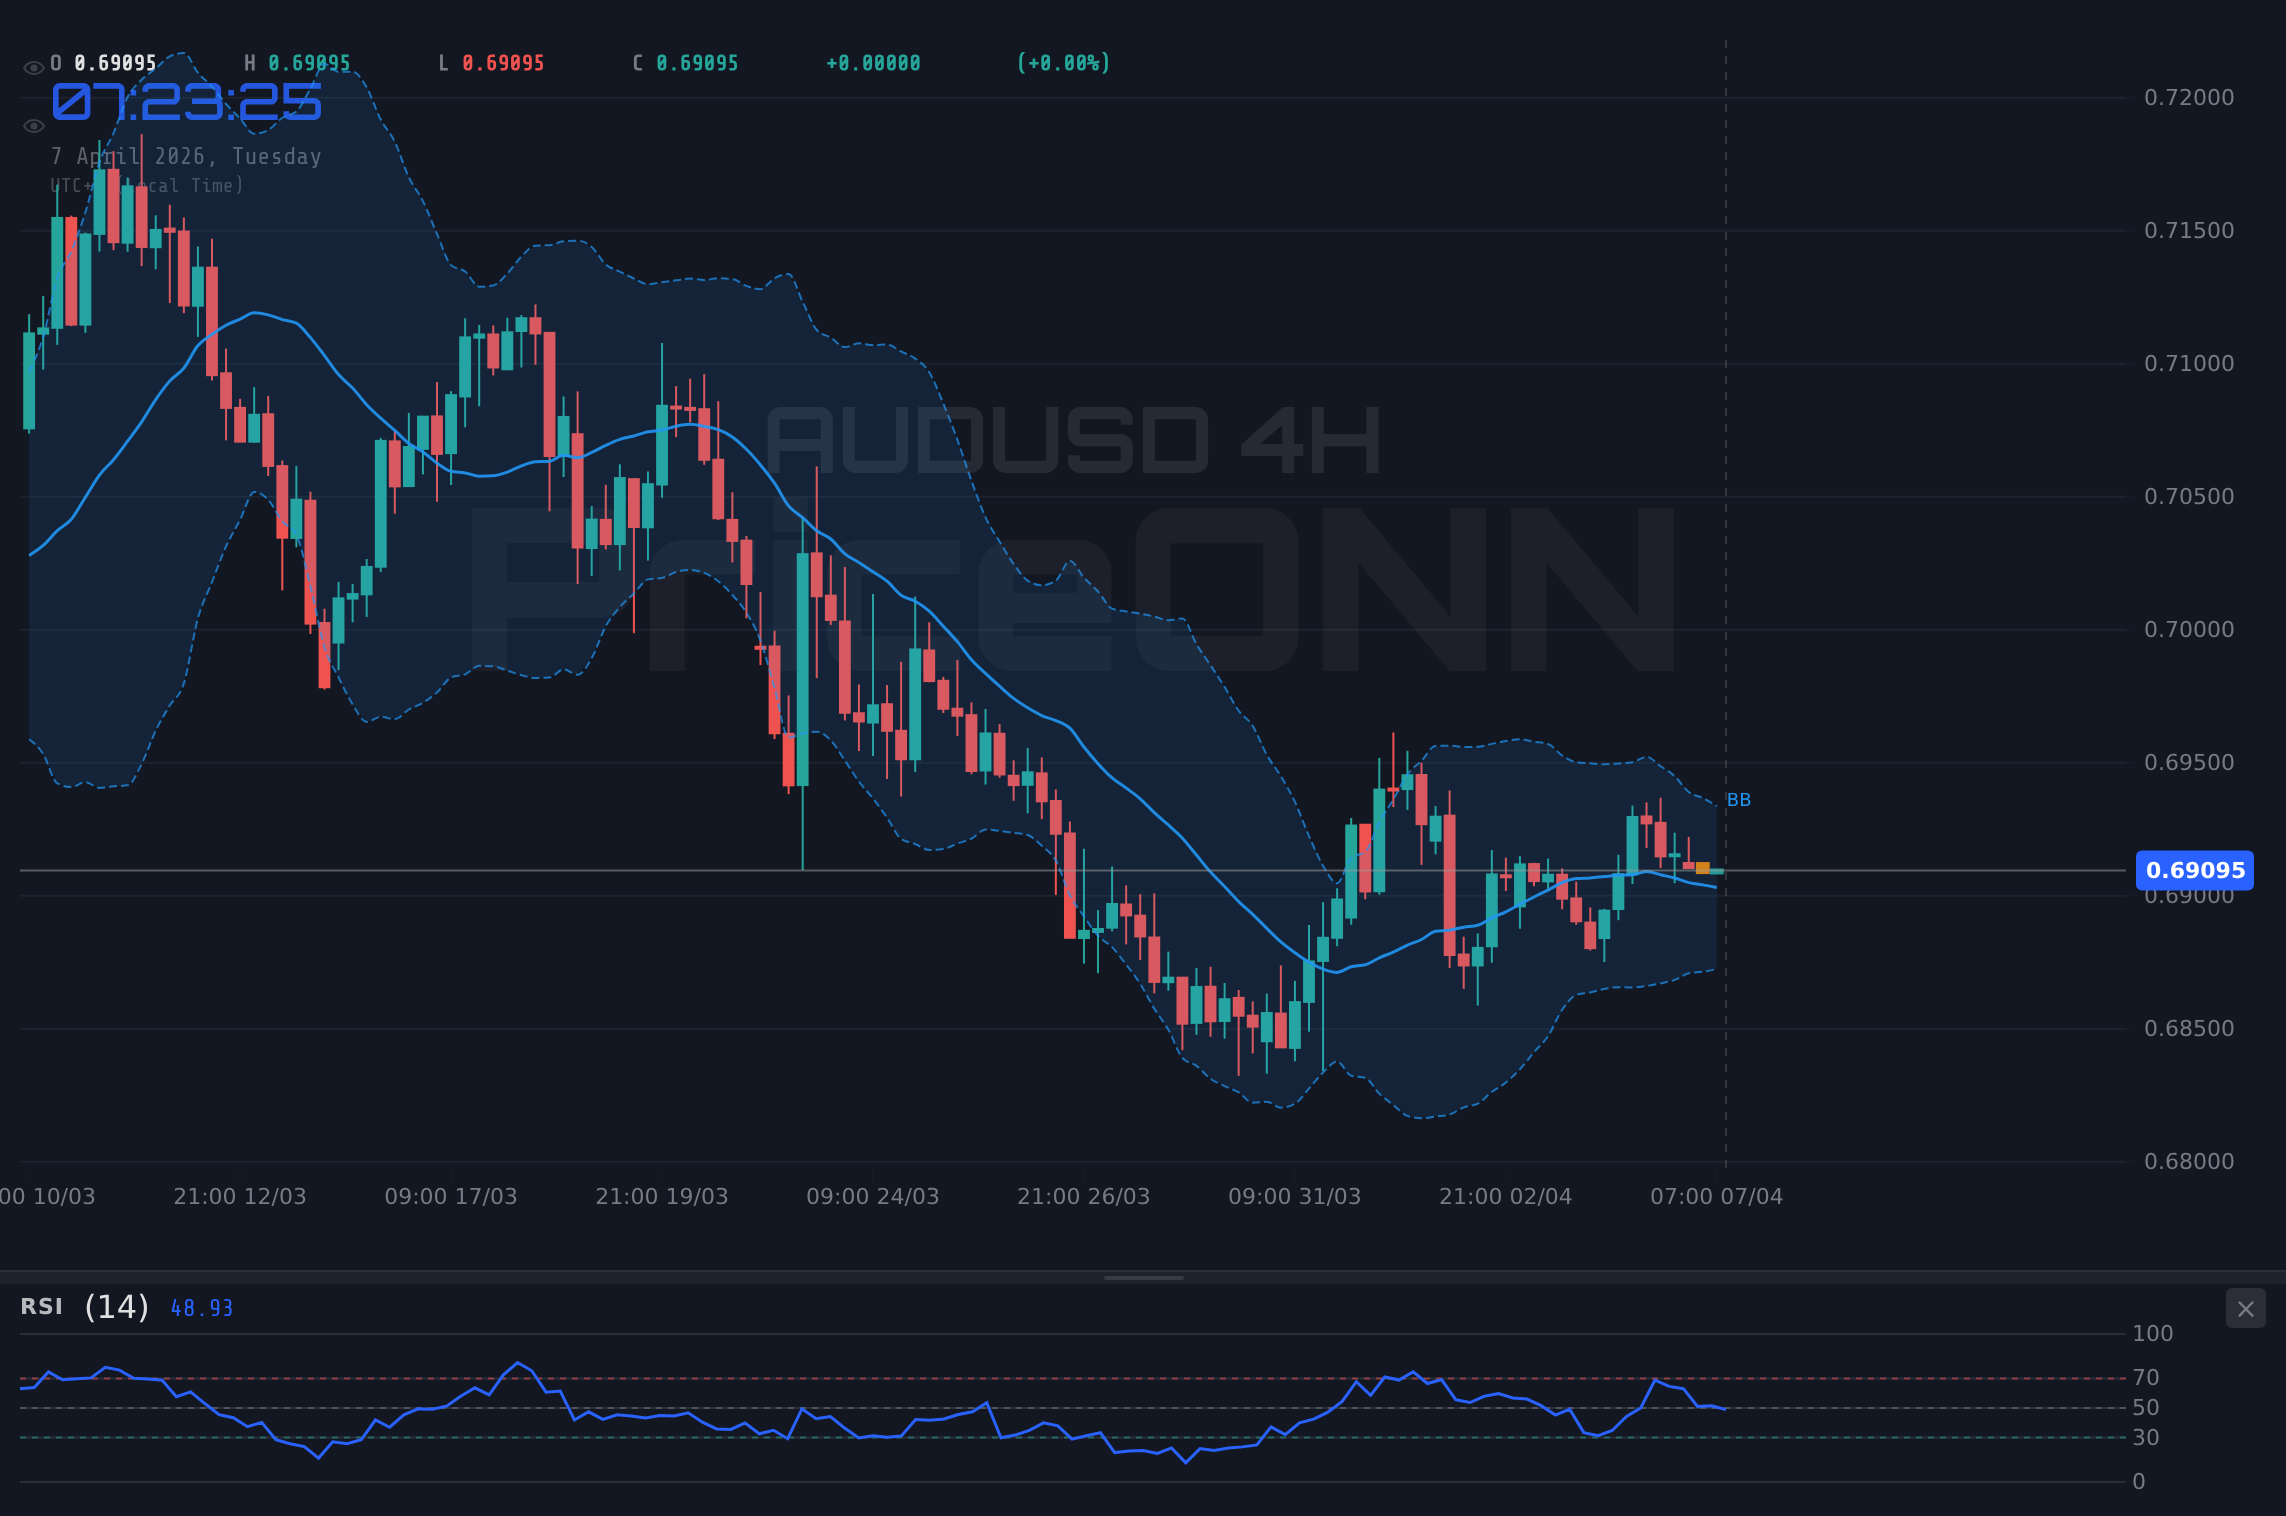
Navigating the 4-Hour Charts: A Different Perspective
Shifting to the 4-hour timeframe, the AUDUSD picture gains a slightly different hue. The trend remains neutral with a 50% power score, but the RSI(14) ticks up to 51.28, moving into the neutral zone and showing a slight upward inclination. This suggests that the bearish pressure seen on the hourly chart might be easing. The MACD here is showing positive momentum, with the MACD line above its signal line, offering a counterpoint to the hourly analysis. Bollinger Bands also show the price above the middle band, reinforcing a short-term bullish bias on this timeframe.
The Stochastic Oscillator on the 4-hour chart is more emphatic, with %K at 62.4 and %D at 71.95, indicating a bearish crossover and suggesting that while the price might be holding, the momentum is shifting downwards from overbought levels. This creates a conflict with the RSI and MACD readings. The ADX at 15.23 continues to point to a weak trend, reinforcing the idea of consolidation rather than a directional move. The overall signal on the 4-hour chart is 'BUY' (6 Buy, 2 Sell, 0 Neutral), highlighting the conflicting signals across different intraday timeframes and underscoring the need for a clear catalyst.
The Daily View: Long-Term Trend and Key Levels
Looking at the daily chart, the AUDUSD paints a picture of a clear downtrend, with a strong power score of 87%. The current price of $0.69105 is well within this bearish framework. The RSI(14) is at 44.12, firmly in neutral territory but with a downward tendency, indicating room for further downside before reaching oversold conditions. The MACD is showing negative momentum, with the MACD histogram below zero and the MACD line below its signal line, aligning with the daily downtrend.
Bollinger Bands on the daily chart show the price below the middle band, confirming the bearish pressure. However, the Stochastic Oscillator is showing a bullish signal, with %K at 44.84 and %D at 29.23, indicating a potential bounce is forming from oversold conditions, especially as the %K line is above the %D line. The ADX reading of 24.68 suggests a moderately strong downtrend, meaning any potential bounce might be short-lived unless significant fundamental shifts occur. The overall signal on the daily chart is 'SELL' (2 Buy, 6 Sell, 0 Neutral), emphasizing the dominant longer-term bearish sentiment.
This confluence of mixed signals across intraday and daily charts underscores the current market's indecision. While shorter timeframes show some conflicting indicators, the daily trend remains decidedly bearish. The immediate support levels to watch are $0.69001, $0.68932, and $0.68891. On the resistance side, the pair faces hurdles at $0.69111, $0.69152, and $0.69221. A break below the $0.69001 support could open the door for a move towards the lower end of the daily range, potentially testing $0.68891. Conversely, a strong push above $0.69111 resistance, fueled by positive news, could see a short-covering rally towards $0.69221.
The Dollar's Shadow: DXY Correlation and Market Sentiment
Crucially, the AUDUSD's movements cannot be analyzed in isolation. The Dollar Index (DXY) is currently at 99.86 and showing a strong upward trend on the daily chart (95% power score). This strengthening dollar acts as a headwind for riskier assets and currencies like the Australian Dollar. As the DXY pushes higher, it typically exerts downward pressure on pairs like AUDUSD. The current DXY strength, with its RSI at 58.42 and ADX at 29.17, indicates a robust trend that is likely to continue influencing AUDUSD. A rising DXY often correlates with falling AUDUSD, and vice versa. Traders are watching the DXY's ability to hold above 99.39 support closely.
Furthermore, broader market sentiment, often reflected in the S&P 500 (SP500) and Nasdaq (Nasdaq100), plays a significant role. The SP500 is showing a strong upward trend on the 1-hour chart (100% power), currently at 6572.87, but the daily chart shows a potential downtrend. The Nasdaq, conversely, is showing a bearish signal on the 1-hour chart at 24033.73, while the daily chart also points to a downtrend. This mixed picture in equities suggests a cautious risk appetite, which generally favors safe-haven assets over commodity-linked currencies like the AUD. Any signs of a significant risk-off move in global equities could further weigh on AUDUSD.
The Road Ahead: Upcoming Economic Data and Potential Catalysts
The immediate future for AUDUSD will likely be dictated by upcoming economic data, particularly from the United States. While the provided economic calendar shows no high-impact events scheduled for today, the market is undoubtedly positioning itself for releases later in the week. Key US figures such as inflation data (CPI), employment reports (NFP), and manufacturing/services PMIs will be critical. Stronger-than-expected US data would likely bolster the dollar further, potentially pushing AUDUSD lower towards its daily support levels. Conversely, weaker data could provide some relief to the Aussie, allowing for a potential bounce.
The Australian economic calendar, while not featuring high-impact events in the immediate window provided, will also be under scrutiny. Any subtle shifts in RBA commentary or domestic data that hint at a change in monetary policy stance could significantly impact the AUD. For now, however, the focus remains squarely on US economic indicators and the broader risk sentiment, which appear to be the primary drivers shaping AUDUSD price action. The absence of immediate high-impact data creates a vacuum that technicals and correlation plays will fill, but a significant data surprise could quickly shift the narrative.
Decoding the Indicators: A Deeper Dive
Let's break down what the specific indicator readings mean in practical terms. The 1-hour RSI at 48.64 suggests that while the pair isn't oversold, it's not showing strong bullish momentum either; it's in that 'no man's land' where price action is key. The Stochastic crossover on the 1-hour chart is a minor signal, easily drowned out by larger trends. On the 4-hour, the RSI of 51.28 is more balanced, indicating neither strong buying nor selling pressure. The Stochastic crossover here, moving from overbought territory, is more significant and aligns with the daily's bearish bias.
The ADX readings across all timeframes (17.46 on 1H, 15.23 on 4H, 24.68 on 1D) consistently point to weak to moderate trending conditions. This means that breakouts might lack follow-through, and ranges could be prone to sharp, albeit potentially short-lived, moves. The MACD on the daily chart, showing negative momentum, is perhaps the most telling indicator for the longer term. It suggests that the underlying trend is bearish, and any upside moves might be opportunities for sellers to re-enter the market at better prices, particularly if key resistance levels like $0.69111 and $0.69152 hold firm.
AUDUSD Trading Scenarios: What's Next?
Bearish Scenario: Testing Lower Grounds
65% ProbabilityNeutral Scenario: Consolidation Above Support
25% ProbabilityBullish Scenario: Short Covering Rally
10% ProbabilityThe current technical setup for AUDUSD suggests a bearish bias is the most probable path forward, given the daily downtrend and the strengthening DXY. The key support at $0.69001 is critical; a break below this level would likely trigger a cascade of selling, pushing the pair towards $0.68932 and potentially $0.68891. This scenario is further supported by the negative momentum indicated by the MACD on the daily chart and the RSI's lack of strong upward movement. Traders should be wary of any rallies as potential opportunities for sellers to re-enter, especially if they stall near the immediate resistance at $0.69111.
However, the market is never that simple. A neutral scenario where AUDUSD consolidates above $0.69001 is also plausible, especially if upcoming US data is mixed or slightly weaker than expected, failing to provide a strong directional impetus for the dollar. In such a case, the pair might remain range-bound between $0.69001 and $0.69221. A bullish scenario, while less likely at this juncture with only a 10% probability, could emerge if there's a significant shift in risk sentiment or surprisingly weak US data, leading to a short-covering rally. Confirmation for such a move would require a decisive break and hold above the $0.69221 resistance.
The interplay between the daily downtrend and the intraday 'noise' presents a classic range-trading opportunity for short-term players, but a clear directional bias is favored for swing and position traders. Given the persistent strength of the DXY and the prevailing risk-off sentiment in major equity indices like the Nasdaq, the path of least resistance for AUDUSD appears to be downwards. The key is to wait for confirmation of a break below the $0.69001 support before committing to a bearish position, managing risk tightly around this crucial level.
Frequently Asked Questions: AUDUSD Analysis
What happens if AUDUSD breaks below the $0.69001 support level?
If AUDUSD closes decisively below the $0.69001 support, it would likely trigger further selling pressure. This could lead to a move towards the next support at $0.68932, with the daily support at $0.68891 becoming the subsequent target. This bearish scenario is supported by the daily downtrend and negative MACD momentum.
Should I consider buying AUDUSD at current levels near $0.69105, given the mixed signals?
Buying at current levels around $0.69105 is risky given the dominant daily downtrend and strong DXY. A more prudent approach would be to wait for a clear break above resistance levels like $0.69111 or $0.69221, or for a confirmed bounce from a more significant support level. The probability of a sustained bullish move from current prices is low.
Is the RSI at 44.12 on the daily chart a sell signal for AUDUSD?
An RSI of 44.12 on the daily chart is not an outright sell signal but indicates a bearish inclination within a downtrend. It suggests that there is room for further downside before the pair becomes oversold. Combined with the negative MACD momentum and the overall bearish trend, it supports the view that further weakness is more probable than a significant rally from here.
How will upcoming US economic data impact AUDUSD this week?
Stronger-than-expected US economic data, such as positive employment or inflation figures, would likely strengthen the US Dollar (DXY), putting further downward pressure on AUDUSD. Conversely, weaker data could lead to dollar weakness and a potential short-covering rally in AUDUSD, though the daily downtrend suggests any gains might be capped.
| Indicator | Value | Signal | Interpretation |
|---|---|---|---|
| RSI (14) | 44.12 | Bearish | Daily: Downward trend, room to fall. 1H: 48.64 Neutral. 4H: 51.28 Neutral. |
| MACD | Negative | Bearish | Daily: Negative momentum. 1H: Negative momentum. 4H: Positive momentum (conflicting). |
| Stochastic | K=44.84, D=29.23 | Bullish Signal | Daily: Potential bounce from oversold. 1H: Crossover. 4H: Bearish crossover. |
| ADX | 24.68 | Moderate Trend | Daily: Moderate downtrend. 1H: Weak trend. 4H: Weak trend. |
| Bollinger Bands | Below Middle Band | Bearish Pressure | Daily: Below middle band. 1H & 4H: Above middle band (short-term bias). |
Patience remains the paramount virtue for traders observing AUDUSD at these levels. While the daily chart presents a clear bearish outlook, intraday charts offer conflicting signals that could lead to choppy price action. The strengthening US Dollar Index (DXY) at 99.86 is a significant factor, suggesting that any rallies in AUDUSD might be temporary unless US economic data surprises to the downside. Traders should focus on the key support at $0.69001 and resistance at $0.69111 for short-term direction, while keeping the longer-term bearish trend and the $0.68891 support level in view.
Track markets in real-time
AI-powered analysis, technical indicators and real-time price data.
Join Our Telegram Channel
Breaking market news, AI analysis and trading signals instantly.
Join Channel