
USDJPY Hovers Near $159.83 Resistance; Key Data Looms
USDJPY trades at $159.83, testing resistance as critical US economic data and geopolitical tensions build. What's next for the pair?
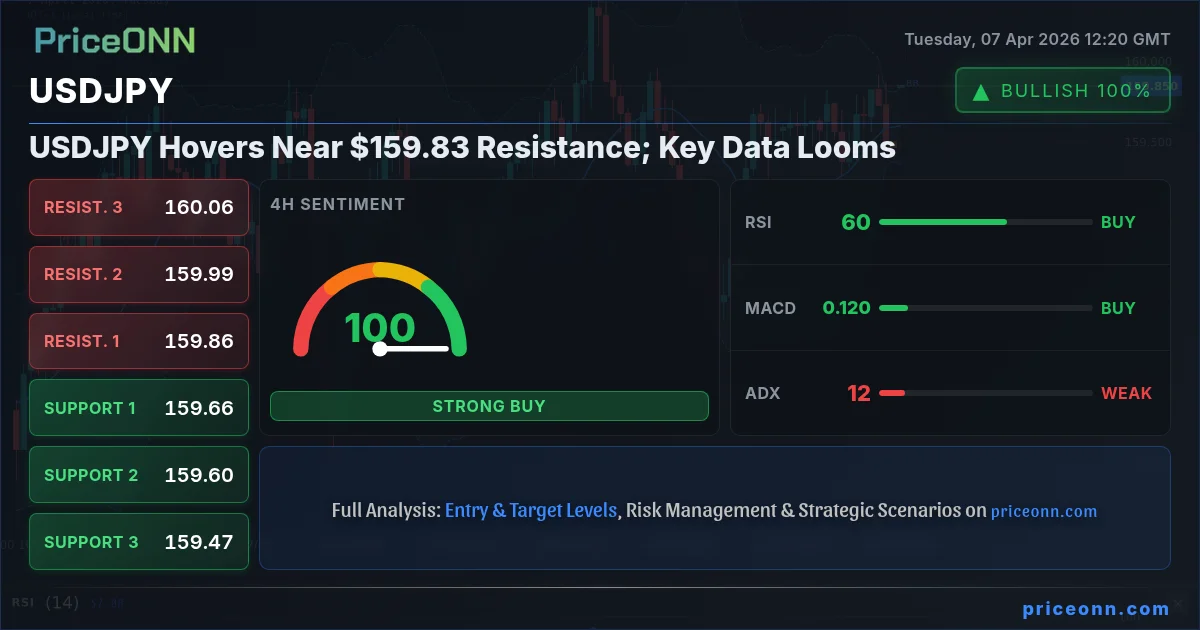
The USDJPY currency pair is currently navigating a critical juncture, hovering precariously near the $159.83 resistance level. This strategic position comes as the market braces for a deluge of high-impact US economic data and heightened geopolitical uncertainty, particularly concerning the Strait of Hormuz. Traders are keenly observing whether the yen's persistent weakness, driven by the Bank of Japan's accommodative stance, can overcome the immediate technical resistance and the broader implications of global risk sentiment. The interplay between the hawkish leanings of the Federal Reserve and the Bank of Japan's dovish policy continues to shape the narrative, creating a complex environment for this major forex pair.
- USDJPY is testing the $159.83 resistance level, a significant technical barrier.
- The 1-Day ADX at 31.78 indicates a strong downtrend for USDJPY, contrasting with shorter timeframes.
- With RSI at 55.59 on the 1-hour chart, momentum suggests a potential upward bias, but MACD lags.
- Geopolitical tensions and upcoming US economic data releases (CPI, FOMC Minutes) are key catalysts to watch.
- The DXY is currently at 99.71, showing a strong daily uptrend, which typically supports USDJPY.
The immediate technical picture for USDJPY presents a fascinating dichotomy across different timeframes. On the 1-hour chart, the pair shows a 'BUY' signal with a strong trend (86% strength) and RSI at 55.59, indicating a rising momentum. However, the Stochastic oscillator is flashing a 'SELL' signal (%K
Diving deeper into the 4-hour timeframe, the sentiment shifts towards neutrality, with a 50% trend strength. Here, the RSI at 59.59 still leans towards a bullish bias, and the MACD shows positive momentum with the line above the signal. Bollinger Bands are also above the middle band, reinforcing a potential upward trend. Yet, the Stochastic oscillator (%K > %D) is showing a 'BUY' signal, but the ADX at 12.39 continues to point towards a weak trend. This suggests that the 4-hour chart is also in a state of flux, awaiting a clearer directional catalyst. The general signal is 'BUY' (8 Al, 0 Sat), but the weak ADX reading tempers enthusiasm, indicating that this is more of a consolidation phase than a strong directional move.
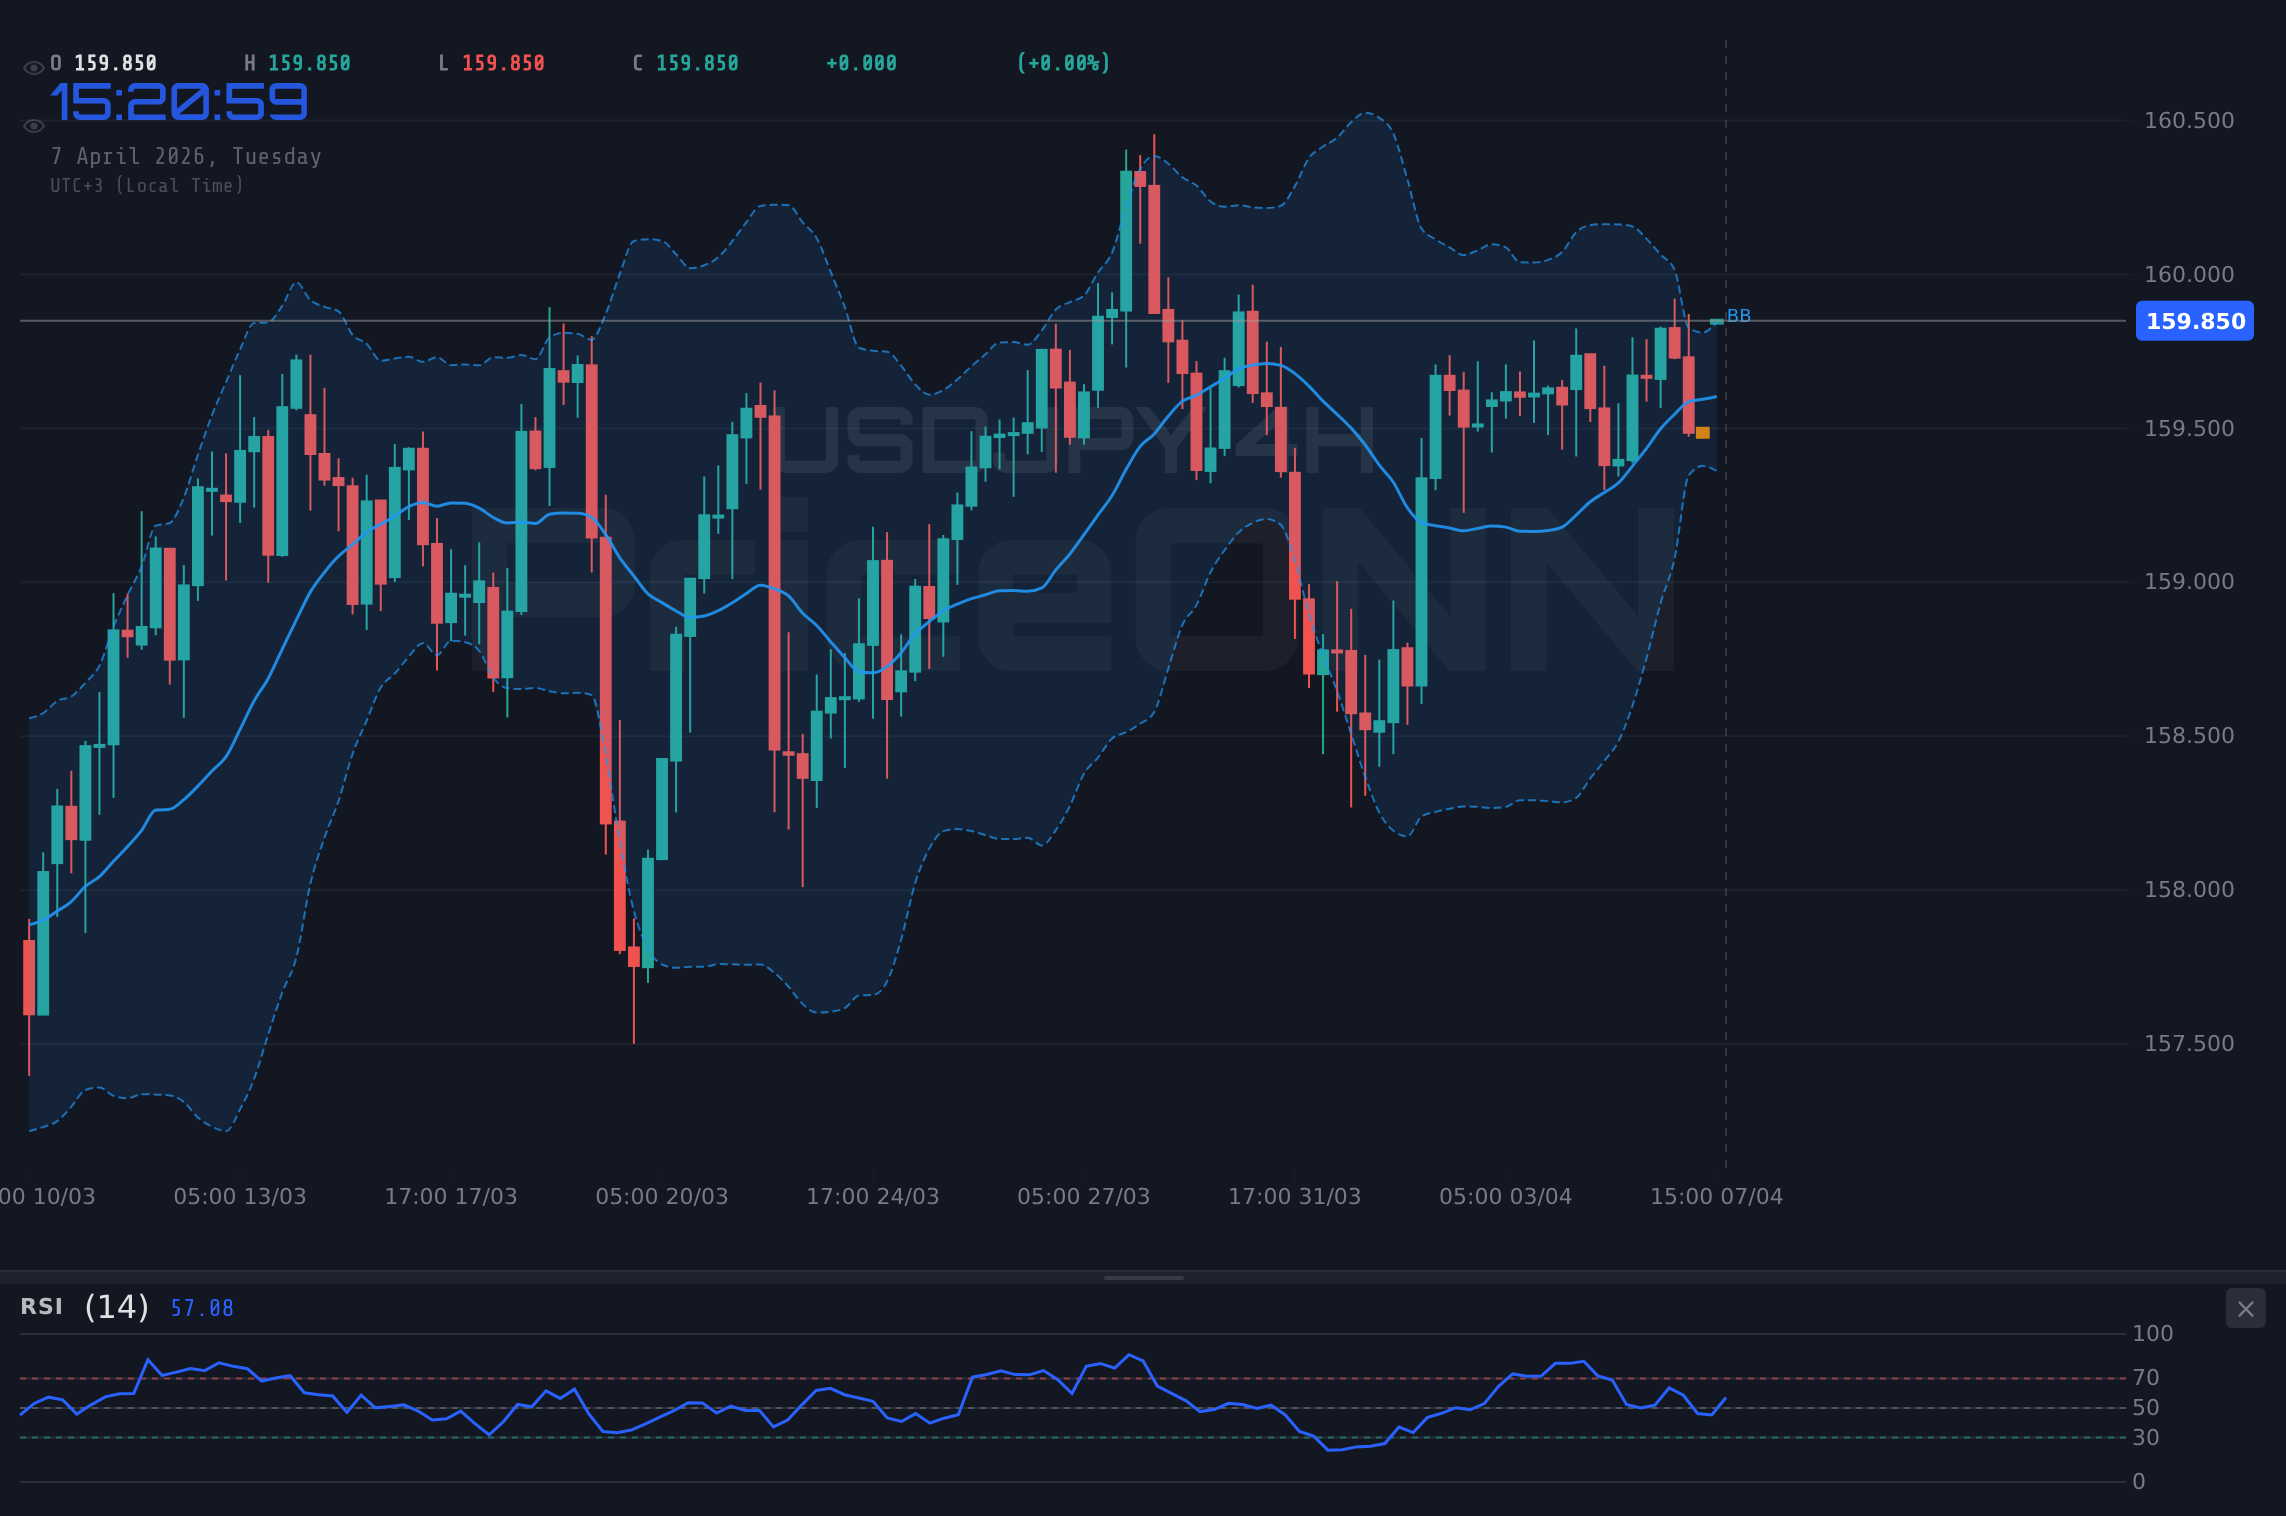
The daily chart, however, paints a more bearish picture for USDJPY, despite the shorter-term 'BUY' signals. The trend is classified as 'Uptrend' with a high strength of 96%, but the ADX at 21.1 indicates a moderately strong trend, which can be susceptible to reversals. The RSI at 45.36 sits in neutral territory but shows a downward eğilim, suggesting that buying pressure might be waning. Crucially, the MACD is showing negative momentum with the MACD line below its signal line, and Bollinger Bands are trading below the middle band, indicating a downward pressure. The Stochastic oscillator, with %K > %D, provides a 'BUY' signal, but this often signals a potential oversold condition or a dead-cat bounce in a downtrend. The overall 'BUY' signal (6 Al, 1 Sat, 0 Nötr) on the daily chart appears to be driven by shorter-term fluctuations, not a sustained fundamental shift.
Navigating the Resistance at $159.83: What the Indicators Say
The $159.83 level is not just a number; it represents a significant psychological and technical barrier for USDJPY. Historically, price action around such levels often dictates the next major move. Currently, on the 1-hour chart, the resistance is clearly defined at $159.841, with further levels at $159.903 and $160.018. A decisive break and hold above $159.841 could trigger a cascade of buying, potentially targeting the higher resistance zones. However, the confluence of mixed signals across timeframes suggests that this breakout might be challenging. The weak ADX readings across all timeframes are a significant red flag, indicating that the market lacks directional conviction. This means that even if price pushes higher, the move could be prone to sharp reversals if underlying momentum doesn't build.
The divergence in indicator signals is particularly noteworthy. While shorter timeframes like the 1-hour and 4-hour charts show 'BUY' signals, often driven by technical patterns or short-term momentum, the daily chart's RSI and MACD suggest underlying weakness. The 1-day ADX at 31.78 is particularly concerning, signaling a strong downtrend – a stark contrast to the bullish leanings on the hourly charts. This suggests that the current upward movement might be a retracement within a larger downtrend, or a consolidation phase before a potential continuation of the downtrend. Traders must be wary of chasing price higher, especially with the Stochastic on the 1-hour chart indicating a potential pullback. The general signal for USDJPY is 'Neutral' (4 Al, 4 Sat, 0 Nötr) on the daily timeframe, underscoring the indecision.
Correlation Analysis: DXY and Equities in Focus
The US Dollar Index (DXY) is currently trading at 99.71, showing a strong daily uptrend (95% strength) and a robust ADX of 29.17. This strengthening dollar environment typically acts as a headwind for USDJPY. However, in this specific instance, the dollar's strength is being driven by factors that also support USDJPY, such as relative interest rate differentials and safe-haven flows amidst geopolitical uncertainty. The correlation here is complex; while a stronger dollar usually means USDJPY goes up, the fact that the Bank of Japan maintains an ultra-loose monetary policy while the Federal Reserve signals a hawkish stance is the primary driver. The market is pricing in a divergence in monetary policy, which is overriding the typical inverse correlation with DXY at times.
Equity markets also provide crucial context. The SP500 is showing a strong daily uptrend (100% strength) at 6572.87, indicating a risk-on sentiment. Conversely, the Nasdaq100 is showing a strong daily downtrend (100% strength) at 24040.73. This divergence in tech vs. broad market performance can create cross-asset volatility. Generally, a risk-on environment in the SP500 might support USDJPY due to increased risk appetite. However, the weakness in Nasdaq100, a key indicator for growth stocks, could signal underlying concerns about the economic outlook, potentially dampening risk appetite and indirectly capping USDJPY's upside. The conflict between the broad market strength and tech weakness means that equities are not offering a clear directional signal for USDJPY at present.
Geopolitical Tensions and Their Shadow on USDJPY
The escalating geopolitical tensions, particularly concerning Iran and the Strait of Hormuz, are a significant factor injecting volatility into the markets. Crude oil prices, with Brent at $113.26 and WTI at $114.93, are reflecting these heightened risks, trading in strong uptrends. Rising oil prices can have a dual effect: they can fuel inflation expectations, potentially leading to a more hawkish central bank response (supportive of the dollar), but they also increase global economic uncertainty, which can trigger safe-haven demand. For USDJPY, this means that while a stronger dollar might be a tailwind, a significant escalation of geopolitical conflict could also lead to a flight to quality, potentially benefiting the Japanese Yen as a safe-haven currency, thus capping USDJPY's gains or even driving it lower.
Recent news highlights this dynamic. Reports suggest that EUR/USD is trading near 1.1540 as markets brace for a US deadline on the Strait of Hormuz, and crucial US economic data is on the horizon. This underscores the interconnectedness of global events. Similarly, news indicating that USD/JPY has surged past the 160.00 mark as crude oil prices breach $100 per barrel, driven by Middle East tensions, directly illustrates the current market driver. The Bank of Japan's silence on intervention despite the yen's weakness adds another layer of complexity. If tensions escalate significantly, the yen's safe-haven appeal could strengthen, potentially reversing the current trend and putting pressure on USDJPY, even with a strong dollar.
Fundamental Drivers: Monetary Policy Divergence Remains Key
At its core, the USDJPY's trajectory is heavily influenced by the stark divergence in monetary policy between the Federal Reserve and the Bank of Japan (BoJ). While the Fed has been on a path of monetary tightening to combat inflation, the BoJ has maintained its ultra-loose policy, keeping interest rates exceptionally low. Market participants are keenly awaiting the Federal Reserve's next moves, with recent data hinting at persistent inflation. If the Fed signals a more hawkish stance, perhaps through forward guidance or comments from officials, it would typically support the dollar and, by extension, USDJPY. Conversely, any indication from the BoJ that it might consider normalizing policy, however distant, could strengthen the yen and pressure USDJPY.
The latest economic data releases are crucial in shaping these expectations. The provided economic calendar is sparse on specific dates and actuals for today, April 7th, 2026, but it lists several high-impact USD events. Upcoming data points such as CPI, FOMC Minutes, and others will be critical. For instance, if inflation figures (CPI) come in higher than forecast, it would reinforce the case for a hawkish Fed, potentially pushing USDJPY higher. Conversely, softer data might lead to a reassessment of Fed rate hike expectations, weakening the dollar. The market's reaction to these releases will be a key determinant of USDJPY's short-term direction. The current price action near $159.83 suggests that the market is hesitant to make a significant move before these catalysts unfold.
The BoJ's Dilemma and Yen Weakness
The Bank of Japan finds itself in a challenging position. A persistently weak yen, while potentially beneficial for export-oriented companies, exacerbates import costs, particularly for a nation heavily reliant on energy and raw material imports. The rising oil prices, driven by geopolitical events, amplify this concern. Despite the yen's weakness, the BoJ has shown little inclination to alter its ultra-accommodative monetary policy, citing the need for sustained domestic inflation and wage growth. This policy divergence is a primary driver of the USDJPY's ascent. However, the risk remains that if yen weakness leads to significant imported inflation or capital flight, the BoJ might be forced to reconsider its stance, even if gradually.
The market is actively testing the BoJ's resolve. The fact that USDJPY has surged past the 160.00 mark, as mentioned in recent news, highlights this pressure. For now, the BoJ's continued commitment to its easing policy provides a floor for the yen's weakness against a dollar supported by higher US yields and Fed policy expectations. However, the extreme levels reached could invite verbal intervention or, in a more extreme scenario, policy shifts. Investors are watching closely for any signs that the BoJ might be becoming uncomfortable with the pace of yen depreciation, which could trigger a sharp reversal.
Trading Scenarios for USDJPY Near $159.83
Given the current technical and fundamental backdrop, several scenarios can unfold for USDJPY. The immediate focus remains on the $159.83 resistance level and the upcoming economic data. The market sentiment is currently mixed, with short-term indicators suggesting potential upside, while longer-term daily indicators and geopolitical risks point towards caution or even downside.
Bearish Scenario: Yen Strength Prevails
65% ProbabilityNeutral Scenario: Consolidation Around Resistance
25% ProbabilityBullish Scenario: Breakout Above Resistance
10% ProbabilityThe current technical setup, with its mixed signals and weak ADX readings, leans towards a bearish or neutral outcome in the short to medium term. The failure to establish strong momentum above $159.83, especially with daily indicators flashing caution and geopolitical risks on the horizon, makes the bearish scenario more probable. A break below $159.487 could open the door for a sharper decline, especially if upcoming US data disappoints or geopolitical tensions ease, reducing safe-haven demand for the dollar. Conversely, a strong breakout above $159.841, fueled by hawkish Fed rhetoric or data, would be needed to invalidate this bearish outlook and target higher levels.
The Path Forward: Data Dependency and Risk Management
As we look ahead, USDJPY's trajectory will be heavily influenced by upcoming economic data and central bank communications. The Federal Reserve's stance on inflation and interest rates remains paramount. Any sign of persistent price pressures could bolster the dollar, while signs of cooling inflation might temper rate hike expectations. The Bank of Japan's policy, though seemingly unwavering, will also be a critical factor. Any shift in their dovish stance, however subtle, could lead to significant yen appreciation.
Frequently Asked Questions: USDJPY Analysis
What happens if USDJPY fails to break above $159.841 resistance amid escalating geopolitical tensions?
If USDJPY fails to break and hold above the $159.841 resistance, especially with rising geopolitical risks, the bearish scenario becomes more likely. Price could retreat towards the $159.487 support level on the 1-hour chart, and potentially test the daily support at $159.073 if sentiment shifts decisively.
Is the RSI at 55.59 on the 1-hour chart a buy signal for USDJPY right now?
While an RSI of 55.59 on the 1-hour chart suggests some upward momentum, it's not a definitive buy signal on its own. The Stochastic oscillator is bearish, and the ADX indicates a weak trend. Confirmation from price action breaking key resistance ($159.841) and sustained momentum would be needed for a stronger bullish conviction.
How will upcoming US economic data like CPI impact USDJPY this week?
Higher-than-expected CPI data would likely support a hawkish Federal Reserve, strengthening the dollar and potentially pushing USDJPY above $159.83 towards $160.018. Conversely, softer inflation figures could weaken the dollar, leading to a test of support levels around $159.487.
Should I consider buying USDJPY at current levels of $159.83 given the mixed technical signals?
Given the mixed technical signals and the proximity to resistance, buying USDJPY at $159.83 carries significant risk. The bearish scenario has a higher probability (65%). A more prudent approach might be to wait for a clear breakout above resistance with confirmation, or a pullback to a more defined support level like $159.487, while managing risk tightly.
| Indicator | Value | Signal | Interpretation |
|---|---|---|---|
| RSI (14) | 55.59 | Neutral | Rising momentum, but not overbought. |
| MACD Histogram | - | Bearish | Negative momentum on 1H, lagging. |
| Stochastic (%K, %D) | 54.74, 33.51 | Bullish | Potential for upward move, but caution. |
| ADX | 12.72 | Weak Trend | Lack of directional conviction. |
| Trend Strength (1H) | 86% | Bullish | Short-term upward bias. |
The current market environment for USDJPY is characterized by a delicate balance of factors. While the short-term technicals and the overarching monetary policy divergence between the US and Japan provide a bullish undertone, significant headwinds exist. The resistance at $159.83 is formidable, geopolitical risks are escalating, and the BoJ's policy, though currently supportive of yen weakness, remains a potential wildcard. Vigilance regarding upcoming economic data is paramount, as these releases have the power to shift market sentiment rapidly. For traders, disciplined risk management and patience will be key; waiting for clear directional signals and confirmation, rather than chasing price action around this critical resistance zone, is the most prudent strategy. The market always offers opportunities, but they often come after periods of consolidation and uncertainty.
Track markets in real-time
AI-powered analysis, technical indicators and real-time price data.
Join Our Telegram Channel
Breaking market news, AI analysis and trading signals instantly.
Join Channel