
DowJones30 Tests Key Support Near $46,327 Amid Data Storm; Current Price $46,422.50
DowJones30 analysis: The index hovers near $46,327 support. With mixed signals and upcoming data, traders eye crucial levels. What's next?
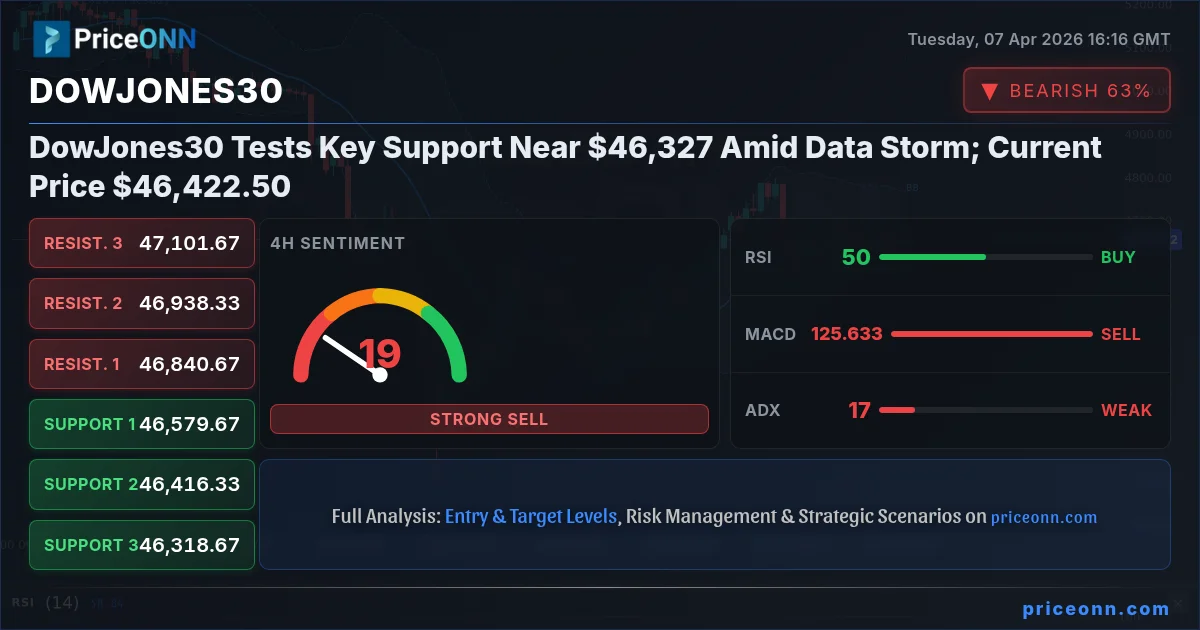
The Dow Jones Industrial Average (DJIA) is currently navigating a critical juncture, trading precariously close to the $46,327 support level as of April 7, 2026. While the index sits at $46,422.50, the recent price action suggests a battle is brewing between bulls and bears, with a barrage of economic data releases on the horizon poised to dictate the next significant move. This pivotal moment demands a closer look at the underlying technicals and the macroeconomic forces at play.
- The DowJones30 is testing critical support near $46,327, with the current price at $46,422.50.
- RSI at 44.27 on the 1H chart signals downward momentum is building, while the 1D chart shows a stronger downtrend.
- ADX at 12.82 indicates a weak trend, suggesting current price action might be range-bound before a significant breakout or breakdown.
- Upcoming economic data releases, particularly from the US, will be crucial in determining whether the index holds support or faces further declines.
Navigating Choppy Waters: The Dow Jones at a Crossroads
The Dow Jones Industrial Average (DJIA) is currently caught in a delicate balance, trading just above a significant support level around $46,327. At $46,422.50, the index reflects a market grappling with conflicting signals. On the 1-hour timeframe, the Relative Strength Index (RSI) at 44.27 clearly indicates that downward momentum is gaining traction, suggesting sellers are becoming more active. This is further corroborated by the MACD histogram showing negative momentum, painting a picture of a market potentially heading lower in the short term. The weak ADX reading of 12.82 on this timeframe, however, hints that the current trend lacks conviction, potentially leading to a period of consolidation or a whipsaw before a more decisive move develops. This 'weak trend' environment means that while the bears might be pushing, the market hasn't fully committed to a downward trajectory yet, leaving room for volatility and unexpected reversals.
Delving deeper into the daily timeframe, the technical landscape for the Dow Jones becomes more cautionary. The RSI at 45.11 reinforces the bearish sentiment observed on the shorter timeframe, suggesting that a downtrend is indeed in play. The MACD on the daily chart, while currently showing positive momentum with the histogram above the signal line, still operates within the context of a larger downtrend indicated by the RSI. The Bollinger Bands on the daily chart are also positioned below the middle band, further supporting a bearish inclination. This confluence of indicators on the daily chart suggests that while short-term fluctuations might offer trading opportunities, the overarching trend appears to be downwards. The critical support at $46,327 becomes paramount; a decisive break below this level could trigger significant selling pressure, potentially leading to a cascade towards the next support at $45,881.67.
The Impact of Data: What's Driving the Dow?
The current indecision in the Dow Jones is intrinsically linked to the upcoming economic data storm. With several high-impact US dollar-denominated events on the economic calendar – including releases for which actual figures are still pending – market participants are likely adopting a cautious stance. These upcoming releases, which could range from employment figures to inflation data and manufacturing indices, will be crucial in shaping expectations for Federal Reserve policy. Any indication of persistent inflation or a weakening labor market could fuel speculation about interest rate cuts, while stronger-than-expected data might reinforce the 'higher for longer' narrative for interest rates, potentially pressuring equities. The market's sensitivity to these macroeconomic indicators is amplified by the current geopolitical climate, where escalating tensions, particularly in the Middle East, can independently influence inflation expectations via oil prices and overall risk appetite.
The correlation between the US Dollar Index (DXY) and major indices like the Dow Jones is also a key factor to monitor. Currently, the DXY is trading around 99.64, showing a slight downtrend on the 1-hour chart but maintaining a strong upward trend on the daily. This divergence suggests that while short-term dollar weakness might be present, the underlying strength remains. A strengthening dollar typically exerts downward pressure on US equities, as it makes American goods more expensive for foreign buyers and can signal tighter financial conditions. Conversely, a weakening dollar can sometimes coincide with risk-on sentiment, boosting stock markets. Traders are closely watching how these dynamics play out, as a sustained move in either direction for the DXY could provide a clearer directional bias for the Dow Jones.
Technical Tangles: Interpreting the Signals
The technical indicators for the Dow Jones present a mixed but leaning bearish picture across different timeframes. On the 1-hour chart, the RSI at 44.27 and the negative MACD momentum suggest short-term weakness. However, the ADX at a mere 12.82 signals a very weak trend, implying that this short-term weakness may not translate into a sustained sell-off without further confirmation. This is a classic scenario where scalp traders might look for quick moves, but longer-term investors should exercise caution. The Stochastic indicator on the 1-hour chart, with %K at 20.09 and %D at 29.16, also points towards oversold conditions and a potential short-term bounce, though this often fails to reverse a larger trend. The overall signal for the 1H chart is 'SAT', reflecting the current bearish lean.
Shifting to the 4-hour timeframe, the signals become more complex. While the trend is technically classified as 'Yükseliş' (Bullish) with 93% strength, the RSI at 50.43 is neutral, and the MACD shows negative momentum. The Stochastic, with %K at 61.26 and %D at 79.58, is giving a bearish signal as %K dips below %D, indicating a potential decline from current levels. The ADX here remains weak at 16.75. This timeframe's overall 'SAT' signal underscores the conflicting nature of the data. On the daily chart, the trend is firmly classified as 'Düşüş' (Bearish) with 93% strength. The RSI at 45.11 aligns with this, and while the MACD shows positive momentum, it's within the context of a larger downtrend. The Stochastic indicator on the daily chart, with %K at 85.86 and %D at 69.96, is flashing a strong bullish signal as %K exceeds %D and moves into overbought territory. This divergence between the RSI and Stochastic on the daily chart is a key point of contention, highlighting the uncertainty.
The $46,327 Line in the Sand: Key Levels to Watch
The immediate focus for the Dow Jones remains squarely on the $46,327 support level. This is not just an arbitrary number; it represents a price point that has historically acted as a floor, and its integrity is crucial for maintaining any semblance of bullish sentiment. A failure to hold this level could see the index rapidly fall towards the next significant support at $45,881.67. This level, derived from the 4-hour data, represents a wider zone where buying interest might resurface, but a break below it would signal a significant escalation of selling pressure. Further down, $45,637.33 serves as a third layer of support on the daily chart, a level that, if reached, would indicate a substantial bearish trend in motion.
On the resistance side, the immediate hurdle is the $46,504.33 level identified on the 1-hour timeframe. A decisive move above this point, accompanied by increasing volume and stronger momentum, could signal a short-term reversal. However, the more significant resistance lies at $47,017.33 on the daily chart. Breaking above this level would be a strong bullish signal, suggesting that the recent downtrend might be reversing. This area has acted as a ceiling in recent price action, and a sustained push through it would likely attract more buyers. Further resistance is seen at $47,261.67 and then $47,707.33, levels that would need to be overcome for a more robust recovery to take hold. The current price of $46,422.50 sits uncomfortably between these critical zones, highlighting the intraday trading range and the high stakes involved.
Market Sentiment and Risk Management
The prevailing market sentiment appears to be one of cautious anticipation, heavily influenced by the geopolitical backdrop and the impending economic data. The escalating tensions in the Middle East, as reported by various news outlets, continue to cast a shadow, potentially driving safe-haven demand and impacting inflation expectations via oil prices. WTI crude is currently trading at $115.18, showing a strong upward trend on the daily chart, which can fuel inflation concerns and influence central bank policy decisions. This backdrop makes the upcoming US economic data releases even more critical. Traders are essentially waiting for a clearer signal from the data to determine whether the current support levels for the Dow Jones will hold or if a further decline is imminent. In such an environment, robust risk management becomes paramount. Scalpers might look for short-term opportunities within the $46,327 to $46,504 range, but swing and position traders would likely wait for a clearer breakout or breakdown signal.
The current trading signals across the board for the Dow Jones are mixed, with the 1-hour and 4-hour charts leaning towards 'SAT' (Sell) and the daily chart offering a 'NÖTR' (Neutral) signal, albeit with a strong bearish trend classification. This lack of clear consensus across timeframes reinforces the idea that the market is in a state of flux. The divergence in Stochastic signals on the daily chart (bullish) versus the RSI (bearish) is a classic example of conflicting information that often precedes a significant price move. The key takeaway is that while short-term indicators might fluctuate, the longer-term trend and the reaction to key support and resistance levels will provide the most reliable guidance. Patience and disciplined execution are crucial; chasing the market in this uncertain environment is a recipe for potential losses.
Forward Outlook: What Lies Ahead for the Dow?
Looking ahead, the Dow Jones Industrial Average faces a period of heightened sensitivity to economic news and geopolitical developments. The support at $46,327 is the immediate line in the sand. A hold here, potentially coupled with positive surprises in upcoming US economic data, could pave the way for a retest of resistance levels around $46,504 and potentially higher. However, a break below $46,327 would likely trigger stop-loss orders and accelerate the descent towards $45,881.67 and beyond. The strength of the US dollar, currently showing resilience despite short-term dips, will also play a crucial role. If the DXY continues its upward trajectory on the daily chart, it could add further headwinds for the index. Investors and traders will be meticulously dissecting every economic release, searching for clues about the Federal Reserve's next move and the broader health of the US economy.
The current environment underscores the importance of adaptability. Market conditions can shift rapidly based on new information. Therefore, maintaining a flexible approach, respecting key price levels, and managing risk diligently are not just strategies but necessities for navigating the current landscape. The ongoing tug-of-war around the $46,327 support level will likely define the near-term trajectory, with upcoming data serving as the ultimate arbiter of direction. The market is presenting a complex puzzle, and only time, coupled with sound analysis, will reveal the full picture.
Bearish Scenario: Support Breakdown
65% ProbabilityBullish Scenario: Support Holds Firm
25% ProbabilityNeutral Scenario: Consolidation Phase
10% ProbabilityFrequently Asked Questions: DowJones30 Analysis
What happens if the DowJones30 breaks below $46,327 support?
A break below $46,327 would signal a bearish continuation, potentially triggering stop-losses and accelerating declines towards the $45,881.67 support level. This would invalidate short-term bullish hopes and confirm the downtrend observed on the daily chart.
Should I consider buying the DowJones30 at current levels around $46,422.50 given the RSI at 44.27?
Buying at $46,422.50 with an RSI of 44.27 on the 1H chart carries risk, as it suggests downward momentum. A more prudent approach would be to wait for confirmation of support holding at $46,327 or a clear bullish reversal signal, perhaps with an RSI move back above 50 and a break of immediate resistance.
Is the MACD negative momentum on the 1H chart a strong sell signal for the DowJones30 at $46,422.50?
The negative MACD momentum on the 1H chart at $46,422.50 indicates selling pressure, but the weak ADX (12.82) suggests the trend lacks conviction. It's a warning sign rather than a definitive sell signal on its own; confirmation from price action breaking support is needed.
How will upcoming US economic data affect the DowJones30's movement around $46,327?
Stronger-than-expected US data could pressure the DowJones30 around $46,327 by reinforcing 'higher for longer' Fed rate expectations, while weaker data might offer temporary relief by fueling rate cut hopes. The market's reaction will hinge on whether the data supports or contradicts current economic narratives.
| Indicator | Value | Signal | Interpretation |
|---|---|---|---|
| RSI (14) | 44.27 | Bearish | Downward momentum building on 1H; downtrend on 1D. |
| MACD Histogram | - | Bearish | Negative momentum on 1H; potential for further decline. |
| Stochastic (%K/%D) | 20.09 / 29.16 | Bearish | Oversold conditions on 1H, suggesting potential bounce; bearish on 4H. |
| ADX | 12.82 | Weak Trend | Lack of strong trend conviction on 1H, suggesting consolidation. |
| Bollinger Bands | Middle Band | Watch | Below middle band on 1H & 1D, indicating bearish pressure. |
Track markets in real-time
AI-powered analysis, technical indicators and real-time price data.
Join Our Telegram Channel
Breaking market news, AI analysis and trading signals instantly.
Join Channel