
Nasdaq100 Hovers Near $24,003 Amid Bearish Pressure; Key Data Looms
Nasdaq100 trades near $24,003, with bears testing support. Investors await crucial economic data and Fed signals for direction. Technicals show mixed signals as trend strength fluctuates.
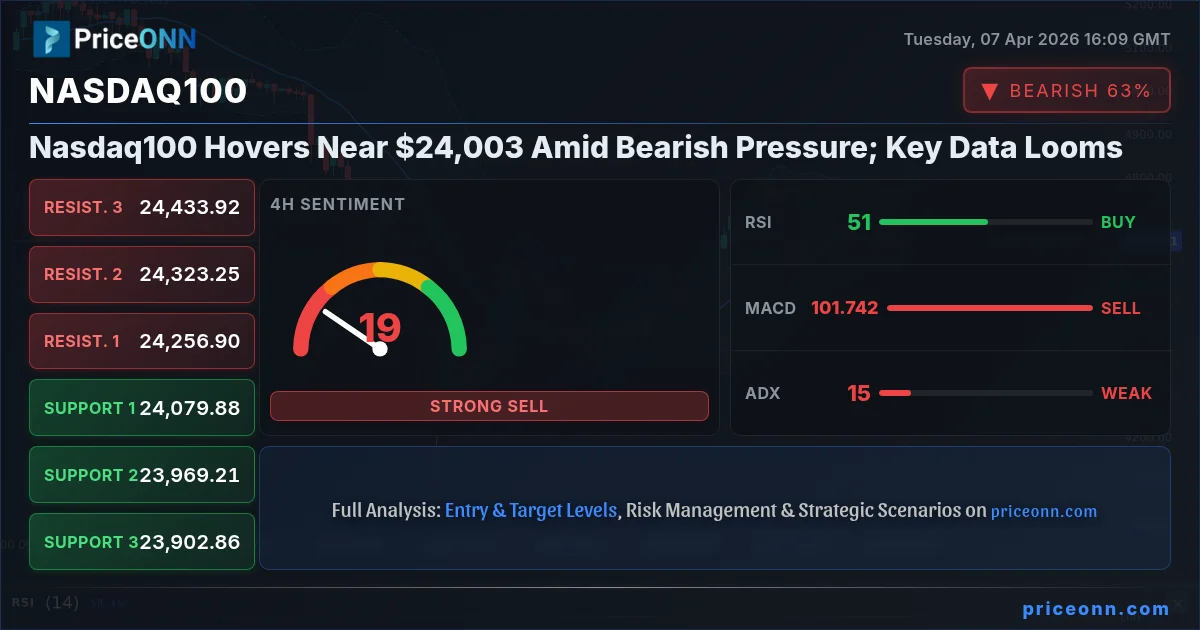
The Nasdaq 100 is currently navigating a critical juncture, trading just above the $24,003 mark. Bears have been attempting to assert control, pushing the index towards key support levels, while the specter of looming economic data and shifting central bank expectations hangs heavy in the air. This delicate balance creates a scenario ripe for volatility, demanding close attention from traders and investors alike.
The current technical picture for the Nasdaq 100, a benchmark for the tech-heavy NASDAQ Composite Index, presents a complex mosaic of signals. On the 1-hour timeframe, the trend appears neutral with a moderate strength of 50%. However, the broader 4-hour chart suggests a more bullish inclination with 93% strength, even as the daily chart shows a bearish trend with 100% conviction. This multi-timeframe divergence is precisely what creates the current indecision. The RSI on the 1-hour chart sits at 46.32, indicating a bearish inclination within the neutral trend, while the MACD shows negative momentum, with the MACD line below its signal line. This paints a picture of sellers having a slight edge in the short term. The ADX at 17.73 further reinforces the idea of a weak trend, suggesting that any moves might lack sustained follow-through until a clearer catalyst emerges. The general signal on this timeframe leans towards selling, reflecting the short-term bearish pressure.
- The Nasdaq 100 is trading near $24,003, with the 1-hour trend showing neutral strength at 50% and a bearish RSI of 46.32.
- Critical support is identified at $23,787.66, while resistance hovers around $24,079.88 on the 4-hour chart.
- The MACD histogram shows negative momentum on the 1-hour chart, indicating potential selling pressure.
- Anticipation of upcoming US economic data releases, such as employment figures and inflation reports, is a key factor influencing market sentiment and correlation with the DXY index.
Zooming out to the 4-hour timeframe, the narrative shifts slightly. Here, the trend is identified as bullish with a significant strength of 93%. This suggests that the longer-term sentiment, as viewed over several trading sessions, remains more optimistic. The RSI is at 51.69, hovering in neutral territory but leaning towards a slight upward bias, indicating that buyers are not entirely absent. The MACD, while still showing negative momentum on this timeframe, is less concerning than on the 1-hour chart. The Stochastic oscillator, however, presents a conflicting signal, with the %K line at 50.1 and the %D line at 69.26, indicating a bearish crossover and suggesting potential downward pressure. The ADX value of 15.46 continues to point towards a weak trend, making it difficult for either bulls or bears to establish firm control. The overall signal here is neutral, highlighting the tug-of-war between short-term selling pressure and a more robust underlying bullish trend.
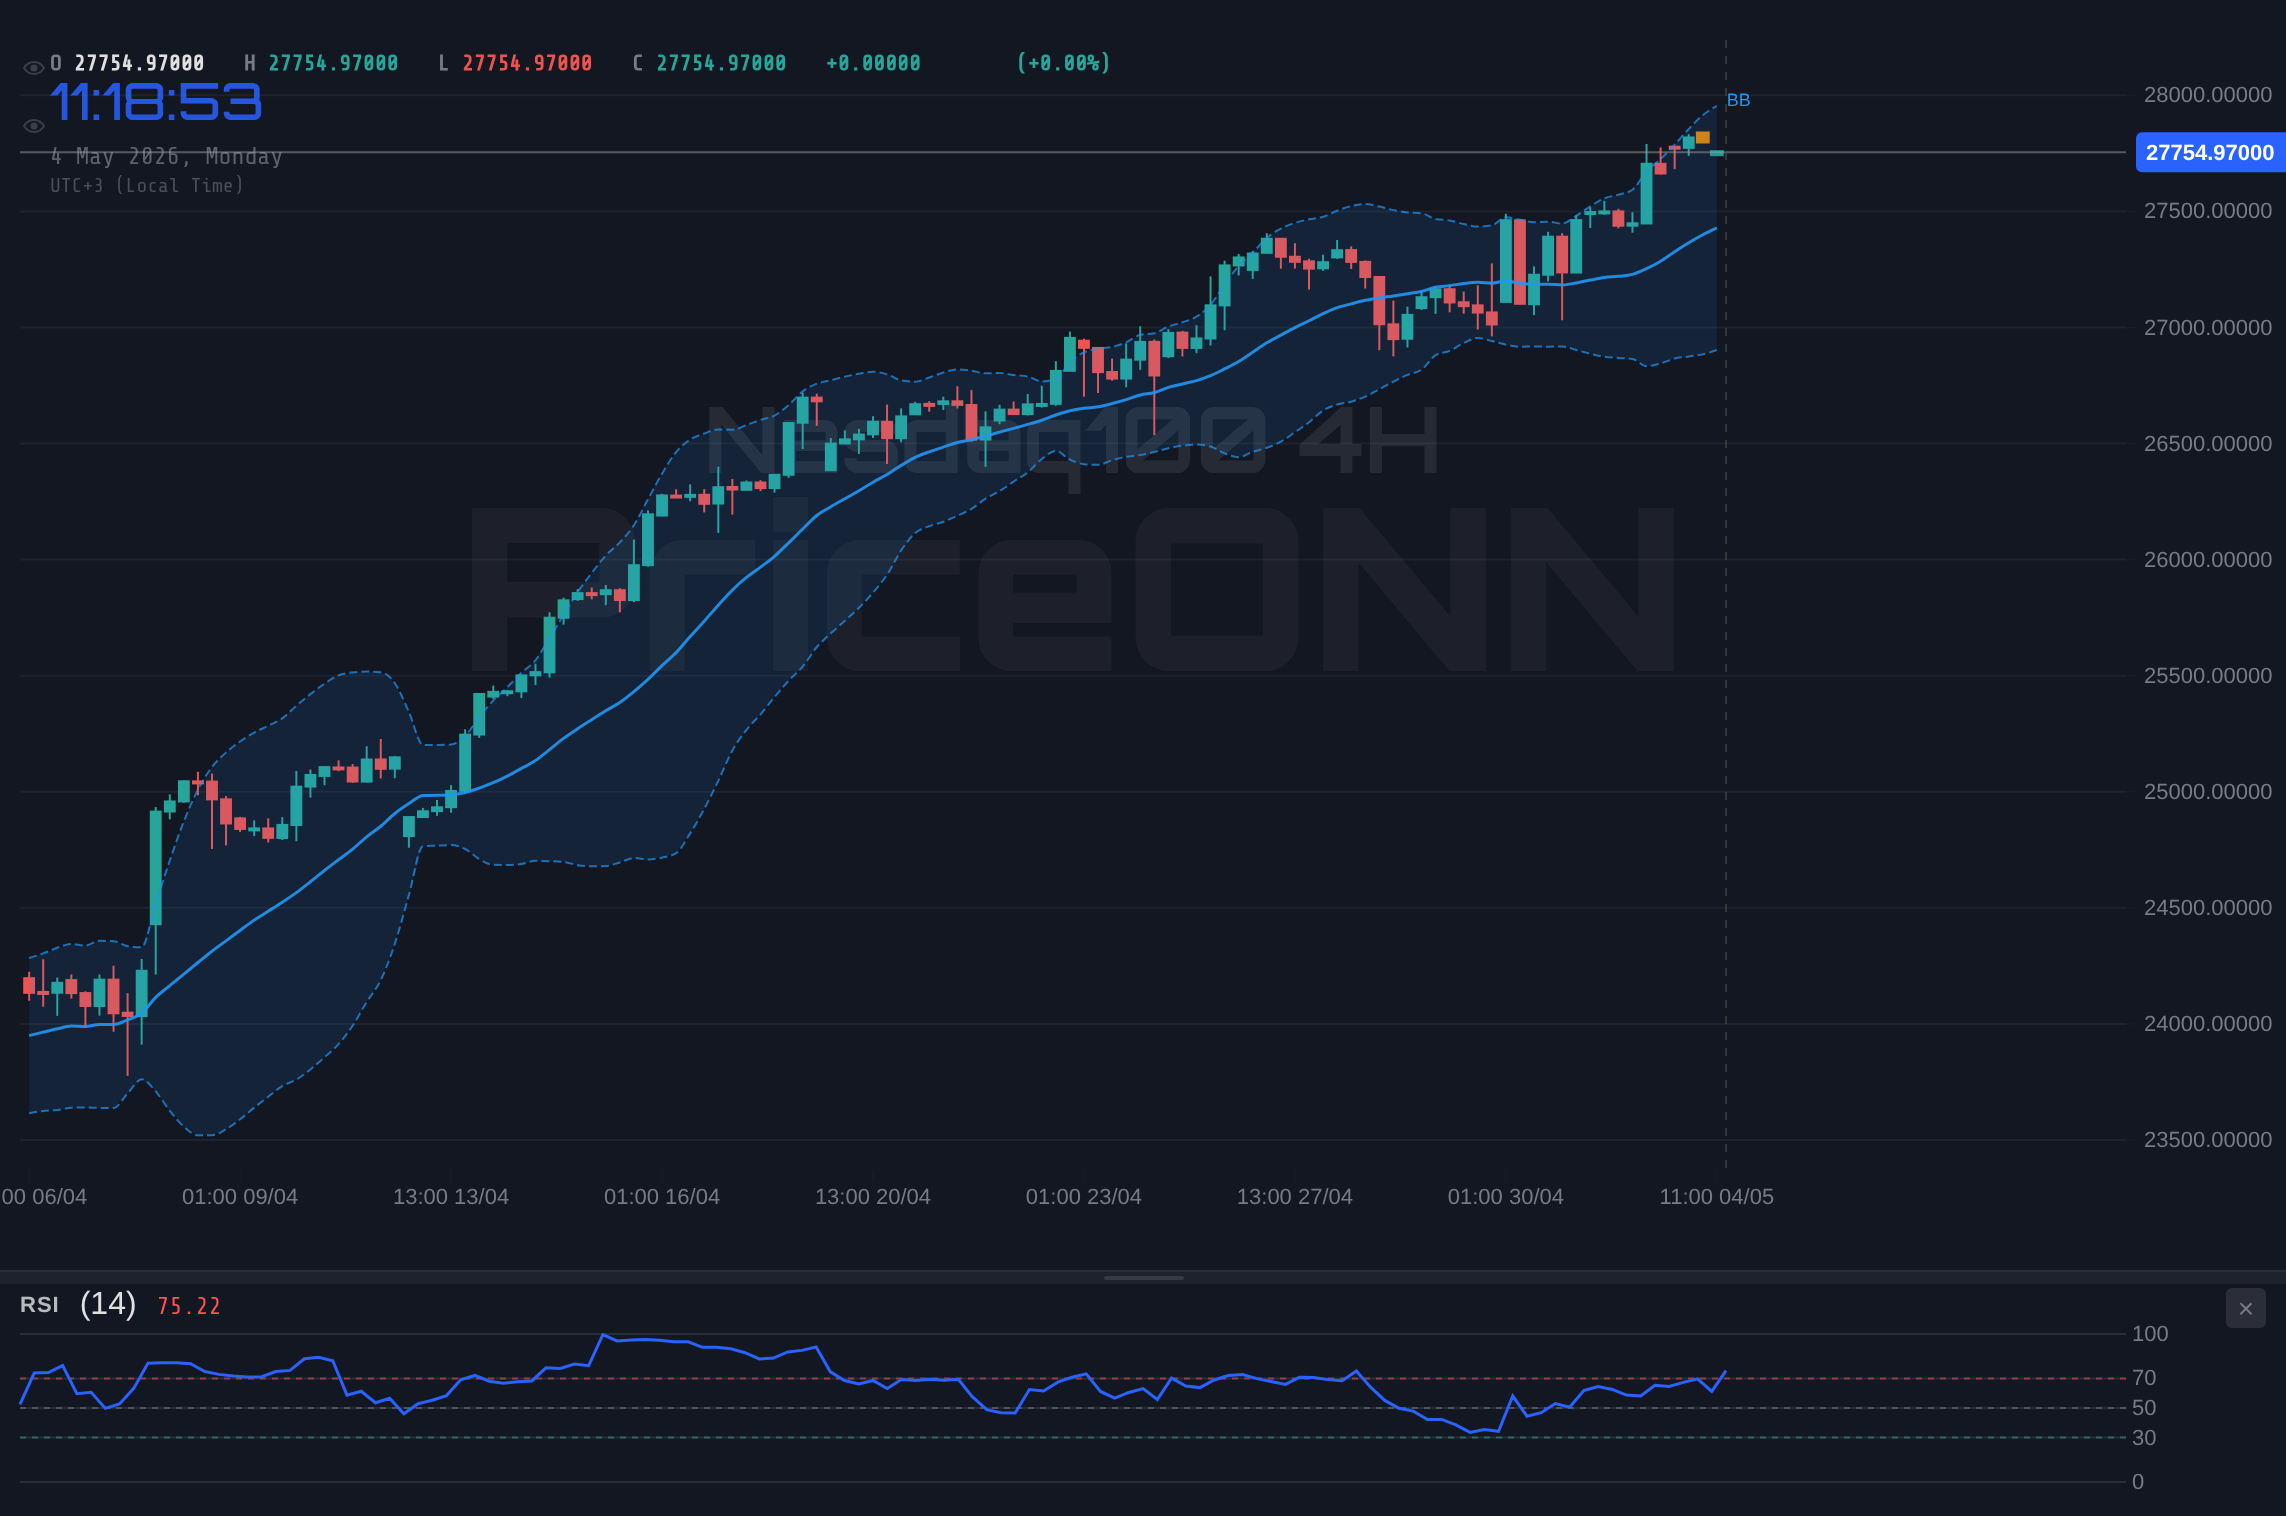
The daily chart paints the most definitive picture, showing a strong bearish trend with 100% conviction. This longer-term perspective suggests that despite any short-term fluctuations, the prevailing market sentiment is one of caution. The RSI stands at 46.45, firmly in neutral territory but trending downwards, which often precedes further price declines. The MACD indicator displays positive momentum, with the MACD line above its signal line, which could be interpreted as a potential leading indicator for a future bullish reversal, or simply a lagging signal within a larger downtrend. Bollinger Bands are situated below the middle band, reinforcing the bearish outlook. The Stochastic oscillator is showing a bullish signal with %K at 82.43 and %D at 60.01, indicating an overbought condition that, while potentially leading to a short-term pullback, doesn't negate the overall bearish trend strength indicated by the ADX at 43.76. This strong ADX reading signifies a firmly established downward trend on the daily timeframe.
The interplay between the Nasdaq 100 and the US Dollar Index (DXY) is a crucial element in understanding current market dynamics. With the DXY currently trading at 99.62, a level that historically indicates a strengthening dollar, we often observe inverse correlation with risk assets like the Nasdaq 100. A stronger dollar can make US equities more expensive for foreign investors, potentially dampening demand. However, the DXY itself shows mixed signals across different timeframes. On the 1-hour and 4-hour charts, the DXY exhibits a neutral trend with signals leaning towards buying, suggesting underlying dollar strength. Conversely, the daily chart shows a bullish trend with 95% strength, with an RSI at 56.22, indicating a generally positive sentiment for the dollar. This persistent dollar strength, despite its own internal technical signals, acts as a headwind for the Nasdaq 100, particularly as traders anticipate key US economic data releases that could further solidify the dollar's position or signal a potential shift in Federal Reserve policy.
Looking at correlated markets, the S&P 500 is currently trading at 6572.87, showing a significant daily gain of 0.74%. On its 1-hour chart, the S&P 500 exhibits a strong bullish trend (100% strength), with an RSI at 70.95, suggesting it is entering overbought territory. The 4-hour chart also shows a bullish trend, but the daily timeframe reverts to a bearish trend with 100% conviction, RSI at 45.35, and a strong ADX of 47.51. This divergence within the S&P 500 mirrors the Nasdaq 100's internal conflict. The Dow Jones Industrial Average, at 46408.5, is also showing a bearish trend on its daily chart, though its 1-hour and 4-hour trends are more mixed. The fact that these major US indices are exhibiting such contrasting signals across different timeframes underscores the current uncertainty and the importance of upcoming economic events in determining the next directional move. The Nasdaq 100's recent performance, despite a slight daily gain, is overshadowed by the longer-term bearish signals and its correlation with these broader market movements.
The energy sector, represented by Brent crude oil trading at $111.64 and WTI at $114.48, plays a significant role in the inflation narrative, which directly impacts central bank policy and, consequently, equity markets. Brent crude shows a strong bullish trend on the daily chart (100% strength) with an RSI of 64.04, while WTI also displays a strong bullish daily trend (100% strength) with an RSI of 71.45, nearing overbought conditions. Rising oil prices can fuel inflation concerns, potentially prompting central banks to maintain hawkish stances or even consider further tightening. This, in turn, can put pressure on growth-oriented assets like technology stocks within the Nasdaq 100. The current price action in oil suggests that inflationary pressures may persist, adding another layer of complexity to the Nasdaq 100's outlook. Investors are keenly watching these energy prices as a barometer for inflation and geopolitical stability, both critical factors influencing broader market sentiment and monetary policy decisions.
Bearish Scenario: Consolidation Below Resistance
65% ProbabilityNeutral Scenario: Range-Bound Trading
25% ProbabilityBullish Scenario: Breakout Above Key Levels
10% ProbabilityThe upcoming economic calendar is densely packed and presents a significant catalyst for potential market shifts. While specific dates for some high-impact US events are not provided in the current data, the general anticipation of key releases such as employment figures (NFP, ADP), inflation data (CPI, PCE), and manufacturing/services PMIs will be paramount. These reports are critical for shaping expectations around Federal Reserve policy. Should the data come in stronger than anticipated, particularly on the inflation front, it could reignite fears of further interest rate hikes or a prolonged period of higher rates. This would likely weigh on growth-sensitive assets like the Nasdaq 100, while potentially boosting the DXY. Conversely, weaker economic data could increase the probability of Fed rate cuts later in the year, offering a potential tailwind for the index. The market's reaction to these releases will be heavily influenced by the Fed's own commentary, which will be scrutinized for any hints about the future path of monetary policy. The current neutral-to-bearish short-term signals on the Nasdaq 100 suggest that any upside may be capped until a clearer fundamental picture emerges.
The current technical indicators, while presenting conflicting signals across different timeframes, collectively highlight a market in flux. On the 1-hour chart, the RSI at 46.32 and negative MACD momentum suggest immediate selling pressure. However, the 4-hour chart's bullish trend strength (93%) and the daily chart's overall bearish trend (100% conviction) with a strong ADX of 43.76 indicate that the market is grappling with conflicting forces. The ADX's consistent strength on the daily chart is particularly noteworthy, implying that a significant trend is in play, even if its direction is currently bearish. This suggests that short-term rallies might be opportunities for sellers to enter the market, rather than the start of a sustained upward move. The key will be how the index reacts to the upcoming economic data and any subsequent policy guidance from the Federal Reserve. The $24,003.44 level, while not a primary support or resistance from the provided data, serves as a psychological pivot point in the current choppy trading environment.
Traders are keenly watching the confluence of technical levels and upcoming economic catalysts. The 1-hour resistance at $24,029.55 and support at $23,732.13 define the immediate trading range. A decisive break above the 4-hour resistance at $24,079.88, potentially fueled by positive economic news, could signal a shift towards the bullish scenario, with targets at $24,323.25 and $24,367.28. Conversely, failure to hold the $23,787.66 support level, perhaps exacerbated by hawkish Fed signals or weak economic data, would likely confirm the bearish outlook, opening the door for further declines towards $23,638.95 and beyond. The weak trend indicated by the ADX across multiple timeframes suggests that confirmation will be crucial; false breakouts or breakdowns are a significant risk in this environment. Therefore, patience and adherence to risk management principles will be paramount for navigating these uncertain waters. Waiting for clear signals and avoiding premature entries will be key to capitalizing on any potential moves.
The current market sentiment for the Nasdaq 100 appears cautious, reflecting the mixed technical signals and the uncertainty surrounding upcoming economic data and central bank policy. While the 4-hour trend suggests underlying strength, the bearish conviction on the daily chart and the immediate selling pressure on the 1-hour timeframe cannot be ignored. The correlation with the DXY, which shows a robust bullish trend on its daily chart, further adds to the headwinds for risk assets. Investors are likely adopting a wait-and-see approach, seeking clarity before committing to significant positions. The price action around the $24,003 level will be a key indicator in the short term, acting as a psychological battleground between buyers and sellers. Any significant move will likely be catalyzed by a clear deviation in economic data from expectations or a definitive shift in Fed communication.
The interplay between inflation data and Federal Reserve policy expectations remains the dominant theme influencing the Nasdaq 100. Any indication that inflation is proving more persistent than anticipated could lead to a repricing of Fed rate cut expectations, potentially causing a sharp downturn in the index. Conversely, signs of cooling price pressures could boost risk appetite and support a rally. The market is highly sensitive to these macro-economic shifts, and the Nasdaq 100, being a growth-heavy index, is particularly vulnerable to changes in interest rate expectations. The current technical setup, with its conflicting signals, suggests that the market is waiting for a definitive fundamental catalyst to break the deadlock. Until then, expect choppy trading with a potential bias towards downside, especially if the DXY continues to show strength.
Frequently Asked Questions: Nasdaq100 Analysis
What happens if the Nasdaq 100 breaks below the $23,787.66 support level?
A break below the $23,787.66 support on the 4-hour chart would likely confirm the bearish trend indicated on the daily timeframe. This could trigger further selling pressure, with the next significant target potentially being the $23,638.95 level. Such a move would signal a loss of confidence from buyers and could lead to a more pronounced downturn.
Should I consider buying the Nasdaq 100 at current levels around $24,003 given the mixed technical signals?
Entering long positions at current levels carries significant risk due to the conflicting signals across timeframes and the looming economic data. While the 4-hour trend shows strength, the 1-hour and daily charts present bearish pressures. A more prudent approach would be to wait for confirmation, such as a decisive break above $24,079.88 with strong volume, or a clear bounce from a more significant support level like $23,787.66.
Is the RSI at 46.32 on the 1-hour chart a strong sell signal for the Nasdaq 100?
An RSI reading of 46.32 on the 1-hour chart indicates bearish momentum, but it is not yet in oversold territory. While it suggests short-term selling pressure, it's not a standalone sell signal. This reading should be considered in conjunction with other indicators like the MACD, which also shows negative momentum, and the overall trend context, which is mixed across timeframes.
How will upcoming US economic data releases affect the Nasdaq 100 this week?
Upcoming US data, particularly inflation and employment reports, will be crucial. Stronger-than-expected data could fuel Fed rate hike fears, pressuring the Nasdaq 100. Conversely, weaker data might increase expectations for rate cuts, potentially boosting the index. The market's reaction will depend heavily on whether the data confirms or contradicts current Fed policy expectations.
The Nasdaq 100 currently finds itself at a critical crossroads, caught between short-term bearish pressures and a more resilient longer-term trend. The prevailing uncertainty, amplified by upcoming economic data and geopolitical considerations, suggests that volatility is likely to remain elevated. For traders, patience and disciplined risk management are paramount. Waiting for clear directional signals, confirmed by multiple timeframes and fundamental catalysts, will be key to navigating this complex market landscape. While the bears have shown some teeth, the underlying strength on the 4-hour chart suggests that a decisive move higher is still possible if the fundamental backdrop shifts favorably. However, until then, caution remains the watchword.
Track markets in real-time
AI-powered analysis, technical indicators and real-time price data.
Join Our Telegram Channel
Breaking market news, AI analysis and trading signals instantly.
Join Channel