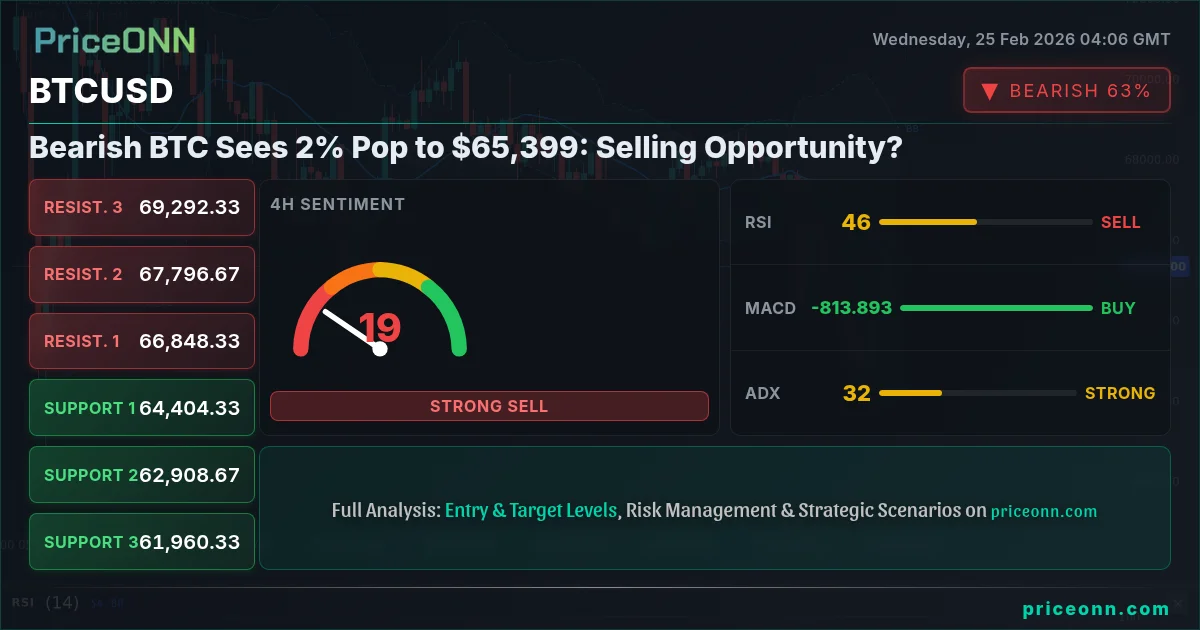
Bitcoin's recent price action has been a rollercoaster, with bearish sentiment dominating the market for the past few weeks. As BTCUSD experiences a 2.11% pop to $65,399, traders are asking a critical question: Is this a selling opportunity or the start of a bottom?
- RSI at 35.93 on the daily chart signals oversold conditions but strong downward momentum persists.
- Key resistance level to watch stands at $66,353.33; a break above this level could signal a trend reversal.
- ADX at 56.75 indicates a very strong downtrend, suggesting caution for bullish positions.
- Market sentiment is heavily influenced by upcoming USD data releases, with potential for increased volatility.
The cryptocurrency market has been closely watching macroeconomic developments, especially the performance of the US dollar. The DXY (Dollar Index), currently at 97.46, reflects the strength of the dollar against a basket of other currencies. Typically, a stronger dollar puts downward pressure on Bitcoin and other cryptocurrencies, as they become relatively more expensive for international investors. The correlation between BTCUSD and DXY remains a significant factor in assessing Bitcoin's short-term trajectory.
Adding to the complexity is the performance of the SP500 and Nasdaq indices. While both indices show a slight upward movement today, the overall trend remains uncertain. The SP500 is currently trading at 6896.8, while the Nasdaq is at 25013.76. A decline in risk appetite, as reflected in these indices, can often lead to increased demand for safe-haven assets, potentially diverting funds away from Bitcoin.
Why $66,353.33 is the Line in the Sand
From a technical perspective, several key indicators are providing mixed signals. On the daily chart, the Relative Strength Index (RSI) for BTCUSD is at 35.93, suggesting that the asset is approaching oversold conditions. However, the Average Directional Index (ADX) is at a robust 56.75, indicating that the downtrend is still very strong. This divergence suggests that while a bounce is possible, the underlying bearish momentum remains a significant force.
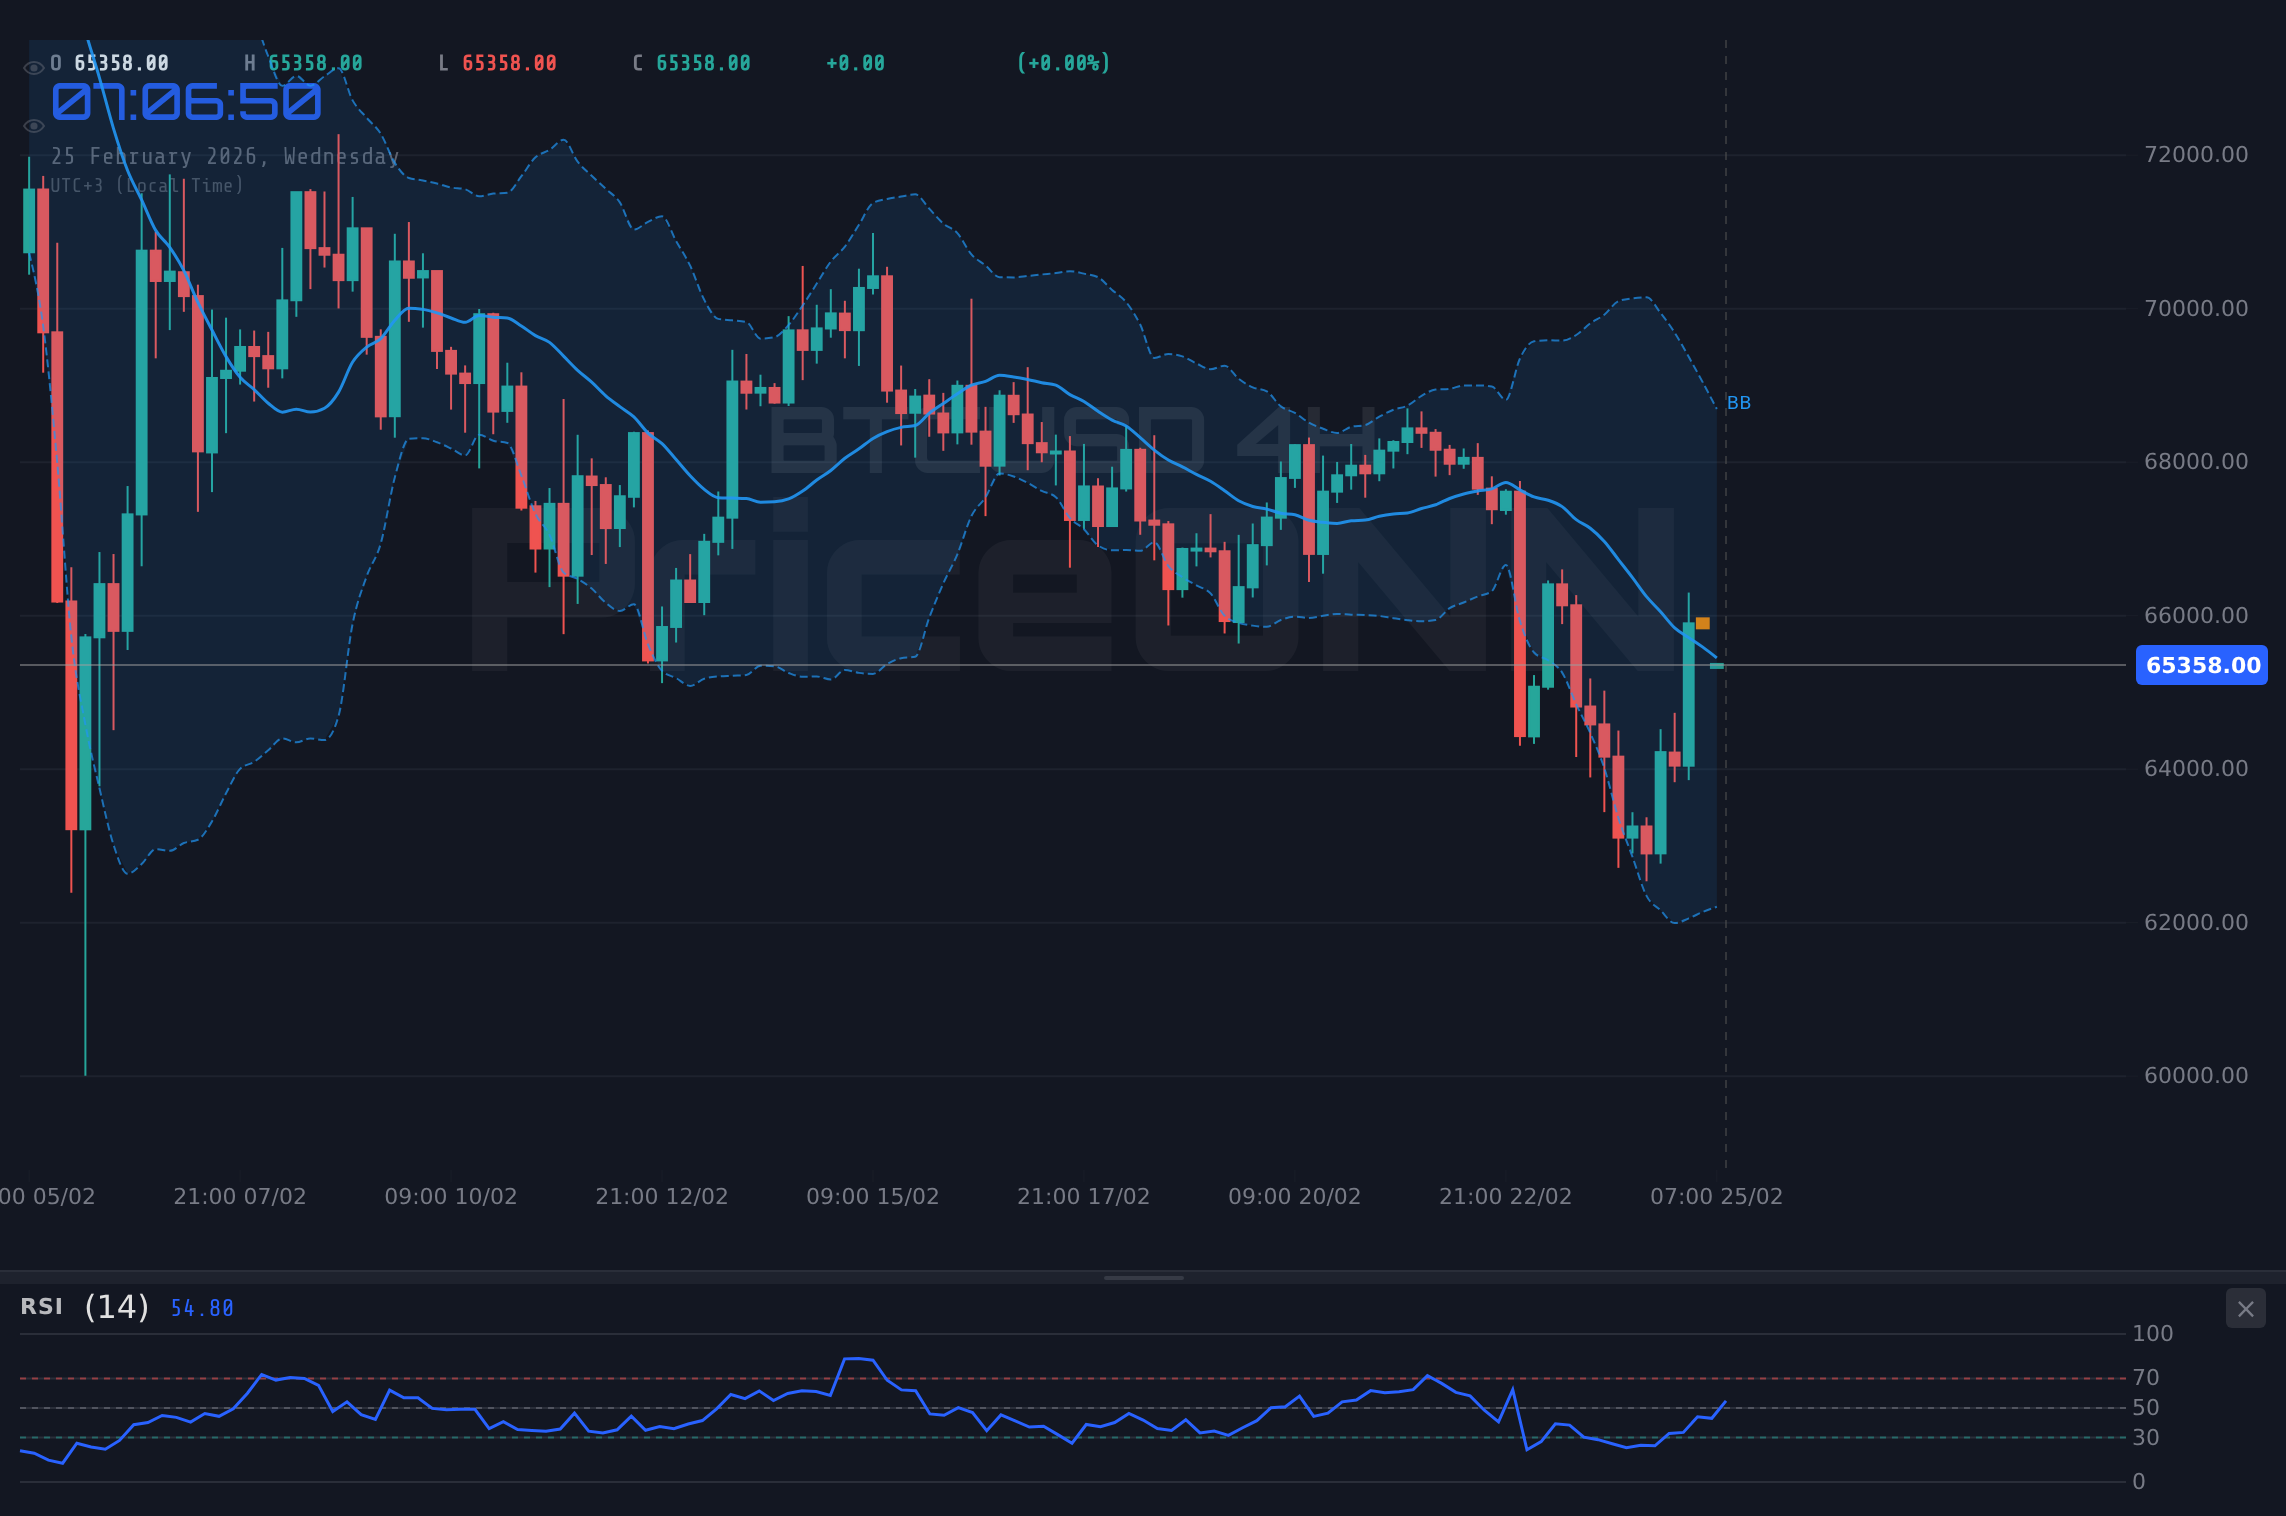
The Moving Average Convergence Divergence (MACD) histogram presents another layer of complexity. Although the MACD line is currently above the signal line, indicating positive momentum, the histogram is narrowing, which could be a sign that bullish momentum is waning. Traders should watch for a potential crossover of the MACD lines, which would signal a shift in the trend.
Key resistance levels to monitor are $65199.67, $66353.33, and $67683.67, while support levels are found at $62715.67, $61385.33, and $60231.67. The price action around these levels will provide valuable clues about the sustainability of the current bounce.
Economic Events to Watch This Week
Economic data releases are set to play a crucial role in determining the direction of BTCUSD. The market is keenly awaiting upcoming USD data releases, which could significantly impact the dollar's strength and, consequently, Bitcoin's price. Any deviation from the forecast could lead to increased volatility in the cryptocurrency market. According to recent reports, forecasts for upcoming economic indicators such as unemployment claims and GDP growth estimates will be carefully scrutinized.
As the market digests these economic releases, traders should also keep an eye on geopolitical developments. Any escalation of tensions or unexpected events could trigger safe-haven flows, potentially benefiting Bitcoin. Reuters recently reported that investors are closely monitoring developments in Eastern Europe, as well as trade negotiations between the US and China.
Trade Plan: Riding the Volatility
Given the conflicting signals and the potential for increased volatility, a well-defined trade plan is essential. Here's a potential strategy for navigating the current market conditions:
If BTCUSD breaks above $66353.33 resistance, look for a continuation towards $67683.67 and potentially $68000. A daily close above $66353.33 would confirm this breakout.
If BTCUSD fails to hold above $62715.67 support, expect a move towards $61385.33 and potentially $60231.67. A sustained break below $62715.67 would accelerate the decline.
Trade Recommendation: Given the overall bearish trend, the recommendation is to consider a short position on a break below $62715.67. Set a stop-loss above $65199.67 to protect against unexpected upside. Target profits at $61385.33 and $60231.67.
Risk Management: Protect Your Capital
As with any trading strategy, risk management is paramount. Given the current market volatility, it is crucial to set appropriate stop-loss orders and avoid overleveraging positions. The upcoming USD data releases could trigger sudden price swings, so caution is warranted.
Be aware that the cryptocurrency market is highly volatile and subject to unexpected events. Economic data releases and geopolitical developments can significantly impact Bitcoin's price. Always trade with caution and manage your risk effectively.
Frequently Asked Questions: BTCUSD Analysis
Is BTCUSD a good buy right now?
Given the current bearish trend and strong downward momentum, BTCUSD may not be a good buy right now. Wait for a clear breakout above $66353.33 or a confirmed bottom near $62715.67 before considering a long position.
What is the BTCUSD price forecast for this week?
The BTCUSD price forecast for this week is highly dependent on upcoming economic data releases. If the data is positive for the USD, expect a potential decline towards $61385.33. Conversely, weaker USD data could trigger a rally towards $66353.33.
What are the key support and resistance levels for BTCUSD?
Key support levels for BTCUSD are at $62715.67, $61385.33, and $60231.67. Key resistance levels are at $65199.67, $66353.33, and $67683.67. These levels will likely act as pivotal points for price action in the coming days.
Why is BTCUSD moving today?
BTCUSD is moving today due to a combination of factors, including a slight recovery from oversold conditions and anticipation of upcoming economic data releases. The performance of the DXY and broader equity markets is also influencing Bitcoin's price action.
Key Levels
Key Levels
Support Levels
Resistance Levels
Technical Outlook Summary
Technical Outlook Summary
| Indicator | Value | Signal |
|---|---|---|
| RSI (14) | 35.93 | Neutral |
| MACD Histogram | Positive | Bullish |
| Stochastic | 24.1 | Bearish |
| ADX | 56.75 | Strong Downtrend |
| Bollinger | Middle Band | Watch |
Track markets in real-time
AI-powered analysis, technical indicators and real-time price data.
Join Our Telegram Channel
Breaking market news, AI analysis and trading signals instantly.
Join Channel