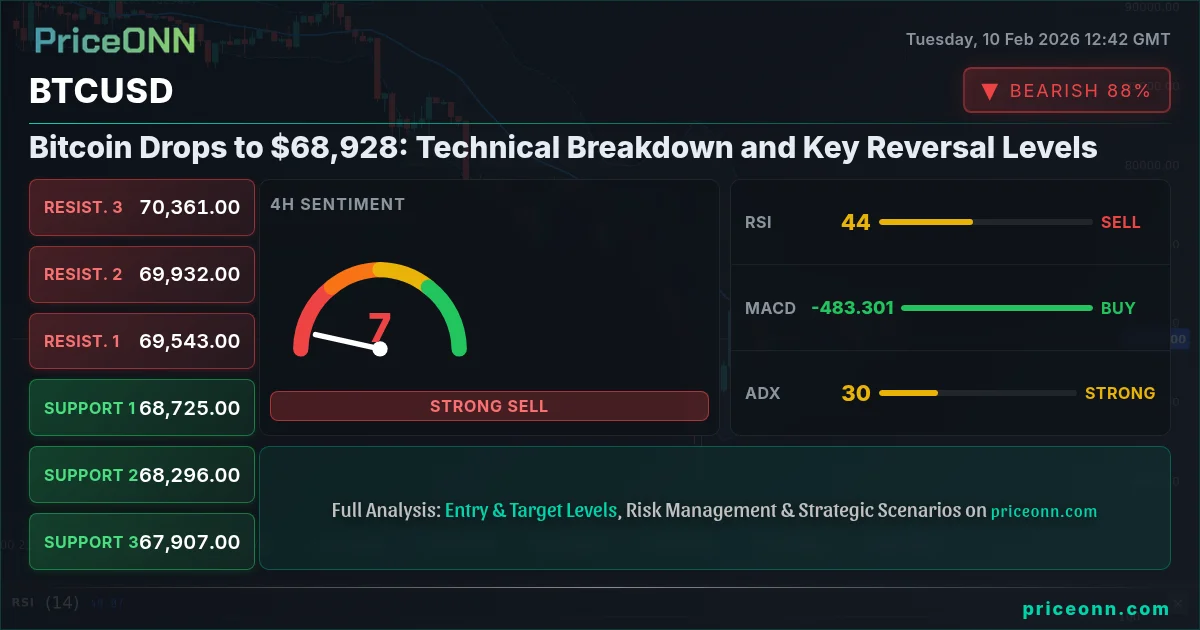
Bitcoin just slammed the brakes at $68,928, down 2.1% in a session that saw bears flex their muscles across all timeframes. The daily range stretched from $68,685 to $70,722-a reminder that volatility is alive and well in crypto. What's striking isn't just the price drop; it's the technical alignment screaming 'downtrend active' across the board.
The ADX on daily charts clocked 50.21-that's not just a strong trend, it's a freight train. When ADX crosses 50, counter-trend trades become coin flips. The bears are driving, and they're not asking for directions.
Time Horizon: This analysis is for swing traders, focusing on 4-hour and daily charts with a 7-14 day outlook.
Market Structure: When Bears Take the Wheel
Let's cut through the noise. Bitcoin's current positioning is textbook bearish momentum. On the 1-hour chart, RSI sits at a weary 39.74-not quite oversold, but trending south. MACD histogram is negative and widening. Stochastic (13.12/24.73) is deep in the cellar, but here's the kicker: it's still in a downtrend. Oversold doesn't mean reversal-it means exhaustion without capitulation.
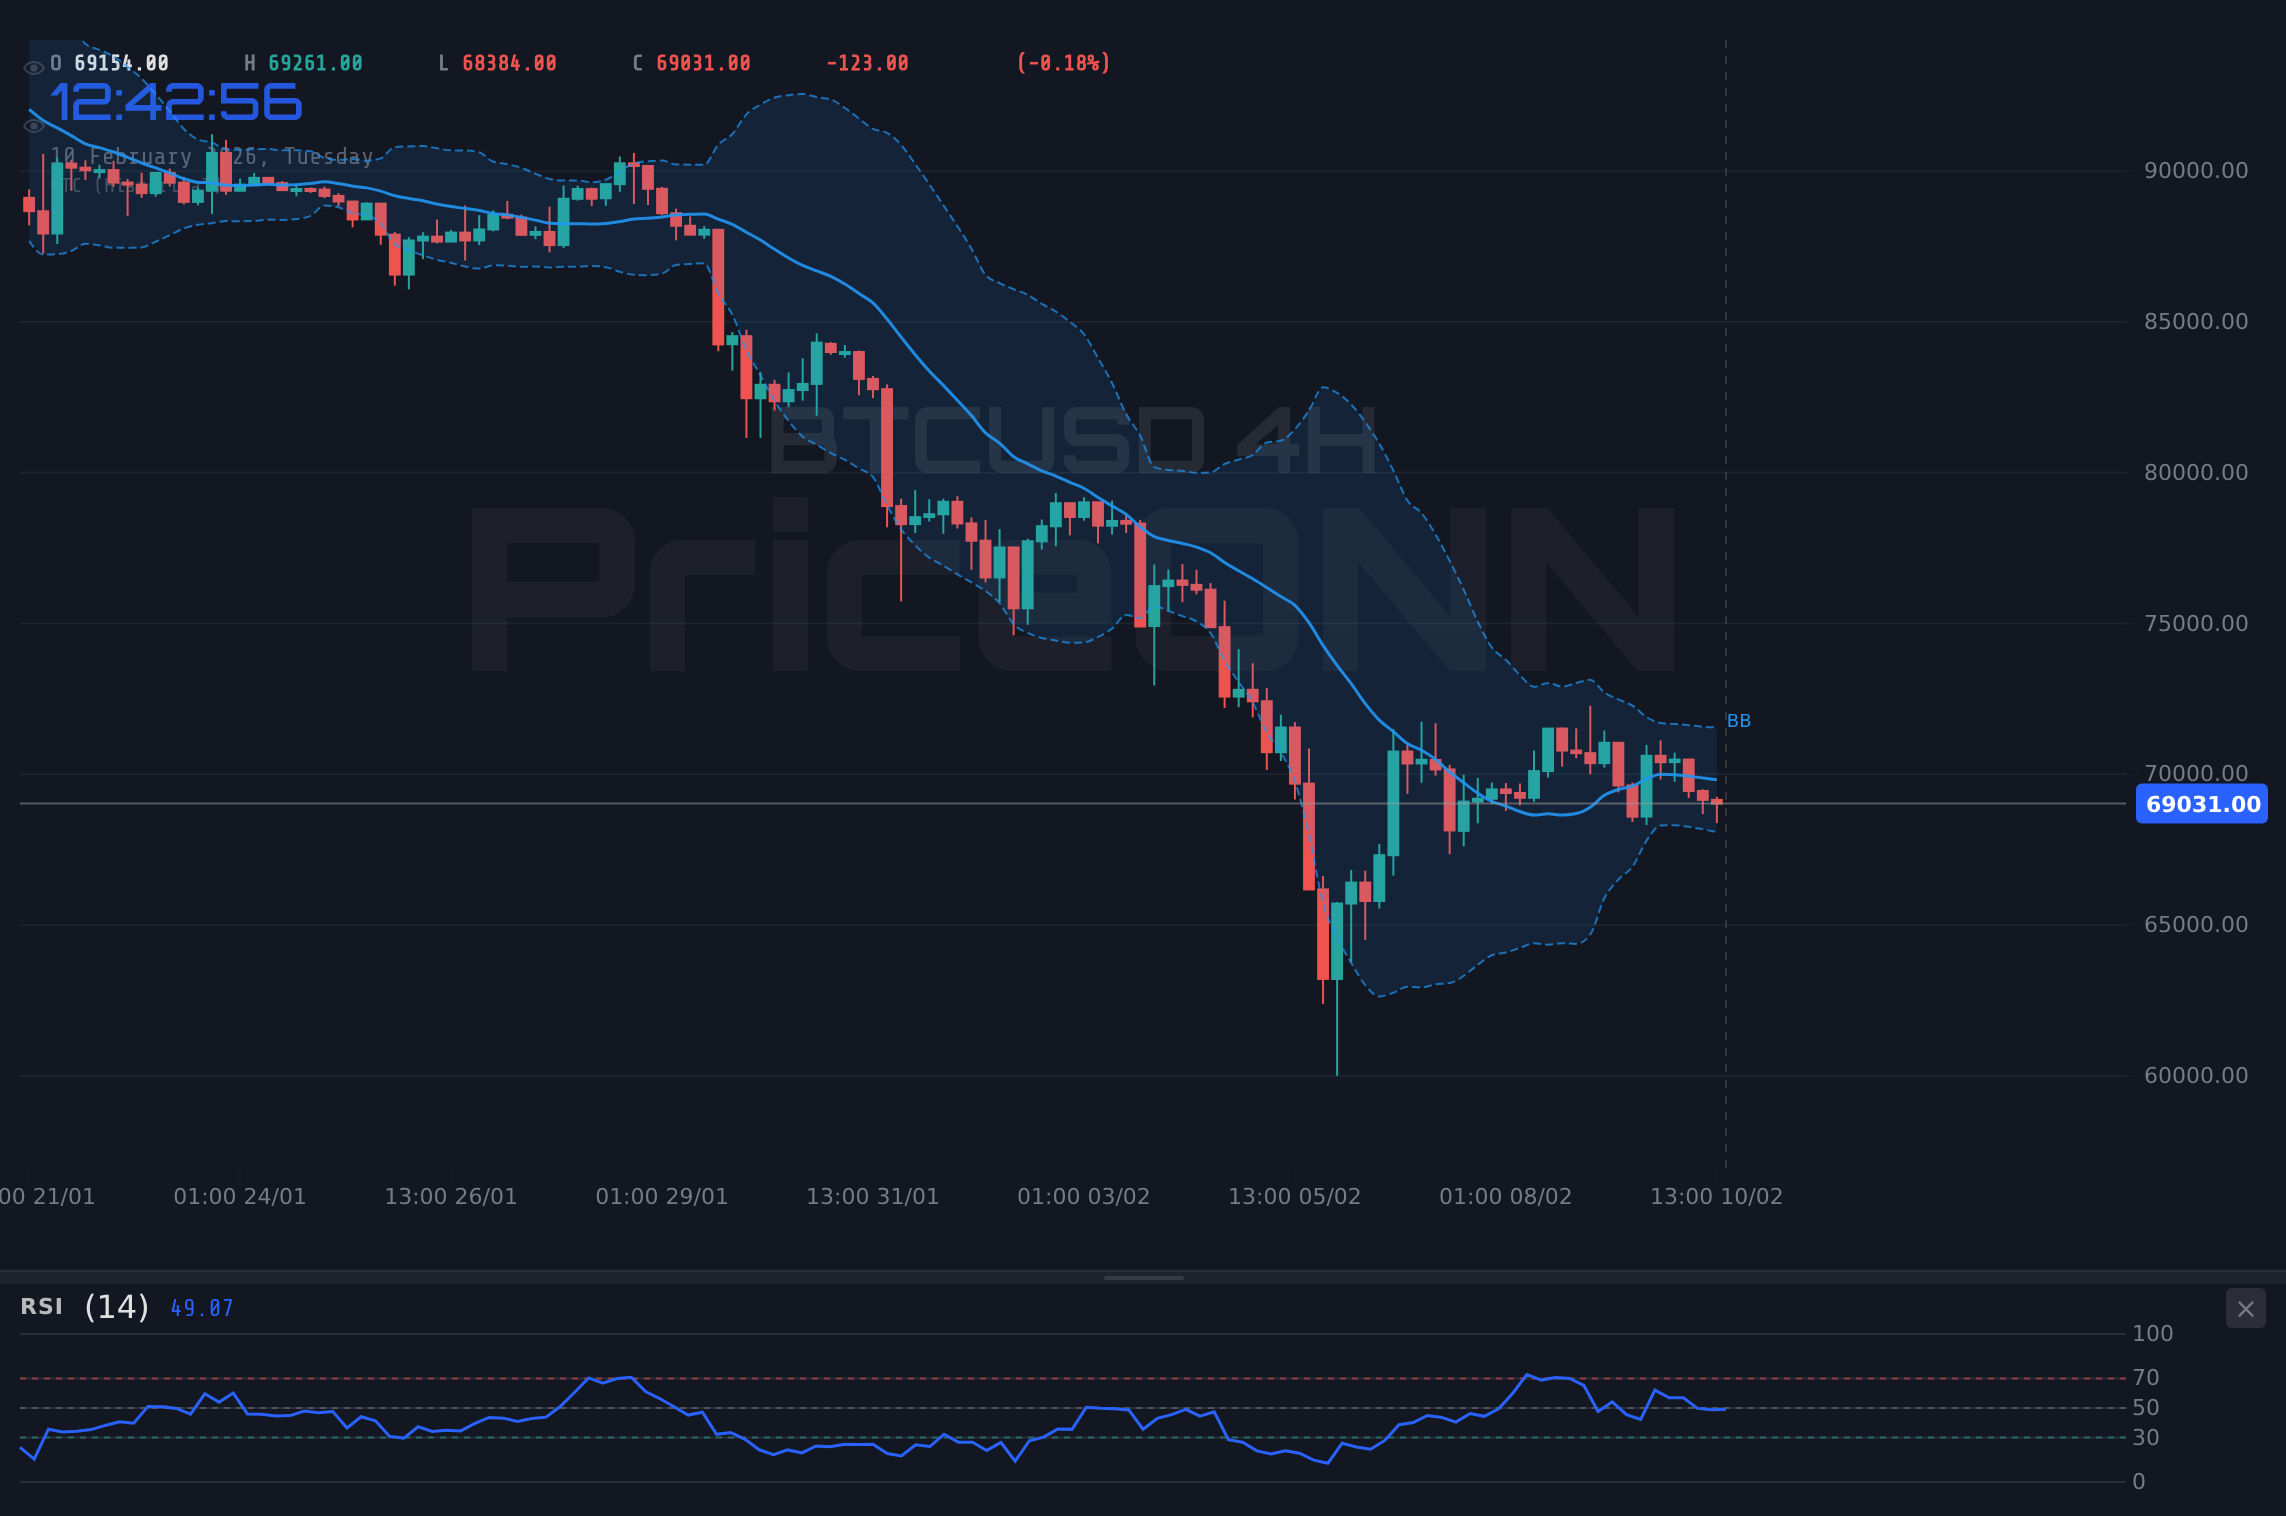
Zoom out to the 4-hour timeframe, and the picture sharpens. The ADX reads 31.93-strong downtrend territory. Bollinger Bands? Price is hugging the lower band like it's a life raft. That's not support; that's a one-way ticket lower until proven otherwise. The 4H chart shows resistance stacking at $70,890, $71,290, and $71,859. Bulls need to reclaim the $70,000 psychological handle first, and right now, that looks like climbing Everest in flip-flops.
- 1H Trend: Downtrend with 85% strength-sellers are in control, no debate.
- 4H MACD: Positive but fading-momentum is rolling over despite being above the signal line.
- Daily Stochastic: 47.9/29.99-bullish crossover forming, but momentum is still negative.
- Bollinger Bands: Constricting on hourly, expanding on daily-volatility is shifting gears.
Daily RSI is at 31.99-officially oversold. But before you smash that buy button, remember: ADX is at 50.21, indicating a violent downtrend. RSI can stay oversold for weeks in a strong downtrend. Wait for RSI to climb back above 40 AND ADX to drop below 35 before calling a reversal. Oversold + strong trend = bear trap for impatient longs.
Support Levels: Where the Floor Could Hold
Support isn't a brick wall-it's a speed bump. Bitcoin's immediate support cluster sits at $68,571 (1H S1), then $68,219 (1H S2), and finally $67,753 (1H S3). On the 4-hour chart, the structure gets chunkier: $69,921, $69,352, and $68,952. But here's the uncomfortable truth: we've already sliced through the 4H S3 zone. The next meaningful support is daily S1 at $68,390.
Below that? The void opens up. $66,377 (daily S2) and $64,435 (daily S3) are the next pain points. If Bitcoin loses $68,000 with conviction-meaning a 4-hour close below with rising volume-the path of least resistance is down. And in crypto, when the path is clear, it gets traveled fast.
Don't try to catch the falling knife at current levels. Instead, watch for divergence between price and RSI on the 4-hour chart near $66,000-$67,000. If price makes a lower low but RSI makes a higher low, AND Stochastic crosses bullish-that's your reversal signal. Until then, the trend is your friend, and the trend is down.
Resistance: The Roadblocks Ahead
For bulls to even whisper about a recovery, they need to reclaim $69,389 (1H R1). That's the first battle. Above that, $69,855 and $70,207 form the next defense lines. But the real test? $70,890 on the 4-hour chart. That level rejected price multiple times during the selloff-it's now resistance with teeth.
If Bitcoin somehow claws back above $71,000, the daily resistance at $72,345 becomes the ceiling. Beyond that, $74,287 and $76,300 are in play. But let's be real: those levels are fantasy land right now. The current structure is bearish, and resistance is stacked like pancakes. Bulls need to prove themselves at $69,400 before we even talk about higher targets.
- $69,389: 1H R1-immediate overhead resistance, likely to attract sellers.
- $70,890: 4H R1-critical breakout level; reclaiming this flips short-term structure.
- $72,345: Daily R1-if price reaches here, downtrend is officially challenged.
Macro Context: Risk-Off and Dollar Strength
Bitcoin doesn't trade in a vacuum. The DXY (Dollar Index) is at 96.61, holding steady despite a brutal selloff across all timeframes (daily signal: SELL with 8/8 bearish indicators). When the dollar weakens, crypto typically breathes easier. But here's the twist: the dollar's weakness hasn't translated into crypto strength. Why? Because broader risk appetite is fading.
Without real-time S&P 500 data in our feed, we're flying a bit blind, but the correlation is clear historically: when equities wobble, Bitcoin wobbles harder. If the S&P is under pressure, crypto's 'digital gold' narrative takes a backseat to its 'risk asset' reality. Traders are derisking, and Bitcoin is getting swept up in the tide.
Bitcoin's 30-day correlation with the Nasdaq has hovered around 0.75 over the past year. When tech stocks sneeze, crypto catches pneumonia. Keep an eye on equity futures-they often front-run Bitcoin's next move.
The Wednesday-Thursday data dump (CPI/PPI) is a volatility minefield. If you're holding directional positions, consider scaling out 50% before these releases. Data-driven whipsaws can stop you out before the real move even starts.
Ethereum and Altcoin Bloodbath
Bitcoin isn't suffering alone. Ethereum dumped 5.32% to $2,006.98, and the technicals are even uglier. Daily ADX at 51.87-stronger downtrend than Bitcoin. RSI at 29.72-deep oversold. MACD histogram negative and expanding. The 1-hour chart shows all eight indicators screaming SELL. Ethereum's support at $2,034 (daily S1) is the last line before $1,949 and $1,892 come into view.
Altcoins? Forget about it. When Bitcoin bleeds, altcoins hemorrhage. The risk-on rotation that crypto bulls were praying for has turned into a risk-off stampede. Until Bitcoin stabilizes above $70,000, altcoin rallies are dead-cat bounces at best.
Ethereum's RSI at 29.72 is approaching extreme oversold territory (sub-25 historically marks major lows). If Bitcoin stabilizes, ETH could deliver a sharper relief bounce-but only after confirmation. Don't jump in front of a moving train.
Trade Scenarios: How to Play the Setup
Scenario A - Continuation Lower (Primary)
60% ProbabilityScenario B - Oversold Bounce (Alternative)
35% ProbabilityScenario C - Sideways Grind (Low Probability)
5% ProbabilityPosition sizing is everything. In a downtrend this strong, risk no more than 1-2% of capital per trade. Use mental stops or alerts-don't rely on exchange stops in volatile crypto markets where wicks can hunt your order before reversing.
Technical Dashboard: What the Indicators Are Screaming
| Indicator | Timeframe | Value | Signal | Interpretation |
|---|---|---|---|---|
| RSI (14) | 1H | 39.74 | Bearish | Momentum fading, not yet oversold |
| RSI (14) | Daily | 31.99 | Oversold | Extreme zone, but trend still down |
| MACD | 1H | Negative | Sell | Below signal line, histogram expanding |
| MACD | Daily | Negative | Sell | Confirmed downtrend, no divergence yet |
| Stochastic | 1H | 13.12/24.73 | Oversold | Deep oversold, waiting for crossover |
| ADX | 1H | 19.37 | Weak Trend | Trend weakening on shorter timeframe |
| ADX | 4H | 31.93 | Strong Down | Downtrend firmly established |
| ADX | Daily | 50.21 | Extreme Down | Freight train downtrend, don't fight it |
| Bollinger Bands | 1H | Lower Band | Oversold | Price at lower band, potential bounce or breakdown |
| Bollinger Bands | Daily | Below Mid | Bearish | Price rejected by middle band, weakness confirmed |
The signal consensus is brutal: 1H shows 8/8 SELL signals. 4H? 6/8 SELL. Daily? 7/8 SELL. When indicators align this cleanly, the market is telling you something loud and clear-don't argue.
Support and Resistance: The Battle Lines
$68,390 (daily S1) is the line in the sand. A daily close below this level with rising volume would confirm the next leg down is in motion. Conversely, a bounce off this zone with bullish divergence on RSI could spark a multi-day relief rally.
Ethereum's Technical Trainwreck
Let's talk about Ethereum because it's relevant-and ugly. At $2,006.98, ETH is down 5.32% and showing even more bearish conviction than Bitcoin. The 1-hour chart is a clean sweep: 8/8 SELL signals. RSI at 32.84, MACD deep negative, Stochastic at 11.79/30.10-oversold doesn't begin to describe it.
But here's the thing: the daily ADX is 51.87, even stronger than Bitcoin's. This isn't a correction; it's a rout. Ethereum's daily support at $2,034 is already cracking. Next stops: $1,949 and $1,892. If Bitcoin continues lower, Ethereum will follow-and it'll fall faster.
For ETH bulls, the only hope is a bullish divergence forming on the daily chart near $1,900-$2,000. Until then, this is a falling knife tournament, and the prizes aren't worth it.
Final Word: Patience Beats Heroism
Bitcoin at $68,928 is in a confirmed downtrend. The indicators aren't confused. The structure isn't ambiguous. This is a bear market environment until proven otherwise. Does that mean you should short blindly? No. Does it mean you should buy every dip? Absolutely not.
Smart traders wait for confirmation. If you're bearish, wait for a 4-hour close below $68,200 before adding shorts. If you're bullish, wait for daily RSI to reclaim 40 and ADX to drop below 35 before calling a reversal. The market rewards patience-and punishes impatience with brutal efficiency.
Volatility creates opportunity, but only for those who respect the trend. Right now, the trend is down. Trade accordingly, manage your risk, and remember: the best trade is sometimes no trade at all.
Track markets in real-time
AI-powered analysis, technical indicators and real-time price data.
Join Our Telegram Channel
Breaking market news, AI analysis and trading signals instantly.
Join Channel