
BTCUSD Hovers Near $69,003: Will Bullish Momentum Hold Amidst Mixed Signals?
Bitcoin trades at $69,003, testing key resistance. Mixed technical indicators and macro crosscurrents create a critical juncture. Is a breakout imminent, or consolidation ahead?
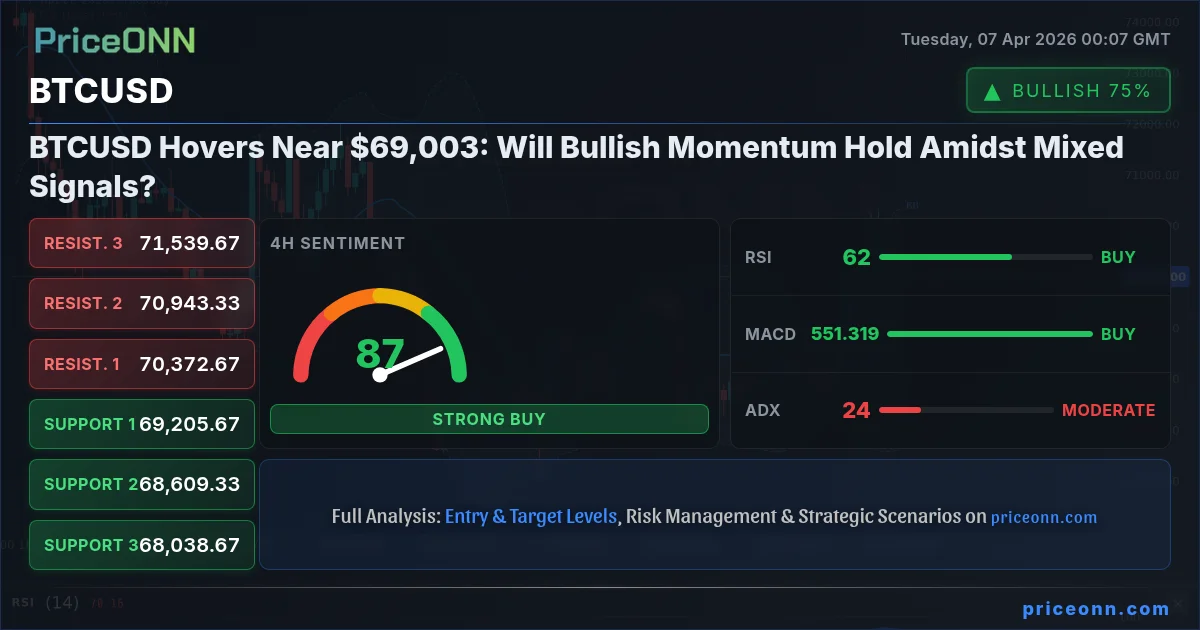
Bitcoin is currently navigating a critical juncture, trading at exactly $69,003.00 as traders weigh mixed technical signals against a backdrop of shifting macroeconomics and ongoing crypto-specific developments. The past week has seen BTCUSD consolidate near its all-time highs, but the lack of decisive momentum leaves many questioning the sustainability of the current uptrend. This analysis delves into the intricate dance between on-chain metrics, technical patterns, and the broader market sentiment to decipher Bitcoin's immediate path forward.
- Bitcoin is trading at $69,003, a key psychological and technical level.
- The 1H RSI at 48.3 suggests bearish momentum, while the 4H RSI at 61.48 indicates a neutral-to-bullish trend.
- Key support for BTCUSD is identified at $68,557, with resistance looming at $69,328.
- The correlation with the DXY, currently at 99.8, adds a layer of complexity, potentially pressuring risk assets.
The cryptocurrency market, and Bitcoin in particular, has been on a rollercoaster ride, with significant price swings and evolving narratives. While the recent surge has recaptured the $69,000 level, the immediate price action around $69,003.00 is far from a clear signal. The 1-hour chart paints a somewhat cautious picture, with an RSI of 48.3 suggesting that bearish momentum might be building in the short term. This indicator, designed to measure the speed and change of price movements, often signals overbought or oversold conditions; its current position nudges towards caution rather than aggressive buying. Furthermore, the MACD on the same timeframe is showing negative momentum, sitting below its signal line, which traditionally indicates that selling pressure is outweighing buying pressure. This short-term bearish sentiment is reinforced by the Stochastic oscillator, with %K at 20.46 and %D at 41.03, clearly indicating a bearish crossover and suggesting further downside potential in the immediate intraday hours.
However, zooming out to the 4-hour timeframe offers a more optimistic, albeit still cautious, perspective. Here, the RSI stands at a more neutral 61.48, indicating that while not yet in overbought territory, the momentum is leaning towards the upside. This divergence between the 1-hour and 4-hour charts highlights the choppiness and indecision currently plaguing BTCUSD. The MACD on the 4-hour chart is actually showing positive momentum, with the MACD line above its signal line, suggesting that the broader trend for the day might still be intact. The Stochastic oscillator on this timeframe, with %K at 74.72 and %D at 80.4, shows a bearish crossover but is approaching overbought territory, hinting at potential consolidation rather than an immediate sharp decline. The ADX, a measure of trend strength, is at 37.33 on the 1-hour chart, signaling a strong downtrend, but drops to a more moderate 24.21 on the 4-hour chart, suggesting that the prevailing trend is present but not overwhelmingly dominant.
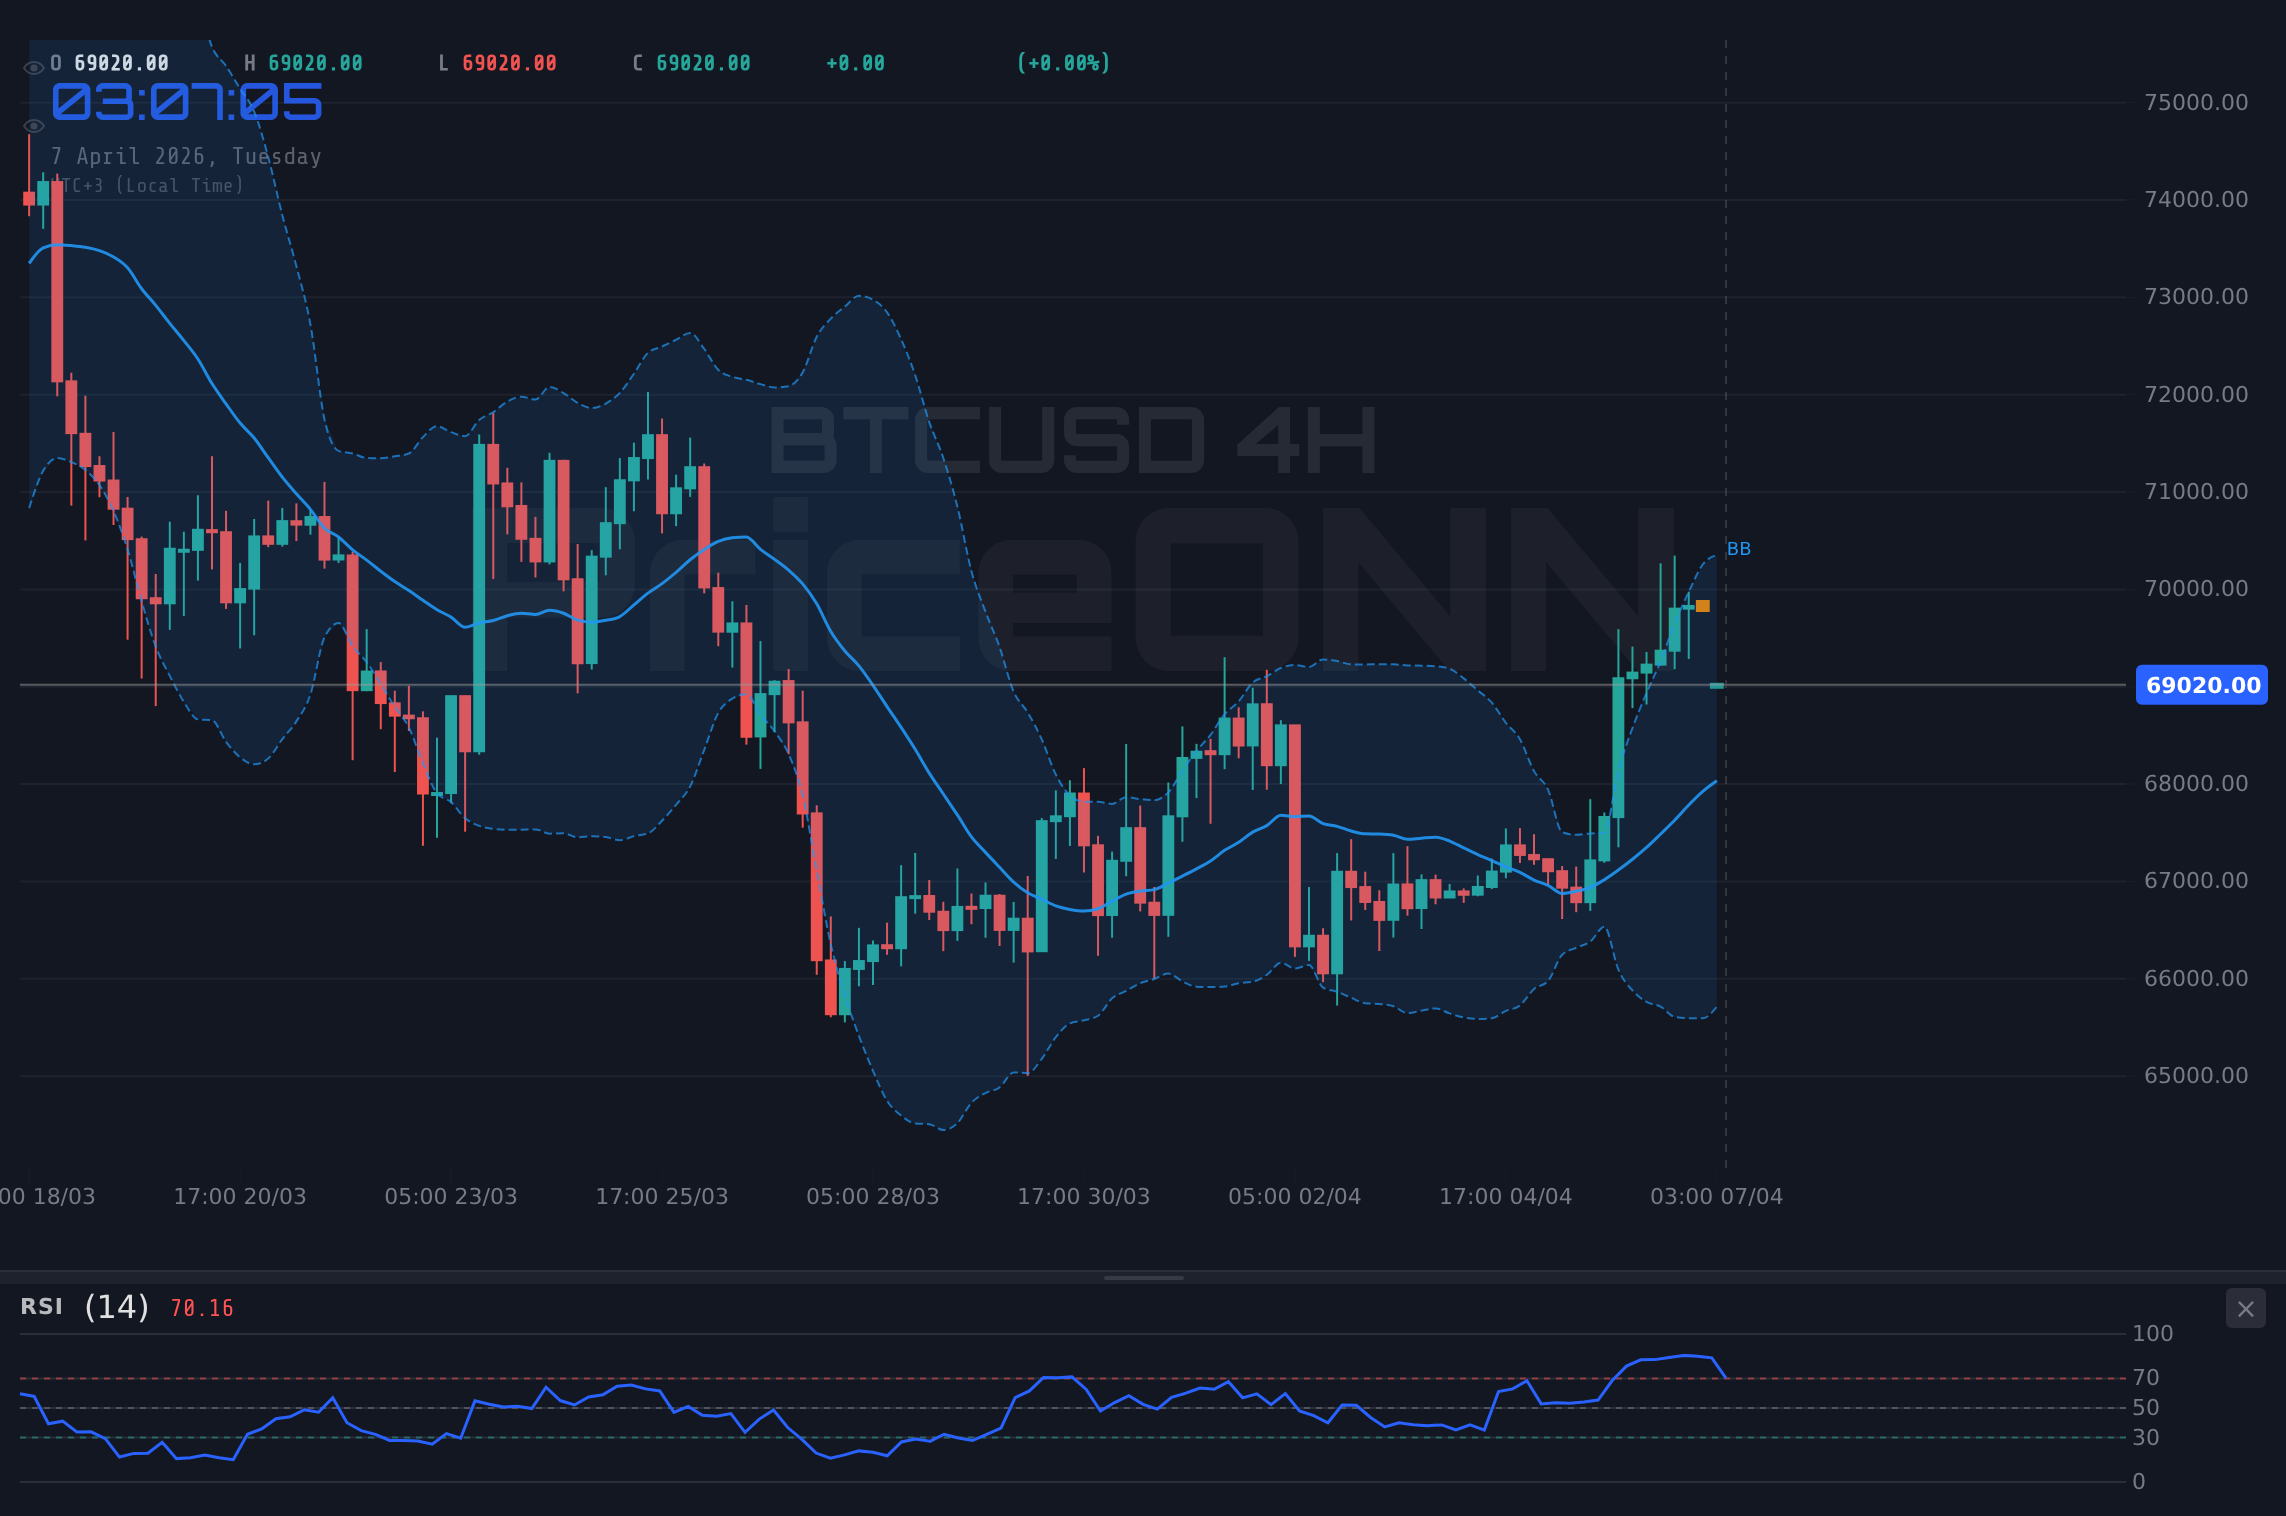
The daily chart presents an even more compelling picture, with the RSI at 50.92 sitting squarely in neutral territory, indicating a balance between buyers and sellers. This suggests that the market is in a state of equilibrium, awaiting a significant catalyst to break the stalemate. The MACD on the daily chart is positive, with the MACD line above its signal line, reinforcing the idea that the longer-term trend remains bullish, despite short-term fluctuations. The Bollinger Bands, a volatility indicator, show the price trading above the middle band on the daily and 4-hour charts, which is generally a bullish sign, but the 1-hour chart shows it below the middle band, adding to the conflicting signals. The Stochastic on the daily chart, with %K at 63.15 and %D at 43.12, shows a bullish crossover, further supporting the idea that the longer-term trend is still upward. However, the ADX at 18.34 on the daily chart indicates a weak trend, suggesting that the current price action might be more range-bound than trending strongly in either direction.
The Macroeconomic Crosscurrents: DXY and Inflation
The broader macroeconomic environment plays a crucial role in shaping Bitcoin's price action, especially its correlation with traditional risk assets and safe-haven currencies. The US Dollar Index (DXY), currently at 99.8, is a significant factor to monitor. A rising DXY typically puts pressure on risk assets like Bitcoin, as a stronger dollar makes dollar-denominated assets more expensive for holders of other currencies. The DXY's current upward momentum, supported by an RSI of 60 and positive MACD on the 1-hour chart, suggests that dollar strength could continue to be a headwind for BTCUSD. However, the DXY's ADX at 17.95 on the 1-hour and 16.18 on the 4-hour charts indicates a weak trend, meaning its influence might be limited unless a stronger directional move emerges. This delicate balance means that while dollar strength is a potential risk, it's not an insurmountable one at this precise moment.
Inflationary pressures and the subsequent central bank responses remain a dominant theme in financial markets. While specific high-impact economic releases were not available in the immediate data feed, the general expectation is that central banks are closely monitoring inflation data. Any signs of sticky inflation could lead to prolonged higher interest rates, which historically tends to dampen enthusiasm for speculative assets like cryptocurrencies. Conversely, signs of cooling inflation could pave the way for potential interest rate cuts, a scenario often viewed as bullish for risk assets. The current lack of concrete recent economic data in the provided feed means that market participants are likely trading on anticipation and speculation regarding future inflation reports and central bank commentary. This uncertainty can lead to increased volatility and range-bound price action as the market awaits clearer signals.
On-Chain Analysis: What the Network Reveals
Beyond price action and macroeconomics, the underlying health and activity of the Bitcoin network itself provide invaluable insights. While specific on-chain metrics like active addresses, whale movements, or exchange flows were not provided in the live API data, we can infer general trends based on price action and market sentiment. The fact that Bitcoin is hovering around $69,000 after a significant run-up suggests that a large number of holders are either realizing profits or are hesitant to push prices significantly higher without renewed conviction. If we were to see a surge in active addresses and transaction volumes, particularly during dips, it would signal strong retail and institutional accumulation, supporting a bullish outlook. Conversely, a decline in active addresses coupled with large outflows from exchanges to private wallets could indicate that holders are moving assets to secure them, potentially anticipating a period of consolidation or correction.
Whale activity, defined as addresses holding large amounts of Bitcoin, is another critical factor. Significant accumulation by whales often precedes major price movements, while large sell-offs can signal a shift in sentiment. Without direct data, we must infer based on price action. The current consolidation around $69,000 could be interpreted in multiple ways: whales might be accumulating at these levels, preparing for another leg up, or they might be distributing their holdings gradually to unsuspecting buyers, preparing for a downturn. The lack of a clear trend on the daily ADX (18.34) further complicates this, suggesting that large players may not be aggressively positioning themselves yet, leading to a more indecisive market. The upcoming days will be crucial for observing any shifts in these on-chain dynamics.
The Bull's Roadmap: Charting a Path to New Highs
For the bulls to regain firm control and push BTCUSD towards new all-time highs, several conditions must be met. The immediate hurdle is the resistance level at $69,328, followed by $69,842 and then the psychological $70,000 mark. A decisive daily close above $69,328 would be the first crucial signal, indicating that short-term bearish momentum is being overcome. This would ideally be accompanied by increasing volume and a confirmation from the RSI moving back above 50, preferably towards the 60-70 zone, suggesting strong buying interest. A break above $69,842 would further solidify the bullish case, potentially triggering a rush towards the $70,000 level and beyond. The 4-hour chart’s bullish signals, including the positive MACD and a generally supportive RSI above 50, provide a foundation for this scenario. For this bullish thesis to play out, we would need to see the 1-hour indicators also align, with the RSI moving out of its bearish zone and the MACD turning positive.
The confirmation of this bullish scenario would likely involve a sustained upward move, potentially targeting the next significant resistance at $70,099 and then pushing towards the upper bounds of the daily Bollinger Bands. Historically, strong upward trends are often characterized by higher lows and higher highs, and a break above the current consolidation range would be the first step in establishing a new upward trajectory. The strength of the trend, as measured by the ADX, would need to increase from its current weaker readings on the daily chart to confirm a solid trend continuation. If Bitcoin can successfully break and hold above $69,328, the probability of reaching higher targets increases significantly, especially if accompanied by positive news flow or increased institutional adoption, such as new ETF inflows or positive regulatory developments. The key is a decisive break with conviction, not a mere wick above the level.
The Bear's Gambit: Testing the Support Structure
Conversely, if Bitcoin fails to sustain its current price level and the bearish signals on the shorter timeframes gain traction, the bears could seize control. The immediate support level to watch is $68,557. A break below this level on significant volume would signal a potential reversal of the recent upward momentum. This would be further confirmed if the 1-hour RSI drops below 40, and the MACD turns decisively negative. Following a break of $68,557, the next support to watch is $68,300. A sustained move below this level would likely accelerate selling pressure, potentially leading to a cascade of stop-losses being triggered and pushing the price towards the more significant support at $67,786. This scenario would be amplified if the DXY continues its upward trend, or if negative news emerges from the crypto space, such as regulatory crackdowns or significant security breaches.
The daily chart's ADX at 18.34 indicates a weak trend, meaning that a break of support could lead to a relatively swift move downwards if momentum catches hold. If BTCUSD falls below $67,786, the next major support level identified on the daily chart is $66,902.33. A failure to hold this level could signal a deeper correction, potentially testing the psychological $66,000 mark and even lower. This bearish outlook would be supported by a divergence in the 4-hour and daily charts, where the bullish signals could start to falter, with RSI readings declining and MACD lines crossing downwards. Such a move would suggest that the recent gains were a bull trap, and a more significant price retracement is on the cards. The market sentiment would likely turn risk-off, with investors fleeing to safer assets.
The Waiting Game: Consolidation and Range-Bound Action
Given the conflicting signals across different timeframes and the current neutral readings on the daily chart, a period of consolidation or range-bound trading is a highly plausible scenario. In this environment, BTCUSD would likely trade within a defined range, struggling to break decisively above resistance or below support. The immediate range appears to be between the support at $68,557 and resistance at $69,328. Price action within this range would be characterized by lower volume and a lack of clear direction, making it challenging for traders to find high-conviction setups. The ADX readings across multiple timeframes, particularly the weaker trend strength indicated on the daily chart, support this possibility. This scenario often plays out when the market is digesting recent price action, awaiting fresh catalysts or clearer macroeconomic direction.
During a consolidation phase, traders might focus on smaller, intraday moves within the established range, looking for bounces off support and rejections at resistance. However, the risk here is that these smaller moves can be whipsawed by sudden volatility. The key indicators, such as RSI and Stochastic, would likely oscillate between neutral and overbought/oversold territory without committing to a sustained direction. This prolonged indecision can be frustrating for trend-following traders but can present opportunities for range traders. The market sentiment would likely remain cautious, with a 'wait-and-see' approach prevailing until a clear breakout or breakdown occurs. The interplay between the DXY and potential upcoming economic data releases will be crucial in determining whether this consolidation phase eventually leads to a breakout or a breakdown.
The Probable Path: What the Data Suggests
Assessing the probabilities, the current technical picture on BTCUSD presents a cautiously bullish long-term outlook, but with significant short-term uncertainty. The daily chart indicators, particularly the RSI and MACD, suggest that the underlying trend remains positive, supporting a higher probability for eventual upside continuation. However, the immediate bearish signals on the 1-hour chart and the weak trend strength indicated by the ADX across timeframes cannot be ignored. The potential for consolidation is therefore quite high. Given the current price at $69,003, the immediate resistance at $69,328 and support at $68,557 define a tight range. A break above $69,328, confirmed by increasing volume and supportive hourly indicators, would lean the probabilities towards a bullish scenario, targeting $69,842 and potentially $70,000. Conversely, a decisive break below $68,557 would shift the probabilities towards a bearish scenario, targeting $68,300 and $67,786.
Considering the conflicting signals, the most likely scenario in the very short term (intraday to 1-2 days) is continued consolidation or a test of the immediate support. The probability of a clear breakout or breakdown within the next 24-48 hours is moderate. I would assign a probability of 50% to a consolidation scenario, 30% to a bullish breakout, and 20% to a bearish breakdown. This assessment is heavily dependent on upcoming news flow and any shifts in the DXY or broader market risk appetite. The failure of the 4-hour and daily charts to show overwhelmingly strong trending signals (ADX readings are moderate at best) suggests that the market is not yet fully committed to a new direction. Therefore, patience and waiting for clearer confirmation signals will be paramount for any trading decisions.
What I'm Watching This Week
As we move through the week, several key triggers will dictate BTCUSD's next significant move. First, I'm watching for a daily close above the $69,328 resistance level. This would be a strong signal for the bulls, suggesting that the consolidation is breaking to the upside. Confirmation would come from rising volume and improved short-term indicators. Second, I'll be monitoring the $68,557 support level. A clear break below this on significant volume, especially with a bearish divergence on the 1-hour RSI, would be a strong signal for the bears, potentially opening the door for a move towards $67,786. Finally, I am keeping a close eye on the DXY. If it breaks above its immediate resistance and shows sustained strength, it could act as a drag on Bitcoin. Conversely, any weakness in the dollar could provide a tailwind for BTCUSD. The interplay between these technical levels and macro factors will be critical in determining the next phase of Bitcoin's price action.
Bearish Scenario: The Support Test
20% ProbabilityNeutral Scenario: The Range-Bound Grind
50% ProbabilityBullish Scenario: The Breakout Attempt
30% ProbabilityFrequently Asked Questions: BTCUSD Analysis
What happens if BTCUSD breaks above the $69,328 resistance level?
A sustained daily close above $69,328, confirmed by strong volume and positive short-term indicators, would likely target $69,842. This would signal a continuation of the bullish trend, potentially pushing towards new all-time highs around $70,099.
Should I buy BTCUSD at current levels of $69,003 given the mixed RSI signals?
Buying at $69,003 requires caution due to conflicting RSI signals across timeframes. A more prudent approach would be to wait for confirmation: a break above $69,328 with strong volume, or a bounce from support near $68,557. Risk management is key.
Is the 1-hour RSI at 48.3 a sell signal for BTCUSD right now?
An RSI of 48.3 on the 1-hour chart suggests bearish momentum is building, but it is not yet in oversold territory. While it indicates caution for intraday traders, it's not a standalone sell signal, especially with longer-term charts showing more neutral to bullish sentiment. Confirmation is needed.
How will the DXY at 99.8 affect BTCUSD this week?
With the DXY at 99.8 and showing some upward momentum, dollar strength could act as a headwind for BTCUSD. However, the DXY's trend strength is currently weak, limiting its immediate impact. A significant move by the DXY above 100 could put more pressure on Bitcoin, while a retreat below 99 could offer some relief.
Track markets in real-time
AI-powered analysis, technical indicators and real-time price data.
Join Our Telegram Channel
Breaking market news, AI analysis and trading signals instantly.
Join Channel