
ETHUSD Trades Near $2,107: Key Levels to Watch Amidst Shifting Crypto Sentiment
ETHUSD is hovering around $2,107 as traders digest mixed signals from technicals and a cautious crypto market. Key levels to watch include support at $2,071 and resistance at $2,196.
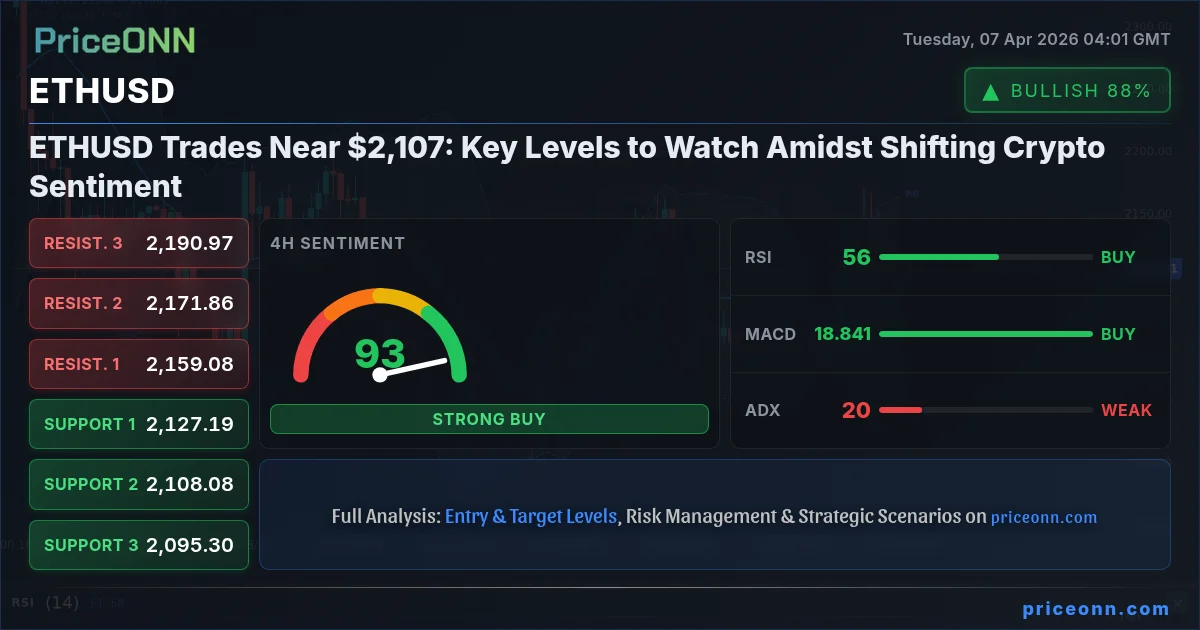
The cryptocurrency market is often a whirlwind of activity, and right now, Ether (ETHUSD) is finding itself at a critical juncture, trading near the $2,107 mark. This price point isn't just a random number; it represents a delicate balance between lingering bullish momentum and the ever-present threat of broader market shifts. With the digital asset space navigating a complex landscape of institutional interest, regulatory whispers, and the ever-important Bitcoin dominance, understanding the immediate price action for ETHUSD becomes paramount for any serious trader or investor looking to position themselves effectively. The current technical readings offer a mixed bag, suggesting that while opportunities may exist, they come with significant caveats. This analysis dives deep into the current technical and fundamental underpinnings, aiming to decipher where ETHUSD might be headed next and what crucial levels traders should be watching closely.
- RSI at 45.35 signals waning bearish momentum on the 1-hour chart, suggesting a potential for a short-term bounce.
- Critical support for ETHUSD sits at $2,071.63, a level tested on the daily chart, with a break below potentially triggering further downside.
- The MACD histogram shows negative momentum on the 1-hour timeframe, indicating selling pressure is still present.
- Market sentiment is influenced by Bitcoin's correlation and broader risk appetite, with DXY strength posing a potential headwind.
Navigating the $2,107 Ether Crossroads
Ether's current position around $2,107 presents a fascinating technical picture. On the 1-hour chart, the Relative Strength Index (RSI) at 45.35 indicates that while the downward momentum has been present, it's not yet in deeply oversold territory, leaving room for a potential short-term rebound. However, the MACD histogram, also showing negative momentum, suggests that sellers are still active. This divergence between potential for a bounce and persistent selling pressure is precisely why traders need to be extra vigilant. The market is not giving a clear signal, and that often means caution is the best policy. A daily close below the $2,071.63 support level would be a significant bearish development, potentially opening the door for a move towards the next support at $1,996.96. Conversely, holding above this key support could set the stage for a retest of the immediate resistance.
The broader crypto market sentiment plays a crucial role here. Bitcoin, the market leader, is currently trading around $68,770 with a mixed technical outlook on its daily chart, showing a neutral trend despite some bullish signals on shorter timeframes. This correlation means that any significant move in BTC often influences ETHUSD. If Bitcoin experiences a sharp downturn, Ether is likely to follow suit, especially if key support levels break. The Dollar Index (DXY), currently at 99.86 and showing a strong upward trend on the daily chart, also adds another layer of complexity. A stronger dollar typically correlates with lower prices for risk assets like cryptocurrencies, acting as a headwind for ETHUSD's ascent.
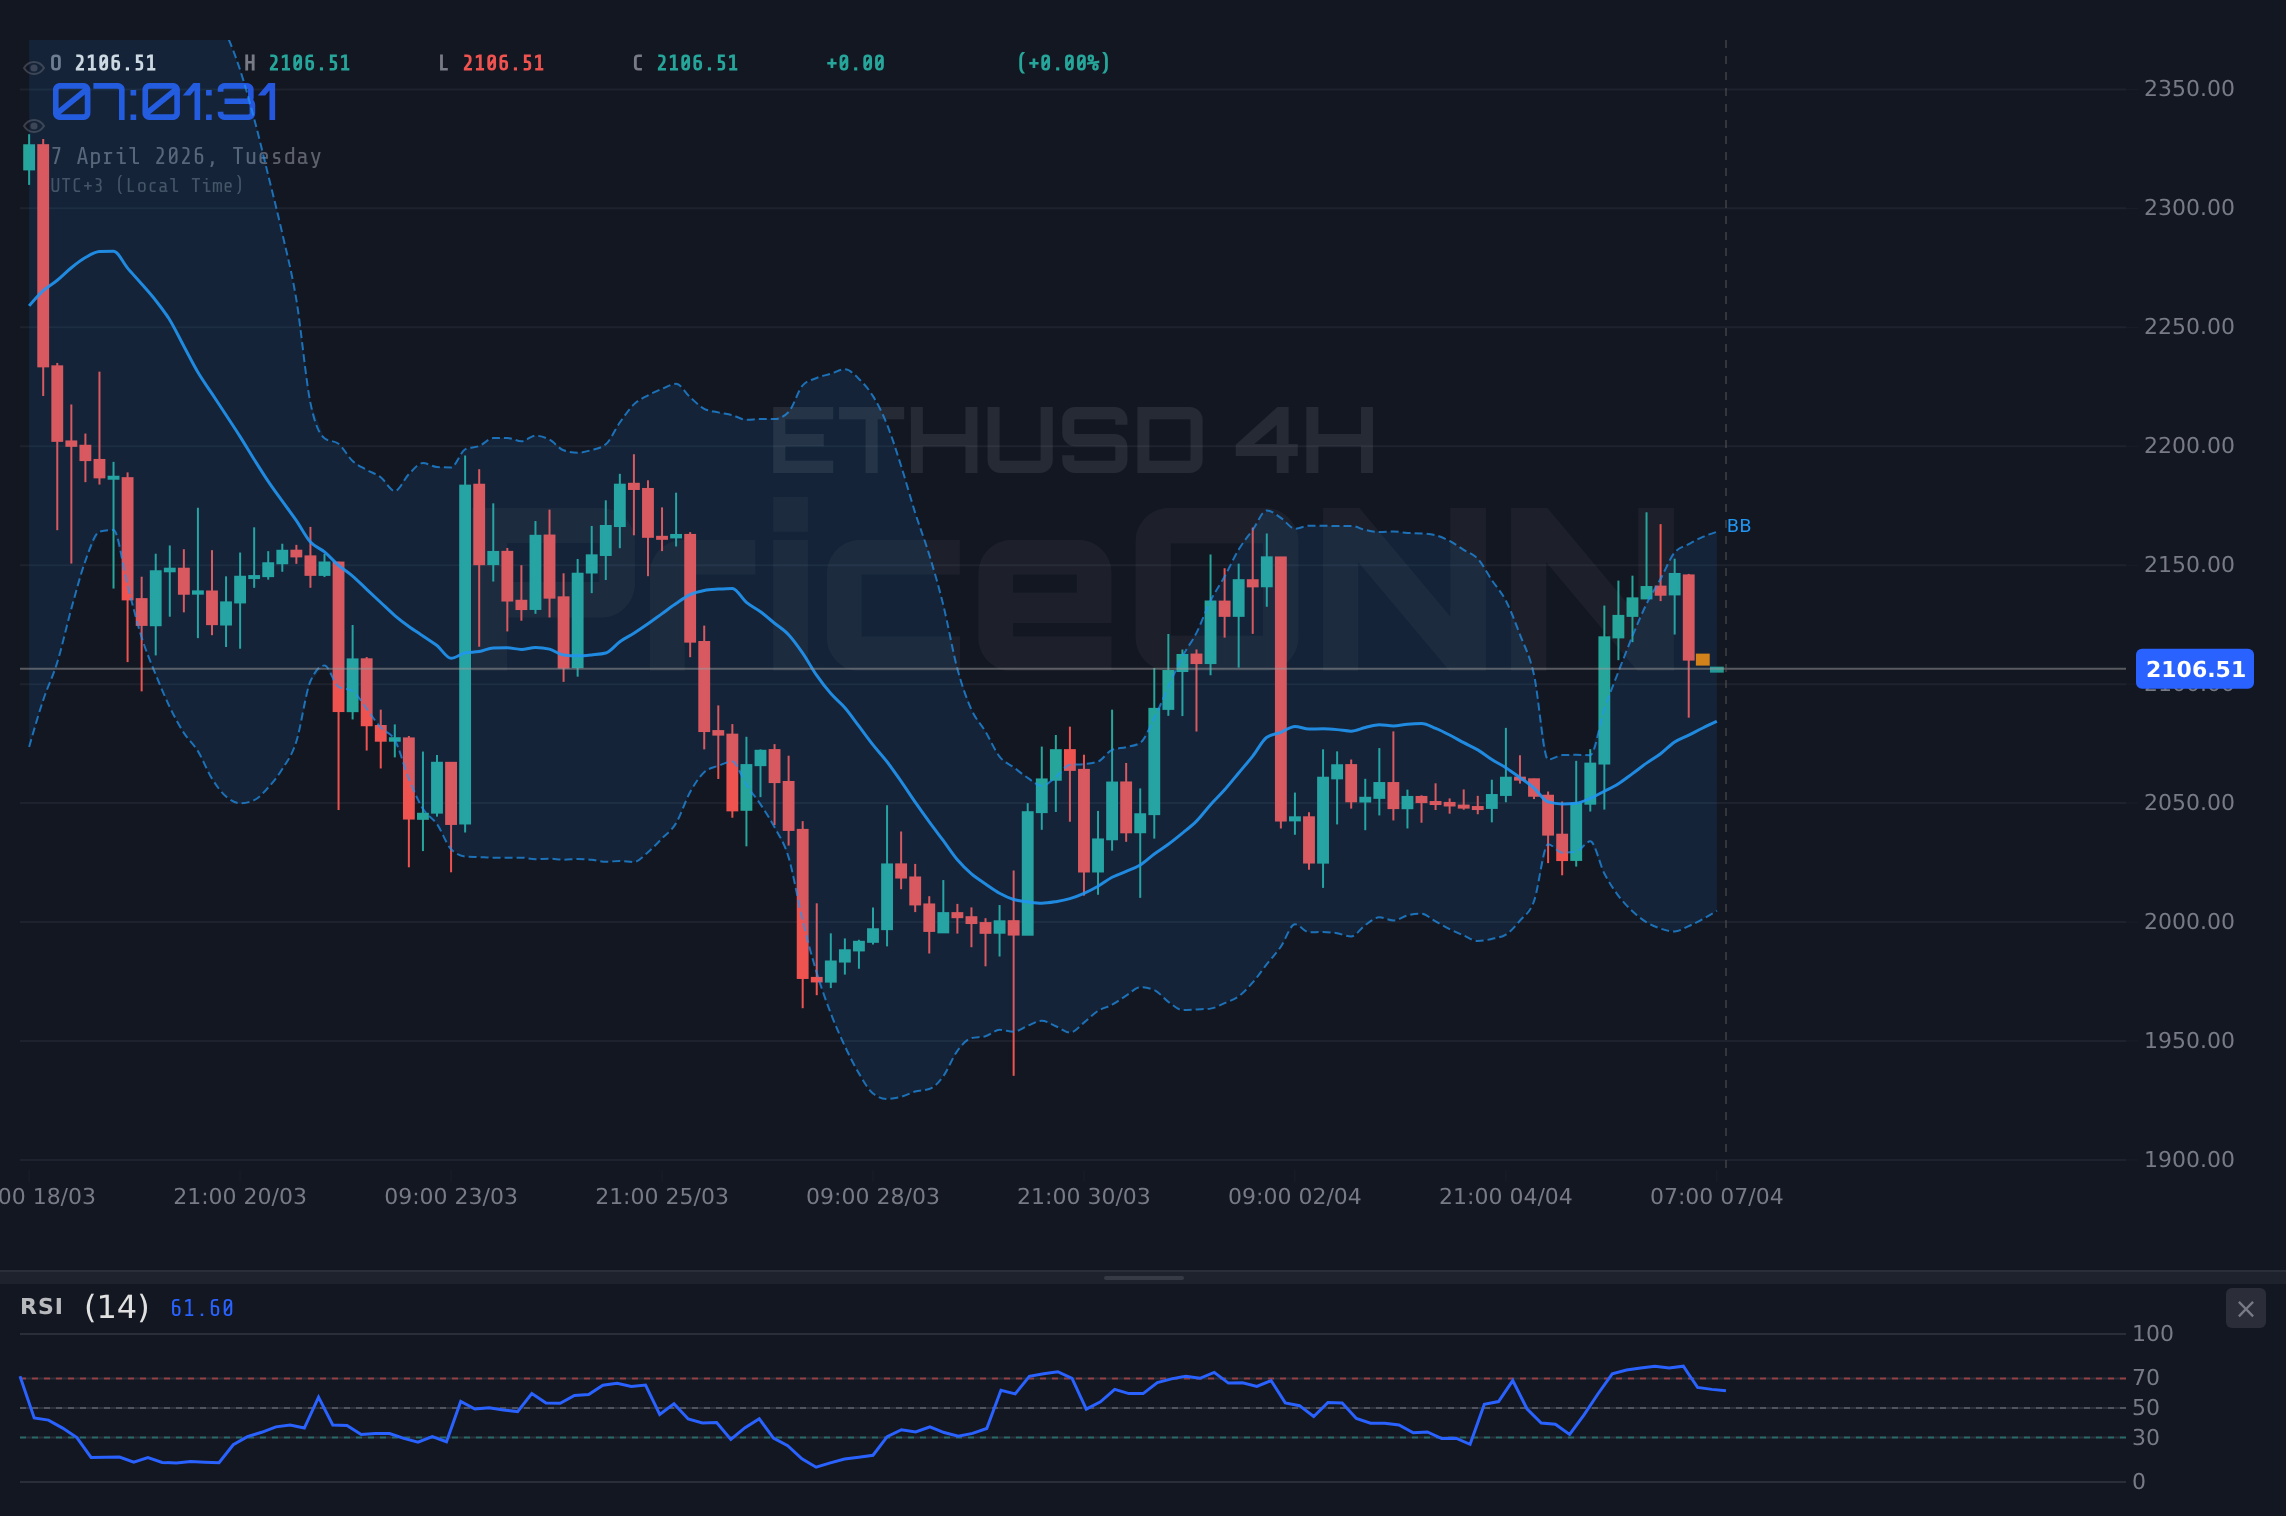
The $2,071 Support: A Line in the Sand?
Digging deeper into the daily chart, the support at $2,071.63 emerges as a critical level for ETHUSD. This isn't just an arbitrary number; it's a price point that has held significance in recent trading sessions, acting as a floor against further declines. A sustained break below this level would signal a loss of conviction among buyers and could invite significant selling pressure. The ADX indicator on the daily timeframe is at a robust 42.78, confirming a strong downward trend. This suggests that if $2,071.63 gives way, the subsequent move could be swift and decisive, driven by the existing trend strength.
On the flip side, if ETHUSD manages to hold its ground above $2,071.63, we could see a potential consolidation or even a retest of higher levels. The 4-hour chart shows a bullish trend with an RSI of 55.64, indicating some upward momentum is present. However, the Stochastic indicator on this timeframe is showing a bearish signal (%K
Risk of Breakdown: A daily close below $2,071.63 would invalidate any short-term bullish outlook and could accelerate losses towards $1,996.96.
The interplay between these support and resistance levels, coupled with the prevailing trend strength indicated by the ADX, paints a picture of a market at a crossroads. The 1-hour chart's ADX of 31.26 further reinforces the idea that downward trends are currently strong, making any bounce fragile unless significant buying conviction emerges. This is a market where patience is key; waiting for a clear break of either the support or resistance zones, confirmed by other indicators, will be crucial for managing risk effectively.
On-Chain Metrics: A Mixed Bag for Ether
Beyond the price charts, the underlying on-chain metrics for ETHUSD offer a similarly mixed perspective. Active addresses, a key indicator of network usage and user engagement, have seen fluctuations but haven't shown a decisive surge that would signal strong new adoption. While the network remains robust, the lack of explosive growth in active users tempers immediate bullish enthusiasm. Whale movements, tracked by analyzing large holder transactions, have also been somewhat subdued. Significant accumulation by whales could signal a bottoming process, while large sell-offs would confirm bearish sentiment. Currently, the data suggests a cautious stance from major players, neither aggressively buying nor selling.
Exchange flows provide another piece of the puzzle. A consistent net outflow of ETH from exchanges to cold storage wallets is generally seen as a bullish sign, indicating that investors are holding for the long term. Conversely, a net inflow into exchanges can precede sell-offs as holders prepare to liquidate. While recent flows have not shown a dramatic trend, monitoring these movements is vital. Any significant shift towards inflows could be an early warning sign of impending downward pressure on ETHUSD.
The overall health of the Ethereum ecosystem, measured by Total Value Locked (TVL) in DeFi protocols and NFT market activity, also warrants attention. While DeFi remains a cornerstone of Ethereum's utility, recent trends in TVL have been sensitive to broader market sentiment and interest rate environments. Staking yields, a key incentive for holding ETH, remain a fundamental attractant, but they are unlikely to counteract strong bearish price action on their own. The gas fees, while not excessively high at current levels, are also a factor; persistently high fees can deter smaller users and impact network activity.
Focus on Exchange Flows: Keep a close eye on ETH moving onto exchanges. A sustained net inflow is a bearish sign that often precedes price drops.
Regulatory Landscape and Institutional Adoption
The regulatory environment continues to be a significant overhang for the entire cryptocurrency market, and Ether is no exception. Recent news regarding potential SEC actions or statements on crypto assets, even if not directly targeting ETH, can create ripples of uncertainty. While the approval of Bitcoin ETFs has been a landmark event, the path for Ethereum ETFs remains less clear, adding a layer of speculative tension. Any concrete developments, positive or negative, regarding Ethereum ETFs or broader regulatory frameworks could significantly impact ETHUSD's price trajectory.
Institutional adoption is a double-edged sword. On one hand, continued interest from traditional finance players in digital assets, including potential investments in Ethereum-based products, provides a fundamental underpinning for long-term growth. However, institutional flows can also be fickle, reacting sharply to macroeconomic shifts or regulatory news. The correlation between ETHUSD and traditional risk assets like the S&P 500 (currently at 6572.87 and showing a strong uptrend on the 1-hour chart, but a bearish daily trend) means that a broad risk-off sentiment in equities could easily spill over into the crypto market, putting downward pressure on Ether.
The ongoing narrative around Bitcoin dominance also affects altcoins like Ether. When Bitcoin strengthens significantly relative to the rest of the market, it can absorb liquidity that might otherwise flow into altcoins. Conversely, periods of altcoin outperformance, often termed 'altcoin seasons,' can see ETHUSD rally strongly, especially if it leads the charge. Currently, Bitcoin's mixed signals mean that Ether's independent momentum will be key, but it cannot entirely escape the gravitational pull of its larger counterpart.
DXY Impact: With the Dollar Index (DXY) showing a strong daily uptrend towards 99.92, expect it to act as a headwind for ETHUSD, potentially capping rallies unless DXY reverses sharply.
Technical Confluence: What the Indicators Are Saying
Let's revisit the technical indicators to synthesize the picture. On the 1-hour chart, the RSI at 46.75 for XAUUSD and 50.92 for XAGUSD suggest neutral to slightly bearish sentiment in precious metals, which can sometimes correlate with crypto's risk appetite. For EURUSD (1.15347), the daily trend is decidedly bearish, indicating a potential flight to the dollar which could negatively impact ETHUSD. Meanwhile, USDJPY at 159.825 is showing a strong daily uptrend, reinforcing the dollar's strength narrative.
Looking at ETHUSD specifically, the 1-hour chart presents a conflict: RSI at 45.35 is leaning bearish, but Stochastic (%K=25.18, %D=23.56) is showing a bullish signal from oversold territory. The MACD is negative, and the ADX at 30.65 confirms a strong downtrend on this short timeframe. This suggests any bounce might be short-lived unless confirmed by stronger buying volume and a break of immediate resistance.
The 4-hour chart offers a slightly more optimistic view, with a bullish trend and RSI at 55.64. However, the Stochastic has flipped to a bearish signal (%K=72.17, %D=82.55), and the ADX at 19.66 indicates a weaker trend. This conflicting data across different timeframes underscores the choppiness of the current market. Traders are likely waiting for a clearer signal, perhaps a decisive move above the $2,190.97 resistance on this timeframe, or a confirmed breakdown below the $2,071.63 daily support.
On the daily timeframe, the picture is also complex. The trend is classified as bullish (Strength: 81%), but the RSI at 51.22 is neutral, and the MACD is positive but showing signs of potential weakening. Stochastic is bullish (%K=72.82, %D=60.99), but the ADX at 11.74 signals a very weak trend. This means that while the longer-term trend might still hold some favor for bulls, the immediate path forward is unclear and prone to volatility. The key takeaway is that ETHUSD is currently in a tug-of-war, and the outcome will likely depend on broader market catalysts and a decisive break of key technical levels.
Conflicting Signals: The Stochastic indicator on the 4-hour chart has flipped bearish (%K at 72.17, %D at 82.55), contradicting the bullish trend. This highlights the need for caution and confirmation before committing to a trade.
Trade Scenarios for ETHUSD
Bearish Scenario: Downside Pressure Mounts
65% ProbabilityBullish Scenario: Recovery Above Key Levels
25% ProbabilityNeutral Scenario: Consolidation Around $2,107
10% ProbabilityFrequently Asked Questions: ETHUSD Analysis
What happens if ETHUSD breaks below the $2,071.63 support level?
A decisive daily close below $2,071.63 would invalidate the current bullish trend on the daily chart and likely trigger further selling pressure. This could accelerate losses towards the next significant support at $1,996.96, as confirmed by the strong daily downtrend indicated by the ADX at 42.78.
Should I consider buying ETHUSD at current levels around $2,107 given the mixed signals?
Buying at current levels carries significant risk due to conflicting indicators across timeframes. A more prudent approach would be to wait for confirmation: either a clear break above $2,196.61 resistance with strong volume, or a bounce from $2,071.63 support confirmed by a bullish divergence on shorter timeframes.
Is the RSI at 45.35 on the 1-hour chart a sell signal for ETHUSD?
An RSI of 45.35 on the 1-hour chart suggests that while selling pressure has been dominant, it's not yet in oversold territory, leaving room for a potential short-term bounce. However, combined with negative MACD momentum, it indicates that the downward trend remains intact and any bounce might be capped.
How might the strong DXY trend affect ETHUSD's price action this week?
The Dollar Index (DXY) is showing a strong daily uptrend, currently near 99.86. A stronger dollar typically acts as a headwind for risk assets like ETHUSD, potentially suppressing rallies and increasing downside pressure. Traders should monitor DXY's direction closely as it could significantly influence ETHUSD's ability to break key resistance levels.
The path forward for ETHUSD hinges on its ability to overcome immediate resistance or hold crucial support. While the daily chart still shows some underlying bullishness, the conflicting signals across shorter timeframes and the broader macroeconomic headwinds, particularly from a strengthening dollar and cautious risk sentiment, suggest that volatility is likely to remain elevated. Traders must prioritize risk management, waiting for clear confirmation signals before entering positions. The market is currently in a state of flux, and patience will be rewarded for those who can navigate these choppy waters with discipline.
Track markets in real-time
AI-powered analysis, technical indicators and real-time price data.
Join Our Telegram Channel
Breaking market news, AI analysis and trading signals instantly.
Join Channel