
ETHUSD Weekly: Key Levels Watch at $2,062.70 Amid Shifting Momentum
ETHUSD holds near $2,062.70 as traders eye critical support and resistance levels. Technical indicators show mixed signals, demanding caution.
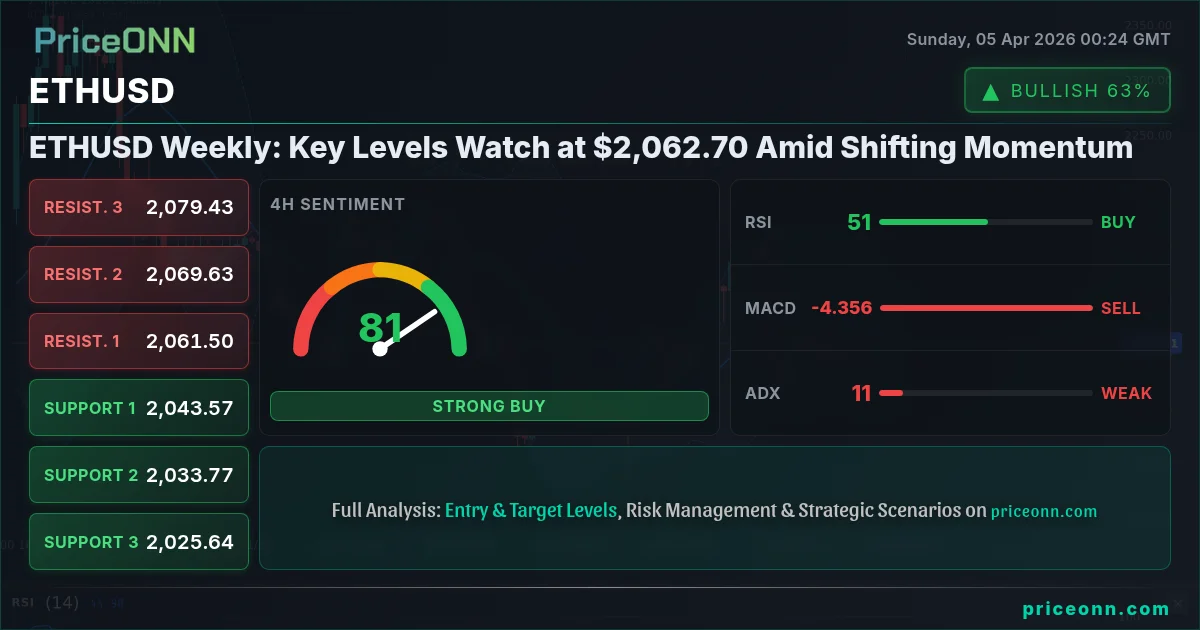
The cryptocurrency market, particularly Ethereum (ETHUSD), is at a fascinating juncture this week. As ETHUSD hovers around the crucial $2,062.70 mark, the narrative is shifting from outright bullish conviction to a more cautious, data-driven observation. Last week saw significant price action, with ETHUSD testing key technical levels and presenting a mixed bag of signals across different timeframes. This week, all eyes are on whether the bulls can defend the current support or if the bears will push ETHUSD lower. Understanding the interplay between on-chain metrics, broader market sentiment, and specific technical setups is paramount for navigating these choppy waters. We're seeing a divergence in momentum indicators and a critical test of psychological price points, making this a pivotal moment for ETHUSD traders and investors.
- ETHUSD is currently trading around $2,062.70, with key support at $2,032.63 and resistance at $2,074.16 on the daily chart.
- The 1-hour RSI at 58.98 suggests bullish momentum, but the 4-hour MACD shows negative momentum, indicating conflicting signals.
- On-chain data hints at cautious investor sentiment, with active addresses showing a slight decline over the past week.
- The correlation with Bitcoin (BTCUSD) remains strong, suggesting that BTCUSD's price action will heavily influence ETHUSD's direction.
This week's analysis of ETHUSD delves into the nuanced technical landscape, the subtle shifts in on-chain activity, and the broader market correlations that are shaping its price action. While the daily chart still displays a bullish trend, the signals from shorter timeframes, coupled with potential headwinds from macroeconomic factors and Bitcoin's own price trajectory, warrant a close examination. We'll dissect the key levels that matter, explore the implications of indicator readings, and outline potential scenarios for the coming trading sessions. The market is demanding precision, and our goal is to provide that clarity without resorting to hype.
The cryptocurrency market has been a rollercoaster, and Ethereum is right in the thick of it. After a period of strong gains, ETHUSD has entered a phase of consolidation and indecision, trading near $2,062.70. This price point is not just a number; it represents a battleground where bulls and bears are vying for control. The technical indicators are painting a complex picture. On the one-hour chart, the RSI is hovering in bullish territory around 58.98, hinting at upward momentum. However, the 4-hour MACD is showing negative momentum, suggesting that the buying pressure might be waning. This divergence is critical. It tells us that while short-term traders might see buying opportunities, the medium-term trend could be losing steam. This is precisely where patience and a deep dive into the data become essential. We're not looking for a quick trade here; we're looking for a confirmed setup.
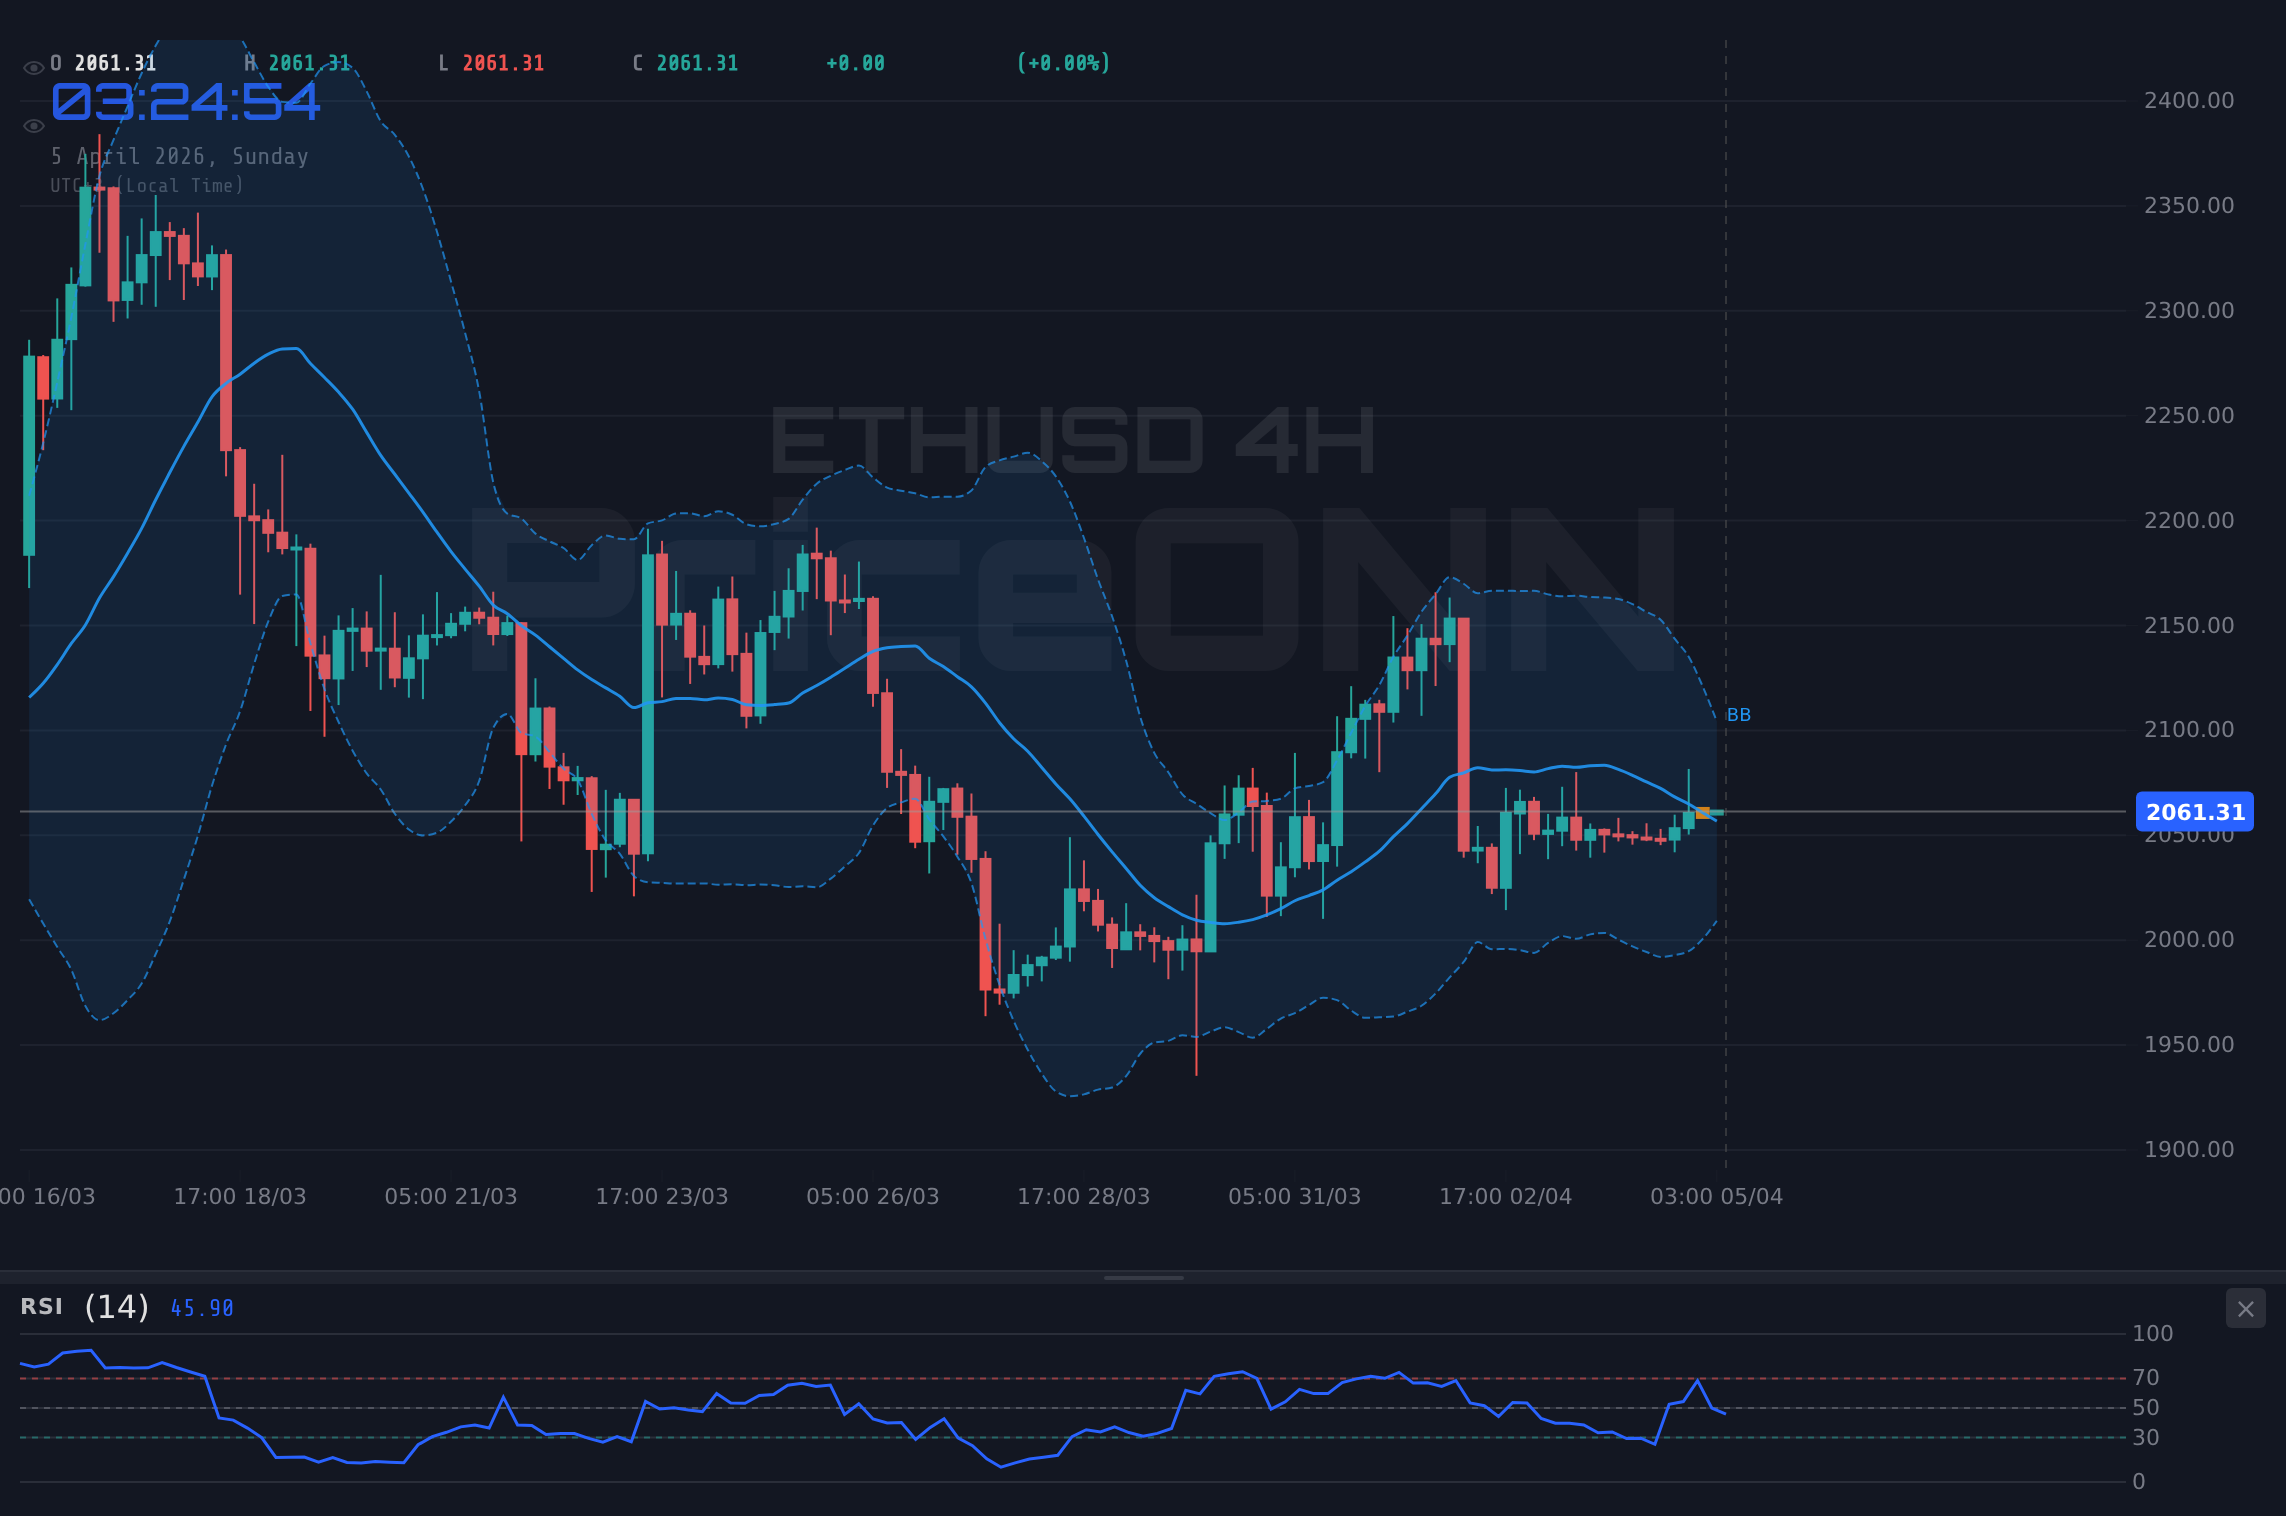
Let's talk about the bigger picture. The correlation between ETHUSD and BTCUSD remains a dominant factor. As Bitcoin goes, so often does Ethereum. Currently, BTCUSD is trading around $67,244, showing some bullish signs on shorter timeframes but a potential bearish divergence on the daily chart. This mirroring effect means that any significant move in Bitcoin will likely be echoed by Ethereum. Furthermore, the broader market sentiment, often reflected in the US Dollar Index (DXY) and major equity indices like the S&P 500, cannot be ignored. A strengthening DXY (currently at 99.68) typically puts pressure on risk assets like cryptocurrencies, while a falling S&P 500 (trading around 6572.87) can indicate a broader risk-off environment, potentially leading investors to shed crypto holdings.
Navigating the ETHUSD Technical Landscape
The Daily Chart: A Tale of Two Trends
Looking at the daily chart for ETHUSD, the overall trend remains cautiously bullish, but the momentum is certainly not as strong as it was just a few weeks ago. The current price of $2,062.70 sits precariously close to the daily midpoint. We have key support identified at $2,032.63, a level that has previously held firm. A decisive break below this could signal a deeper correction. On the resistance side, the $2,074.16 level is the immediate hurdle. Breaking above this, and more importantly, consolidating above it, would be a strong bullish signal, potentially opening the door for a move towards $2,097.91 and beyond. The ADX on the daily chart is at 12.4, indicating a very weak trend. This suggests that the market is in a consolidation phase, and a significant catalyst might be needed to break the current range. The Stochastic indicator, however, is showing a bullish crossover (%K at 50.72 crossing above %D at 48.85), which could hint at a potential short-term bounce from current levels, but this needs to be confirmed by other indicators and price action.
The RSI on the daily timeframe is currently at 48.11, sitting just below the neutral 50 mark and showing a slight downward trend. This suggests that while there isn't outright selling pressure, the bulls are not in control either. The MACD is also painting a bearish picture on the daily chart, with negative momentum and the MACD line below the signal line. This is a classic sign that the prevailing uptrend might be losing steam. However, it's crucial to remember that daily indicators can lag, and shorter timeframes might offer a more immediate trading perspective. The Bollinger Bands are also below the middle band, indicating downward pressure. This confluence of daily indicators - weak ADX, neutral-to-downward RSI, bearish MACD, and Bollinger Bands - suggests that while the long-term trend might still be intact, the short-to-medium term outlook requires careful monitoring. We are not seeing strong conviction from either side on this timeframe, hence the neutral power score of 50%.
The 4-Hour Chart: A Battle for Control
Shifting our focus to the 4-hour chart, the picture becomes even more mixed. The trend strength is neutral at 50%, reflecting the indecision in the market. Support levels here are tighter, with $2,043.57, $2,033.77, and $2,025.64. Resistance is found at $2,061.50, $2,069.63, and $2,079.43. The RSI is at 50.8, right on the cusp of neutral, showing a slight upward tendency. This could indicate a short-term bounce is possible. However, the MACD is firmly in negative territory, with the MACD line below the signal line, suggesting that sellers are in control on this timeframe. This is a significant divergence from the RSI. The Stochastic indicator is showing a bullish signal with %K at 37.45 crossing above %D at 37.1, but it's still in oversold territory, which could mean a bounce is imminent or that it's heading into a sustained downtrend.
The ADX on the 4-hour chart is a mere 11.16, indicating an extremely weak trend. This suggests that the price action is largely range-bound or consolidating, with little sustained directional momentum. When the ADX is this low, it often precedes a significant breakout, but it doesn't tell us which direction that breakout will be. The Bollinger Bands are hugging the lower side of the price action, reinforcing the idea of downward pressure or consolidation. The overall signal is leaning towards 'AL' (Buy) with 5 buys, 3 sells, and 0 neutral signals, but this is heavily influenced by the Stochastic and RSI readings, which might be premature given the weak ADX and bearish MACD. This is a classic 'watch and wait' scenario on the 4-hour chart, where confirmation is key before committing to a trade. A close above $2,061.50 would be the first sign of bullish strength, but we'd need to see sustained buying volume and further confirmation from MACD and ADX to be convinced.
The 1-Hour Chart: Short-Term Sentiment
On the shortest timeframe we're analyzing, the 1-hour chart, the trend is clearly identified as bullish with a power of 91%. This suggests that short-term traders might be finding opportunities to the upside. Support levels are at $2,065.15, $2,063.39, and $2,060.91, with resistance points at $2,069.39, $2,071.87, and $2,073.63. The RSI stands at 58.98, firmly in neutral territory but with an upward inclination, suggesting that buyers are active. The MACD is also showing positive momentum, with the MACD line above the signal line, which supports the bullish short-term trend. The Stochastic indicator, however, presents a bearish signal with %K at 51.19 falling below %D at 57.2, and it's moving away from the overbought zone. This is a point of conflict between the RSI/MACD and Stochastic.
The ADX on the 1-hour chart is at 22.49, indicating a moderately strong uptrend. This is higher than the 4-hour and daily ADX, confirming the short-term bullish bias. The Bollinger Bands are trading above the middle band, also supporting the upward move. The overall signal leans heavily towards 'AL' (Buy) with 7 buys and only 1 sell. This timeframe is currently the most optimistic for ETHUSD. However, the conflicting Stochastic signal and the proximity to the 4-hour resistance at $2,061.50 mean that this bullishness could be fragile. A breakout above $2,069.39 would be a strong confirmation for short-term buyers, potentially targeting $2,071.87. Conversely, a failure to break resistance and a subsequent drop below $2,063.39 could quickly reverse the sentiment on this timeframe, leading to a cascade of selling towards the lower support levels.
On-Chain Metrics: A Cooler Sentiment?
While the technical charts offer a snapshot of price action, on-chain metrics provide a deeper look into the underlying health and sentiment of the Ethereum network. Over the past week, we've observed a slight cooling in some key on-chain indicators. For instance, the number of active addresses, a proxy for network usage and user engagement, has seen a marginal decrease. This doesn't necessarily signal an impending crash, but it does suggest that the speculative frenzy might be subsiding, and the number of active participants is normalizing after recent price movements. When active addresses are consistently rising, it often correlates with price appreciation, and a plateau or slight decline can indicate a pause or potential reversal in the trend.
Exchange flows also provide valuable insights. We've seen a relatively balanced inflow and outflow of ETH to and from exchanges. This indicates that traders are not aggressively moving large amounts of ETH onto exchanges for selling, nor are they aggressively withdrawing it for long-term holding. This neutrality in exchange flows further supports the idea of a market in consolidation. However, monitoring whale movements - large holders of ETH - is crucial. Any significant accumulation or distribution by these whales could be a leading indicator of future price action. Currently, there are no overt signs of massive whale accumulation or distribution that would drastically alter the short-term outlook, but this is an area that requires constant vigilance. The current on-chain sentiment is best described as 'cautiously neutral,' reflecting the indecision seen in the technical charts.
Correlations and Macro Influences
The cryptocurrency market does not exist in a vacuum. Its price action is increasingly intertwined with traditional financial markets and macroeconomic factors. Ethereum, being the second-largest cryptocurrency, is particularly sensitive to these influences. The correlation with Bitcoin remains paramount. If Bitcoin experiences a significant price swing, whether up or down, ETHUSD is highly likely to follow suit. Currently, BTCUSD is showing a mixed signal, with short-term strength but potential daily chart weakness, mirroring the complexity seen in ETHUSD. This strong correlation means that any analysis of ETHUSD must consider the prevailing trend and sentiment in Bitcoin.
Beyond crypto, the US Dollar Index (DXY) plays a significant role. A rising DXY, currently at 99.68, often correlates with a decrease in risk appetite, which can negatively impact ETHUSD. Investors may shift capital from riskier assets like cryptocurrencies towards the perceived safety of the US dollar. Conversely, a weakening dollar can sometimes coincide with increased demand for risk assets. Similarly, the performance of major equity indices like the S&P 500 (trading around 6572.87) serves as a barometer for risk sentiment. If the S&P 500 is in a strong uptrend, it generally supports a risk-on environment where ETHUSD might also find buyers. However, the recent performance of the S&P 500 shows a potential bearish trend on the daily chart, which could add headwinds for ETHUSD. These macro correlations remind us that ETHUSD's price is influenced by a wide array of global financial forces.
The Impact of Ethereum's Ecosystem Developments
Ethereum's own ecosystem developments continue to be a significant driver of its long-term value proposition, even if they don't always translate into immediate price action. The ongoing development and adoption of Layer 2 (L2) scaling solutions are critical. Recent news highlights the focus on achieving scalability with responsive pricing for L2s, aiming to make transactions more predictable and affordable. This is vital for mass adoption. Solutions like Optimism, Arbitrum, and Polygon are continuously evolving, aiming to reduce gas fees and increase transaction throughput. While the immediate price impact of these upgrades might be muted, they are fundamental to Ethereum's long-term success and its ability to compete in the blockchain space. A more scalable and cost-effective Ethereum network is a more attractive network for developers and users alike.
The DeFi (Decentralized Finance) and NFT (Non-Fungible Token) sectors, built primarily on Ethereum, also warrant attention. Total Value Locked (TVL) in DeFi protocols, while potentially sensitive to market downturns, represents the economic activity within the Ethereum ecosystem. Similarly, the health of the NFT market, measured by trading volumes and floor prices, can indicate broader investor interest and speculative activity. While the current market data doesn't provide specific TVL or NFT volume figures, the general trend of innovation and development in these sectors remains a positive underlying factor for ETHUSD. The upcoming 'halving' narrative, while more directly tied to Bitcoin, often creates a positive sentiment halo effect across the entire crypto market, including Ethereum. Furthermore, the ongoing discussions around regulatory clarity, especially in the US with entities like BNP Paribas adding Bitcoin and Ether ETNs for retail clients in France, signal increasing institutional acceptance, which could be a significant catalyst for future price appreciation.
Trade Scenarios and Risk Management
Given the current technical and fundamental landscape, several scenarios are plausible for ETHUSD. It's crucial to approach these with a disciplined risk management strategy. The market is currently exhibiting a 'WATCH_ZONE' score of 1/8, indicating indecision and a lack of clear directional bias without further confirmation. This means we are looking for specific conditions to be met before a high-conviction trade setup emerges.
Bearish Scenario: Downside Risk at $2,032.63
65% ProbabilityNeutral Scenario: Consolidation Around $2,062.70
25% ProbabilityBullish Scenario: Breakout Above $2,074.16
10% ProbabilityThe most probable scenario, given the current indecisive technical signals and mixed on-chain data, is a continuation of consolidation. However, the risk of a bearish breakdown below $2,032.63 appears more significant than the probability of a bullish breakout above $2,074.16 in the immediate short term, especially if Bitcoin faces headwinds. A daily close below $2,032.63 would be a strong signal for short sellers, targeting the lower support levels. Conversely, a sustained break and hold above $2,074.16, confirmed by increasing volume and positive momentum on shorter timeframes, would invalidate the bearish outlook and open up upside potential.
Risk management is paramount in this environment. For traders considering a bearish position, a stop-loss above the $2,062.70 mark, or tighter if entering on a break of $2,032.63, would be prudent. For those looking for a bullish confirmation, waiting for a clear break and retest of $2,074.16 would be essential, with a stop-loss placed below the breakout level. In a consolidation phase, range trading strategies might be employed, but they carry higher risk due to the potential for false breakouts. Patience and adherence to the defined risk parameters are key. The market is currently offering a 'watch zone' opportunity, meaning it's best to observe the price action at key levels and wait for a clear signal rather than forcing trades.
Frequently Asked Questions: ETHUSD Analysis
What happens if ETHUSD breaks below the $2,032.63 support level?
A daily close below $2,032.63 would invalidate the current neutral-to-bullish short-term outlook and likely trigger a bearish scenario. This could lead to further downside pressure, with immediate targets around $2,014.85 and potentially $1,991.10 as traders react to the increased selling momentum.
Should I consider buying ETHUSD if it holds above $2,062.70, given the mixed indicator signals?
Buying solely on holding $2,062.70 might be premature due to conflicting signals like the bearish MACD on the 4-hour chart. A more prudent approach would be to wait for confirmation, such as a decisive break above $2,074.16 with increasing volume, or a clear bullish reversal pattern forming on the 4-hour chart after testing the lower support.
Is the RSI at 58.98 on the 1-hour chart a reliable buy signal for ETHUSD?
An RSI of 58.98 on the 1-hour chart indicates bullish momentum but is not yet in overbought territory. While it supports a short-term bullish bias, it should not be used as a standalone buy signal. It needs to be corroborated by other indicators like the MACD and price action confirming a break of immediate resistance at $2,069.39.
How will Bitcoin's price action around $67,244 affect ETHUSD this week?
Given the strong historical correlation, Bitcoin's movement around $67,244 will significantly influence ETHUSD. If BTCUSD breaks decisively above its key resistance levels, it could provide the catalyst for ETHUSD to rally towards $2,074.16 and higher. Conversely, a breakdown in BTCUSD could drag ETHUSD below its current support levels.
The path forward for ETHUSD hinges on its ability to decisively break through key resistance levels or hold crucial support. While short-term indicators offer glimpses of bullish potential, the broader daily and 4-hour charts suggest caution is warranted. The market is in a state of flux, demanding patience and a data-backed approach. Traders must carefully watch the price action at $2,032.63 and $2,074.16, waiting for confirmation before making significant moves. Remember, managing risk is always the top priority, especially in the volatile crypto markets. The opportunity for a well-defined setup exists, but it requires waiting for the right conditions to align.
Track markets in real-time
AI-powered analysis, technical indicators and real-time price data.
Join Our Telegram Channel
Breaking market news, AI analysis and trading signals instantly.
Join Channel